Research Article
July
2017
Computer Science and Software Engineering
ISSN: 2277-128X (Volume-7, Issue-7)
Comparative Study of AODV, MAODV and RAODV to
Improve Security using TCP Connections
Dr. Sima
Dept of Computer Science, DAV College for Girls Yamunanagar, Haryana, India
Dr. Ashwani Kush
Dept. of Computer Science, Univ College Kurukshetra University, Kurukshetra, Haryana, India
DOI: 10.23956/ijarcsse/SV7I5/0249
Abstract Theoretical—Versatile specially appointed systems have diverse properties as contrast with customary systems. These cause additional difficulties and troubles on security for specially appointed systems. In this paper, another plan to handle security worries in MANET has been recommended and it has been assessed utilizing measurements. In view of the execution assessment, proposals have been made about the importance of the convention under different conditions .The plan has been contrasted and other existing plans. The proposed plan has been joined on ADOV as a contextual investigation.
Keywords – AODV; MAODV; RAODV; Evaluation; Mobile Network Protocols; Wireless Network
I. INTRODUCTION
A mobile ad hoc network (MANET) is a continuously self-configuring, infrastructure-less network of mobile devices connected wirelessly.[18] Each device in a MANET is free to move independently in any direction, and will therefore change its links to other devices frequently. Each must forward traffic unrelated to its own use, and therefore be a router. The primary challenge in building a MANET is equipping each device to continuously maintain the information required to properly route traffic[18]. The system is specially appointed in light of the fact that without brought together organization or altered framework hubs can impart [18]. The system topology may shift quickly and erratically, in light of the versatility of hubs. These trademark makes remote specially appointed systems appropriate for an assortment of utilizations [7, 1]. For fundamental system capacities like parcel sending and directing, security is a key segment. These capacities can be effortlessly influenced if countermeasures are not implanted at the early phases of their outline. In portable impromptu systems (MANETs), secure directing is an essential issue [14, 15]. In this paper, an effort has been made to give secure steering to MANET.
II. ALGORITHM DESCRIPTION
A New routing protocol has been proposed titled (Reverse Ad-hoc On demand Distance Vector) RAODV modifying (Malicious Ad-hoc On Demand Distance Vector) MAODV [17]. In MAODV protocol malicious nodes enters at random locations. RAODV detects these malicious nodes and removes them. In the proposed scheme there are three phases as Route Request, Route Reply and Data Transmission.
Ist Author et al., International Journal of Advanced Research in Computer Science and Software Engineering7(7) ISSN(E): 2277-128X, ISSN(P): 2277-6451, DOI: 10.23956/ijarcsse/SV7I5/0249, pp. 111-116
III. SIMULATION ENVIRONMENT
A comparative study of three protocols AODV, MODV and RAODV have been carried out for 10, 25, 50 and 100 nodes. The simulation has been performed using TCL scripts. The simulation results have been obtained with the help of three metrics as Packet delivery ratio, End to End Delay and Throughput. Results are represented in the form of Graphs. Using these Graphs performance comparisons have been made. To carry out the analysis malicious nodes have been introduced in the script. When these nodes used as routers for data transmission it results in hacker attack. This causes fall of packets. The proposed scheme takes care of these nodes and removes these nodes and generates a new path. This new path will be secured and will result in stable and secured routing.
The simulations have been performed using Network Simulator (NS-2.34) [6]. The traffic sources are CBR (continuous bit–rate). The source-destination pairs are spread randomly over the network. Operating System used is Fedora Linux 12. The results have been derived by writing TCL scripts and generating corresponding Trace and NAM files. The mobility model used is random waypoint model. The configuration area is 650 meter x 650 meter for 10 nodes and the packet size is 512 bytes. For 25 nodes the area becomes 850 meter x 850 meter. For 50 nodes the configuration area increases up to 1 Km x 1 Km and this area increases 3 Km x 3 Km for 100 nodes. Packets start their journey from a random location to a random destination. Same scenario has been used for performance evaluation of all three protocols.
IV. PERFORMANCEEVALUATION
Various quantitative metrics used for evaluating the performance of routing protocols in ad-hoc networks are [5]: Packet Delivery Ratio, End to end delay and throughput. Transmission Control Protocol is the most commonly used protocol on the internet. TCP is a heavyweight protocol it takes more time for setup, in spite of it, it is preferred because it is
(I) Packet delivery ratio:
In Graph 1 performance metrics has been evaluated for AODV, MAODV and for RAODV protocol using 10 TCP traffic agents. The movement pattern is based on Random Waypoint Model and total 5 connections have been established among different moving nodes. 650m X 650m area is used. Speed varies from 1 meter/s to 5 meter per second but pause time remains constant i.e. 400s. PDR of all the protocols seem very close in Graph 5.12. AODV Packet Delivery Ratio varies from 97% to 98%. Malicious nodes enter in AODV and Packet Delivery Ratio goes down and range from 93 to 90 %. Proposed RAODV improves the PDR and it touches to 96% in the start and 94% in the end. Difference among the performances of all the protocols is not high as numbers of nodes are only 10.
n Graph 2 the PDR has been evaluated for AODV, MAODV and RAODV protocols using speed as a parameter with same number of nodes and TCP traffic agents. Pause Time remains constant i.e. 400s and speed varies from 1meter/s to 5 meter/s. In AODV the PDR values computed using received and dropped packets range from 96 % to 94 %, In MAODV, the PDR value range from 83 % to 75 % and in RAODV the PDR value range from 93% to 91 %.
In this scenario the observation is that packets delivered in AODV and RAODV is fairly close to each other this shows efficiency of proposed protocol. MAODV has a low PDR as compare to AODV and RAODV Packet Delivery Ratio. This Graph shows that MAODV performance goes down as speed increases. This indicates when mobility increases more routes become invalid and new routes are necessary. When malicious node receives RREQ they immediately provide RREP using fake routes. When data is transmitted using fake routes malicious nodes drops the packets and this causes falling in PDR.
2 Km x 2Km area is used for 50 nodes in this experiment. The numbers of sources are connected by using TCP connections and Random Waypoint Model is used for performing the simulations. Pause time remains constant i.e. 300s and speed varies from 1meter/s to 5 meter/s. It shows that as speed increases packet loss also increases in AODV and MAODV.
The PDR in RAODV also decreases as speed increases but still PDR of RAODV is better than the PDR of MAODV.
ISSN(E): 2277-128X, ISSN(P): 2277-6451, DOI: 10.23956/ijarcsse/SV7I5/0249, pp. 111-116
Graph 2 Graph 3
It shows that as number of nodes increases number of malicious nodes also increases and this causes fall in PDR. Proposed RAODV detects and removes all the malicious nodes one by one. When RAODV detects malicious nodes at that time some packets had already dropped by malicious nodes, so PDR of RAODV is low as compared to PDR of AODV. Graph 5.18 is the representation of of of PDR for 75 nodes. Pause time is constant i.e. 400s and speed varies from 1m/s to 5 m/s. In analysis it has been observed that performance of proposed RAODV suffers a bit in case of high mobility. At faster movements RAODV starts low at around 51% at high speeds and reaches more then 66% at low speed. MAODV performance also decreases as speed increases. At the speed of 1m/s PDR of MAODV is 52% but as speed reaches to 5m/s its PDR drops to 45%. PDR of AODV is better then PDR of RAODV and PDR of MAODV but the analysis shows that as speed increases performance of all the protocols goes down. Same observation for “number of nodes” with the increase of number of nodes performance of all the protocols goes down.
Ist Author et al., International Journal of Advanced Research in Computer Science and Software Engineering7(7) ISSN(E): 2277-128X, ISSN(P): 2277-6451, DOI: 10.23956/ijarcsse/SV7I5/0249, pp. 111-116 (II) End to end delay:
The behavior of different protocols with 10 nodes having TCP connections has been shown in Graph 5 and Graph 6. Area selected is 650 meter x 650 meter. Total 5 connections has been established among different moving nodes. In Graph 5 AODV starts with a high Delay and it increases as pause time increases. In this Graph MAODV Delay is less in comparison to other protocols. The reason beind this is that more packets are dropped in MAODV and they have not been counted in calculations. RAODV performance is better in comparison to AODV performance in this Graph. RAODV performance is close to MAODV performance. The reason is that number of nodes are only 10, so number of malicious nodes are also less, RAODV dectes and removes all malicious nodes earlier. This is the reason that RAODV performance is close to MAODV performance. Graph 6 shows Delay for 25 nodes varying in pause time and varying in speed respectively by using TCP connections. Area selected is 850 meter x 850 meter. Total 9 connections has been established among different movindg nodes.In Graph 7 AODV and RAODV Delay is very close. At the pause time of 200s AODV Delay and RAODV Delay is approximately same. This Graph shows as pause time between 100 to 300s AODV and RAODV Delay decreases. After 300s AODV Delay starts increaseing. RAODV Delay increases after 300s but after 400s RAODV Delay starts decreasing. MAODV Delay is very low in this Graph and as pause time increases its Delay decreases. The reason is not because of better performance but it is due to the fact that more packets are dropped and they have not been counted in calculations. Graph 7 and Graph 8 shows End to End Delay for 75 nodes with respect to speed respectively. It has been found that MAODV has minimum Delay in both the Graphs. MAODV performance is very good at lower speed. AODV also performs well in both the Graphs. AODV has high Delay at higher speed. RAODV has higher Delay as compared to other counterparts. RAODV spends more time in selection of routes and this leads in higher Delay than others. This is due to calculation required for stable route based on security. RAODV has high Delay and MAODV has low Delay it doesn’t mean that MAODV is better than RAODV. Proposed RAODV Delay is highest but it provide a stable and secure route, though MAODV Delay is lowest but MAODV is not secure.
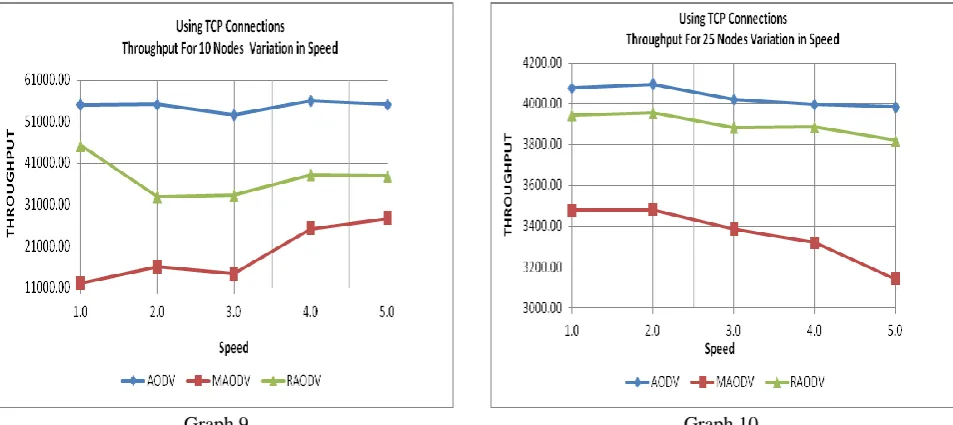
III) Throughput:
Figure 9 shows the Throughput performance for 10 nodes based on MANET’s regular operation under collaborative malicious node attack and after detection and removal of malicious nodes. In Graph 9 AODV gives a high Throughput but as malicious nodes enters it starts drop the packets and MAODV Throughput goes down. As RAODV removes the malicious nodes its PDR improves. Same trend has been observed in case of 25 nodes.
In Graph 10 AODV starts with a high Throughput in comparison to other protocol Throughput. Malicious nodes drop some packets and due to malicious nodes MAODV starts with a low Throughput and it decreases as pause time increases. RAODV provides a stable and secure path and improves the Throughput.
Throughput calculated for 50 nodes with 18 TCP connections have been shown in Graph 11 and Throughput calculated for 75 nodes with 23 TCP connections have been shown in Graph 12. It can be seen from all the Graphs that malicious nodes highly affect the performance of AODV and this causes fall of packets. AODV gives a high Throughput but as malicious nodes enters it starts dropping the packets and MAODV Throughput goes down. Then RAODV comes it detects and removes these malicious nodes as it removes MAODV deficiency and demerit in terms of removal of malicious nodes and thus supports the proposed plan. It can be seen that proposed RAODV Throughput improves a lot as compared to MAODV Throughput after the removal of malicious nodes.
In general TCP results are poor as compared to UDP results because TCP source retransmits data. With increased mobility source may distribute several identical packets to different intermediate nodes, because of route changes. Retransmission thus makes a virtual multipath transmission. One of the packets reaches the destination, and the one which reaches the destination first is accepted. Thus, somehow, the mobility by cooperating with TCP, unwitting causes more reliable transmission. This does not apply to non TCP tests, because they have no chance of retransmitting data packets.
ISSN(E): 2277-128X, ISSN(P): 2277-6451, DOI: 10.23956/ijarcsse/SV7I5/0249, pp. 111-116
Graph 11 Graph 12
V. CONCLUSION & FUTURE SCOPE
This paper presents a detailed comparative analysis of three MANET protocols i.e. AODV (Ad-hoc On-Demand Distance Vector), MAODV (Malicious Ad-hoc On-Demand Distance Vector), and proposed new scheme RAODV (Reverse Adhoc On-Demand Distance Vector) under TCP (Transmission Control Protocol). All the performances have been compared with the help of Packet Delivery Ratio, End to End Delay and Throughput. The discussion has been made to identify the merits and demerits of the proposed protocol. From the observations and results obtained from various simulations it can be concluded that modified scheme introduced here is effective for all cases. It identifies the attacker and keeps them away from the route for further communication. The proposed protocol was designed to provide better security with good PDR and high Throughput. Various Graphs show that proposed RAODV provides a stable and secure communication with a better performance. This study can be enhanced for150 to 200 nodes. This will provide real life situations and provide a robust and effective solution for security.
ACKNOWLEDGMENT
I would like to express my gratitude towards my husband and my son for the encouragement which help me in completion of this paper. I would like to express my special gratitude and thanks to my guide Dr. Ashwani Kush for imparting his knowledge and expertise in this study.
REFERENCES
[1] "Wireless Network Industry Report". http://www.wireless-nets.com/ resources /downloads/wireless_industry_report _2007. html
[2] Kush, A., Taneja, S.: A Survey of Routing Protocols in Mobile Adhoc Networks International Journal of Innovation, Management and Technology 1(3), 279–285 (2010)
[3] Perkins, C., Royer, E.B., Das, S.: Adhoc On-Demand Distance Vector (AODV). Routing IETF Internet Draft (2003)
Ist Author et al., International Journal of Advanced Research in Computer Science and Software Engineering7(7) ISSN(E): 2277-128X, ISSN(P): 2277-6451, DOI: 10.23956/ijarcsse/SV7I5/0249, pp. 111-116 [13] Vincent D. Park and M.Scott Corson. A highly adaptive distributed routing algorithm for mobile wireless
networks. In Proceedings of INFOCOM 1997, 1997
[14] Seyed Mehdi Moosavi, MarjanKuchaki Rafsanjani, “An Algorithm for Cluster Maintenance Based on Membership Degree of Nodes for MANETs”, “International Journal of Advancements in Computing Technology (IJACT)”,AICIT, vol.3, no.4, pp.73-78, 2011.
[15] He XU, Suo-ping WANG, Ru-chuan WANG, “A Novel RFID Reader System Framework basedon Peer-to-Peer Network”, “International Journal of Advancements in Computing Technology (IJACT)”,AICIT, vol.3, no.3, pp.104-110, 2011.
[16] C. E. Perkins and E. M. Royer, “Ad hoc On-Demand Distance Vector Routing”, In Proceedings of IEEE WMCSA, pp. 90-100, 1999.