STRUCTURAL AND THERMAL INVESTIGATIONS OF NOVEL
CHARGE-TRANSFER COMPLEXES OF THYMOL AND THE
ACCEPTORS PICRIC ACID, CHLORANILIC ACID,
1,3-DINITROBENZENE AND p-CHLORANIL
Abdel Majid A. Adam
[a], Moamen S. Refat
[a,b]*, Hosam A. Saad
[a,c]and Hala H. Eldaroti
[d]Keywords: Thymol, Charge-transfer, Benesi–Hildebrand method, Thermal analysis
Thymol (Thy) is a widely known anti-microbial agent and can be found as one of the components of many essential oils. Intermolecular charge-transfer complexes between the Thy as a donor and picric acid (PA), chloranilic acid (CLA), 1,3-dinitrobenzene (DNB) or p -chloranil (p-CHL) as a -acceptor have been structurally and thermally studied in methanol at room temperature. Based on elemental analyses (CHN) and photometric titrations, the stoichiometry of the complexes (Thy: acceptor molar ratios) was determined to be 1:1 for all four complexes. The formation constant (KCT), molar extinction coefficient (CT) and other spectroscopic data have been determined using the Benesi–Hildebrand method and its modifications. The newly synthesized CT complexes have been characterized via elemental analyses (CHN), IR, 1H-NMR, and electronic absorption spectroscopy. Thermogravimetric analyses (TG) were also used to investigate the thermal stability of the synthesized solid CT complexes.
* Corresponding Authors
E-Mail: [email protected]
[a] Department of Chemistry, Faculty of Science, Taif University, Al-Hawiah, Taif, P.O. Box 888 Zip Code 21974, Saudi Arabia
[b] Department of Chemistry, Faculty of Science, Port Said University, Port Said, Egypt
[c] Department of Chemistry, Faculty of Science, Zagazig University, Zagazig, Egypt
[d] Department of Chemistry, Faculty of Education, Alzaeim Alazhari University, Khartoum, Sudan
Introduction
The term charge-transfer complex (CTC) was first introduced by Mulliken1,2 and has been widely discussed
by Foster3. Mulliken4,5 demonstrated that the
charge-transfer interactions within a molecular complex that consists of an electron donor, D, and an electron acceptor, A, involve a resonance with a transfer of charge from D to A:
D + A D+A- D+ + A- (1)
Charge-transfer complexation is of great importance in chemical reactions, including addition, substitution, condensation6,7, biochemical and bioelectrochemical
energy-transfer processes8, biological systems9, and drug–
receptor binding mechanisms. For example, drug action, enzyme catalysis, ion transfers through lipophilic membranes10, and certain -acceptors have successfully
been used in the pharmaceutical analysis of some drugs in pure form or in pharmaceutical preparations11-17.
Furthermore, charge-transfer complexation is also of great importance in many applications and fields, such as in non-linear optical materials, electrically conductive materials18-21, second-order non-linear optical activity22,
microemulsions23, surface chemistry23, photocatalysts24,
dendrimers25, solar energy storage26, organic
semiconductors27, and the investigation of redox
processes28. Charge-transfer complexes that use organic
species are intensively studied because of their special type of interaction, which is accompanied by the transfer of an electron from the donor to the acceptor29,30. In
addition, the protonation of the donor from acidic acceptors is a route for the formation of ion-pair adducts31-33.
Considerable attention has recently been devoted to the formation of stable charge-transfer complexes that result from the reaction between acceptors and drugs or biological compounds. This interest stems from the significant physical and chemical properties of these complexes. For example, the complexation of charge-transfer complexes with drugs has been recognized as an important phenomenon in the drug-receptor binding mechanism and in many other biological processes. Herein, the CT interaction between the anti-microbial agent thymol and four acceptors are investigated. Thymol (Thy, C10H14O), a phenol derivative, is the main
constituent in natural essential oils from many herbs, such as Thyme, Oregano and winter savory34-36. Thymol has an
antimicrobial effect on bacteria, fungi, and yeasts. It is able to inhibit both Gram-positive and Gram-negative bacteria, including the potential pathogenic strains of Bacillus subtilis, Escherichia coli, Klebsiella pneumonia and Staphylococcus aureusalso . Amongst the identified natural anti-microbial agents (thymol, carvacrol, citronella, eugenol and terpinen-4-ol), thymol showed the highest antibacterial activity against Staphylococcus aureus, Escherichia coli and Pseudomonas aeruginosa37.
Due to its bactericidal action against oral bacteria, it is commonly incorporated in mouthwashers. Thymol and essential oils rich in thymol, have proved beneficial in medical38,39, food40, agricultural41, veterinarian and pest
control applications42.
1H-NMR and electronic absorption spectroscopy were
used to interpret the behavior of the interactions. The spectroscopic physical data were analyzed in terms of the formation constant (KCT), the molar extinction coefficient
(CT), the standard free energy (G), the oscillator
strength (f), the transition dipole moment (), the resonance energy (RN) and the ionization potential (ID).
The thermal behaviors of the obtained complexes have also been investigated.
Experimental
Chemicals
All chemical used were of high grade of purity. Thymol (Thy) (MF=C10H14O) was obtained from Sigma-Aldrich
Chemical Company, USA with a stated purity of more than 99.6% and was used without further purification. Picric acid (2,4,6-trinitrophenol, PA), 1,3-dinitrobenzene (DNB), chloranilic acid (CLA) and p-chloranil (p-CHL) were purchased from Merck Chemical Company and were also used as received.
Synthesis
The solid CT products of Thy with PA, CLA, DNB and p-CHL were synthesized by mixing equimolar amounts of Thy donor with each acceptor in methanol. The mixtures were stirred for 20 min, and allowed to evaporate slowly at room temperature, which resulted in the precipitation of the solid CT complexes. The separated complexes were filtered off, washed well with little amounts of methanol, and then collected and dried under vacuum over anhydrous calcium chloride for 24 h.
Photometric titration
Photometric titration measurements were carried out for the reactions of Thy with PA, CLA, DNB and p-CHL against methanol as a blank at wavelengths of 354, 285, 300 and 284 nm, respectively. A 0.25, 0.50, 0.75, 1.00, 1.50, 2.0, 2.50, 3.00, 3.50 or 4.00 mL aliquot of a standard solution (5.010-4 M) of the appropriate acceptor
in MeOH was added to 1.00 ml of 5.010-4 M Thy, which
was also dissolved in MeOH. The total volume of the mixture was 5 mL. The concentration of EC (Cd) in the
reaction mixture was maintained at 5.010-4 M, whereas
the concentration of the acceptors (Ca) changed over a
wide range of concentrations (0.2510-4 M to 4.0010-4
M) to produce solutions with an acceptor molar ratio that varied from 4:1 to 1:4. The stoichiometry of the molecular CT complexes was obtained from the determination of the conventional spectrophotometric molar ratio according to known methods43 using a plot of
the absorbance of each CT complex as a function of the Cd:Ca ratio. Modified Benesi–Hildebrand plots44,45 were
constructed to allow the calculation of the formation constant, KCT, and the absorptivity, CT, values for each
CT complex in this study.
Instrumentation
The elemental analyses of the carbon, hydrogen and nitrogen contents were performed by the microanalysis facility at Cairo University, Egypt, using a Perkin-Elmer CHN 2400 (USA). The electronic absorption spectra of methanolic solutions of the donor, acceptors and resulting CT complexes were recorded over a wavelength range of 200-800 nm using a Perkin-Elmer Lambda 25 UV/Vis double-beam spectrophotometer at Taif University, Saudi Arabia. The instrument was equipped with a quartz cell with a 1.0 cm path length. The mid-infrared (IR) spectra (KBr discs) within the range of 4000-400 cm-1 for the
solid CT complexes were recorded on a Shimadzu FT-IR spectrophotometer with 30 scans at 2 cm-1 resolution. The
Raman laser spectra of the samples were measured on a Bruker FT-Raman spectrophotometer equipped with a 50 mW laser at Taif University, Saudi Arabia. 1H-NMR
spectra were collected by the Analytical Center at King Abdul Aziz University, Saudi Arabia, on a Bruker DRX-250 spectrometer operating at DRX-250.13 MHz with a dual 5 mm probe head. The measurements were performed at ambient temperature using DMSO-d6 (dimethylsulfoxide,
d6) as a solvent and TMS (tetramethylsilane) as an
internal reference. The 1H-NMR data are expressed in
parts per million (ppm) and are internally referenced to the residual proton impurity in the DMSO as solvent. Thermogravimetric analysis (TGA) was performed under an air atmosphere between room temperature and 800 C at a heating rate of 10 C/min using a Shimadzu TGA– 50H thermal analyzer at the Central Lab at Ain Shams University, Egypt.
Results and discussion
Elemental analyses results
Elemental analyses (C, H, and N) of the Thy CT complexes were performed, and the obtained analytical data are as follows:
1 [(Thy)(PA)]: C16H17N3O8; Mol. wt.=379.32;
Orange; Anal. Calcd.: C, 50.62; H, 4.48; N, 11.07. Found: C, 51.01; H, 4.37; N, 10.73.
2 [(Thy)(CLA)]; C16H16Cl2O5; Mol. wt.=359.20; Dark
red; Anal. Calcd.: C, 53.45; H, 4.45. Found: C, 53.61; H, 4.54.
3 [(Thy)(DNB)]; C16H18N2O5; Mol. wt.=318.32; Pale
brown; Anal. Calcd.: C, 60.32; H, 5.65; N, 8.80. Found: C, 60.50; H, 5.37; N, 8.67
4 [(Thy)(p-CHL)]; C16H14Cl4O3; Mol. wt.=396.10;
Orange yellow; Anal. Calcd.: %C, 48.47; %H, 3.53. Found: %C, 48.40; %H, 3.59.
The stoichiometry of all complexes was found to be 1:1 ratios. Based on the obtained data, the formed charge-transfer complexes were formulated as [(Thy)(PA)], [(Thy)(CLA)], [(Thy)(DNB)] and [(Thy)(p-CHL)].
Electronic absorption spectra
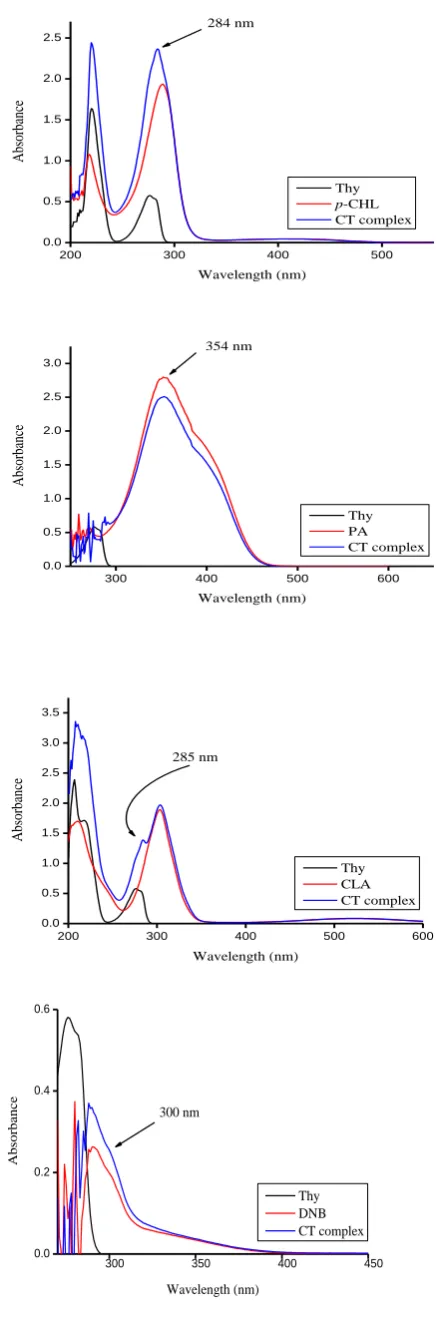
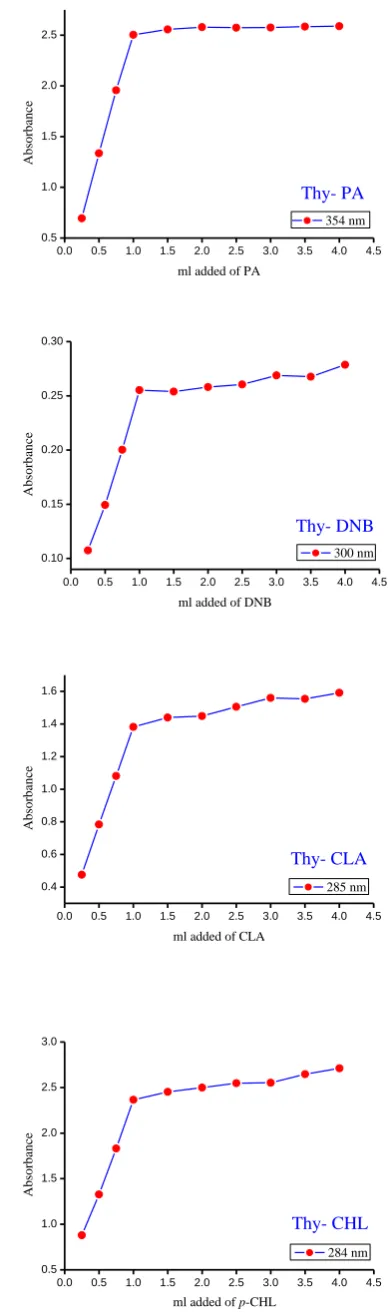
Figure 1 shows the electronic absorption spectra of the Thy donor, acceptors and the formed CT complexes. These spectra revealed new absorption bands that are attributed to the CT interactions. These bands are observed at 354, 285, 300 and 284 nm for the Thy/PA, Thy/CLA, Thy/DNB and Thy/p-CHL complexes, respectively. These peak absorbance values that appeared in the spectra assigned to the formed CT complexes were measured and plotted as function of the Cd: Ca ratio
according to the known method. Photometric titration plots based on these measurements (Figure 2) confirmed the complex formation at a ratio (Thy: acceptor) of 1:1 in all cases. The formation constant (KCT) and the molar
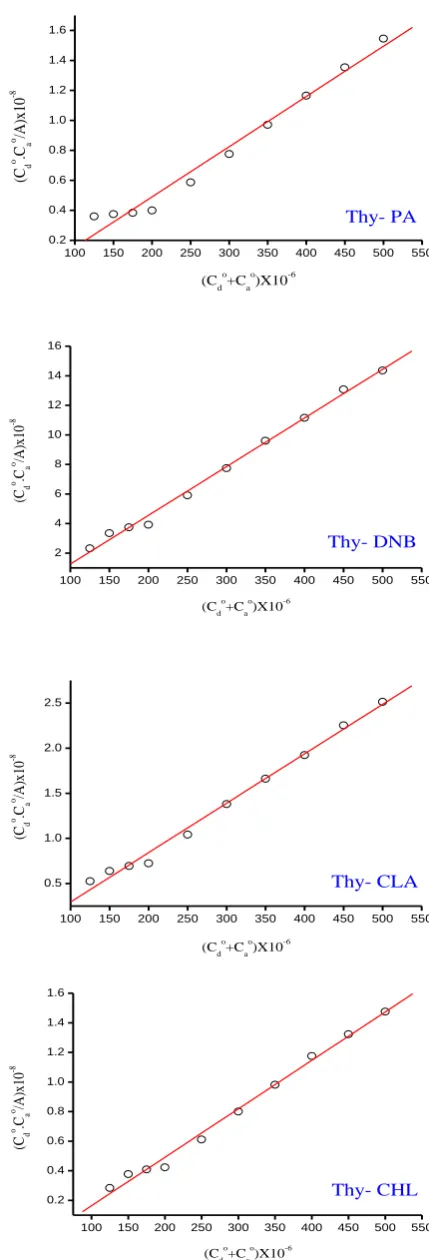
absorptivity () of these complexes were calculated by applying the 1:1 modified Benesi–Hildebrand equation in Eqn. (2)44:
( )
1
a d a d
C C C C
A K
(2)
where Ca and Cd are the initial concentrations of the
electron acceptor and the electron donor, respectively, and A is the absorbance of the strongly detected CT band. Plotting (CaCd)/A values versus the corresponding
(Ca+Cd) values for the formed EC charge-transfer
complexes, straight line are obtained supporting our finding of the formation of 1:1 complexes. In the plots, the slope and intercept equal 1/ and 1/K, respectively. The modified Benesi–Hildebrand plots are shown in Figure 3 and the values of both KCT and associated with
the complexes are given in Table 1. These complexes exhibit high values of both the formation constant (KCT)
and the extinction coefficients (). These high values of KCT reflect the high stabilities of the formed CT
complexes. The equilibrium constants are strongly dependent on the nature of the used acceptor including the type of electron withdrawing substituents to it such as nitro and halo groups46. The data reveal that the
[(Thy)(CLA)] complex shows a higher KCT value
compared with the other complexes, reflecting the relatively higher powerful electron acceptance ability for CLA.
Calculation of the spectroscopic and physical data
The spectroscopic and physical data, such as the standard free energy (G°), the oscillator strength (f), the transition dipole moment (), the resonance energy (RN),
and the ionization potential (IP), were estimated for
samples dissolved in methanol at 25 C. The oscillator strength (f) is a dimensionless quantity used to express the transition probability of the CT-band From the CT absorption spectra47, and can be estimated using the
approximate formula48: Figure 1.Electronic absorption spectra of Thy CT complexes at the detectable peak. 300 400 500 600 0.0
0.5 1.0 1.5 2.0 2.5 3.0
Absor
ba
nc
e
Wavelength (nm)
Thy PA CT complex 354 nm
200 300 400 500 600 0.0
0.5 1.0 1.5 2.0 2.5 3.0 3.5
Absor
ba
nc
e
Wavelength (nm)
Thy CLA CT complex 285 nm
200 300 400 500
0.0 0.5 1.0 1.5 2.0 2.5
Absor
ba
nc
e
Wavelength (nm) Thy
p-CHL CT complex 284 nm
300 350 400 450
0.0 0.2 0.4 0.6
Absor
ba
nc
e
whereCTd is the area under the curve of the extinction
coefficient of the absorption band in question plotted as a function of frequency. To a first approximation,
where CT is the maximum extinction coefficient of the
CT band, and ½ is the half-bandwidth in cm-1 (i.e., the
width of the band at half the maximum extinction). The transition dipole moments () of the Thy CT complexes have been calculated from Eq. 549:
The transition dipole moment can be used to determine if a particular transition is allowed; the transition from a bonding orbital to an antibonding * orbital is allowed
because the integral that defines the transition dipole moment is nonzero. The ionization potentials (IP) of the
Thy donor in the charge-transfer complexes were calculated using the empirical equation derived by Aloisi and Pignataro represented in Eq. 650:
where CT is the wavenumber in cm-1 that corresponds to
the CT band formed from the interaction between the donor and the acceptor. The electron-donating power of a donor molecule is measured by its ionization potential, which is the energy required to remove an electron from the highest occupied molecular orbital. Briegleb and Czekalla51 theoretically derived the following relationship
to obtain the resonance energy (RN):
where CT is the molar absorptivity coefficient of the CT
complex at the maximum of the CT absorption, CT is the
frequency of the CT peak, and RN is the resonance energy
of the complex in the ground state, which contributes to the stability constant of the complex (a ground-state property). The energy values (ECT) of the n* and –*
interactions between the donor (EC) and the acceptors were calculated using the equation derived by Briegleb52:
where CT is the wavelength of the CT band of the formed
complex. The standard free energy of complexation (G°) for each complex was calculated from the formation constants using the equation derived by Martin et al.53:
Figure 2. Photometric titration curves forThy CT complexes at detectable peaks.
9
4.319 10 CT (3)
f
d9 1/ 2
4.319 10 CT (4)
f
1/ 2 1/ 2
max
0.0958 CT (5)
4
( ) 5.76 1.53 10 (6)
P CT
I eV
4
7.7 10
(7) 3.5
CT
CT
N
h R
1243.667
(8)
CT CT
CT
E h
0.0 0.5 1.0 1.5 2.0 2.5 3.0 3.5 4.0 4.5 0.5
1.0 1.5 2.0 2.5
Thy- PA
Absor
ba
nc
e
ml added of PA
354 nm
0.0 0.5 1.0 1.5 2.0 2.5 3.0 3.5 4.0 4.5 0.10
0.15 0.20 0.25 0.30
Thy- DNB
Absor
ba
nc
e
ml added of DNB
300 nm
0.0 0.5 1.0 1.5 2.0 2.5 3.0 3.5 4.0 4.5 0.4
0.6 0.8 1.0 1.2 1.4 1.6
Thy- CLA
Absor
ba
nc
e
ml added of CLA
285 nm
0.0 0.5 1.0 1.5 2.0 2.5 3.0 3.5 4.0 4.5 0.5
1.0 1.5 2.0 2.5 3.0
Thy- CHL
Absor
ba
nc
e
ml added of p-CHL
where G° is the free energy change of the CT complex (kJmol-1), R is the gas constant (8.314 Jmol-1K), T is the
absolute temperature in K, and KCT is the formation
constant of the complex (Lmol-1) at room temperature.
The calculated spectroscopic and physical values (f, , IP, RN and G) for the Thy CT complexes using these
equations are presented in Table 1. [(Thy)(CLA)] complex exhibits considerably higher values of both the oscillator strength (f) and the transition dipole moment (). CLA is a strong electron acceptor to form stable CT complexes with the donors. Beside this function, CLA is a strong acid (pK1=1.07 and pK2= 2.24)54, hence a proton
transfer from CLA to the donors is expected. The observed high values of f indicate a strong interaction between the donor–acceptor pairs with relatively high probabilities of CT transitions55. Further evidence for the
nature of CT interactions is the calculation of the standard free energy change (G). The obtained values of G for the Thy/PA, Thy/CLA, Thy/DNB and Thy/p-CHL complexes are -35.8, -36.1, -35.4 and -36 kJmol-1,
respectively; these negative values indicate that the interaction between Thy and the acceptors is exothermic and spontaneous56, 57.
IR spectra
The IR absorption spectra of the Thy solid CT complexes were recorded in the frequency range 4000-400 cm-1 using KBr disc. These spectra are shown in
Figure 4 while their band assignments are given in Table 2. In the IR spectra of the [(Thy)(PA)] and [(Thy)(CLA)] complexes, the characteristic bands of Thy observed at 3613 cm-1, which is assigned to (O-H) stretching
vibration, shifted to lower value and reduced in intensity after complexation. Also, the IR spectra of these complexes are characterized by weak bands that appear between 2400-2800 cm-1, which does not appear in the
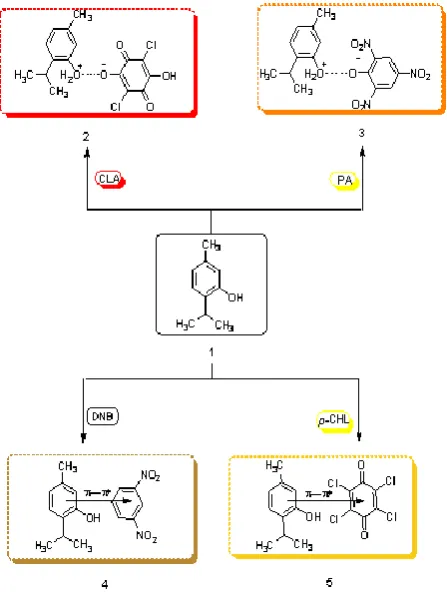
spectra of the free Thy donor or those of the PA and CLA acceptors. These peaks are due to hydrogen bonding in the complex formed through the transfer of a proton from PA or CLA to the -OH group of the Thy donor. These observations clearly indicate that the complexation occurs through the protonation of the –OH group in the Thy donor via a proton-transfer phenomenon from the acidic center of each acceptor to the lone pair of electrons on the Thy oxygen atom based on acid–base theory59-63. Thus,
one can say that the charge-transfer molecular complexes between Thy and PA or CLA acceptors are stabilized by hydrogen bonding. Because DNB and p-CHL acceptors lack acidic centres, the molecular complexes can be concluded to form through * charge migration from the HOMO of the donor to the LUMO of the acceptor. The * CT complex is formed via the benzene ring (electron-rich group) of the Thy and the DNB and p-CHL reagents (electron acceptor). The group of bands are exhibited at 2920 and 2843 cm-1 in [(Thy)(DNB)]
complex, and at 2890 and 2836 cm-1 in [(Thy)(p-CHL)]
complex were assigned to symmetric stretching vibrations of the (C-H) with different position wavenumbers
compared with the free Thy. Figure 3. complexes at detectable peaks. The modified Benesi-Hildebrand plots of Thy CT
2.303 lg CT (9)
G RT K
100 150 200 250 300 350 400 450 500 550 0.2
0.4 0.6 0.8 1.0 1.2 1.4 1.6
Thy- PA
(C
d
o .C
a
o /A)x10
-8
(C
d o
+C
a o
)X10-6
100 150 200 250 300 350 400 450 500 550 2
4 6 8 10 12 14 16
Thy- DNB
(
Cd
o .C
a
o /A)
x10
-8
(Cdo+Cao)X10-6
100 150 200 250 300 350 400 450 500 550 0.5
1.0 1.5 2.0 2.5
Thy- CLA
(
Cd
o .C
a
o /A)
x10
-8
(Cd o
+Ca o
)X10-6
100 150 200 250 300 350 400 450 500 550 0.2
0.4 0.6 0.8 1.0 1.2 1.4 1.6
Thy- CHL
(Cdo+Cao)X10-6
(
Cd
o .C
a
o /A)
x10
Table 1. Spectrophotometric results of the Thy CT complexes
Complex CT-absorption,
nm ECT, eV K (Lmol
-1) max
(L mol-1 cm-1) f μ Ip RN
∆G° (25 °C) (kJ mol-1)
[(Thy)(PA)] 354 3.513 1.86104 2.99104 12.89 31.14 10.08 0.99 -35,771
[(Thy)(CLA)] 285 4.364 2.16104 1.83104 39.40 48.85 11.13 1.23 -36,146
[(Thy)(DNB)] 300 4.146 1.62104 3.04104 27.39 23.60 10.86 1.10 -35,426
[(Thy)(p-CHL)] 284 4.379 2.00104 3.06104 37.73 47.72 11.15 1.24 -35,949
Figure 4. Infrared spectra of Thy CT complexes.
The stretching vibration of (C=O) absorption band in free p-CHL appeared at 1685 cm-1, but under
complexation this band is still un-shifted. Also, the bands associated with (C-Cl) vibration that appeared at 903, 750 and 709 cm-1 in free p-CHL were shifted to lower
wavenumbers and decreasing in the intensities of the characteristic peaks, these results due to the increasing in the electron density around p-CHL moiety. These observations proved that the complexation of Thy with DNB and p-CHL take place via the * transition. Based on these data, the suggested complexation mechanism between Thy donor and acceptors is illustrated in Scheme 1.
1H-NMR spectra
The 400 MHz nuclear magnetic resonance (1H-NMR)
spectra of the Thy complexes were measured in DMSO-d6 at room temperature. The chemical shifts () of the
different types of protons of the complexes are;
[(Thy)(PA)] complex;
(2-isopropyl-5-methylphenyl)oxonium 2,4,6-trinitrobenzenolate; 1H
NMR (400 MHz, DMSO-d6): 1.59 (d, 6H, 2CH3), 2.59 (s,
3H, CH3), 3.21 (m, 1H,CH(CH3)2), 7.26 (d, 1H, Ar-H, C4
thymol), 7.39 (d, 1H, Ar-H, C3 thymol), 7.63 (s, 1H,
Ar-H, C6 thymol), 9.00 (s, 2H, Ar-H, picric acid ring), 12.2
(s, 2H, Ar-OH2+, thymol).
[(Thy)(CLA)] complex;
(2-isopropyl-5-methylphenyl)oxonium 2,5-dichloro-4-hydroxy-3,6-dioxocyclohexa-1,4-dien-1-olate; 1H-NMR (400 MHz,
DMSO-d6): 1.60 (d, 6H, 2CH3), 2.59 (s, 3H, CH3), 3.21
(m, 1H,CH(CH3)2), 7.25 (d, 1H, Ar-H, C4 thymol), 7.40
(d, 1H, Ar-H, C3 thymol), 7.63 (s, 1H, Ar-H, C6 thymol),
11.9 (s, 1H, Ar-OH, CLA ring), 12.2 (s, 2H, Ar-OH2+,
thymol).
[(Thy)(DNB)] complex; 2-isopropyl-5-methylphenol compound with 1,3-dinitrobenzene (1:1); 1H-NMR (400
MHz, DMSO-d6): 1.18 (d, 6H, 2CH3), 2.40 (s, 3H, CH3),
3.19 (m, 1H,CH(CH3)2), 4.27 (s, 1H, OH), 6.89 (d, 1H,
Ar-H, C4 thymol), 7.22 (s, 1H, Ar-H, C6 thymol), 7.37 (d,
1H, Ar-H, C3 thymol), 8.07 (d, 2H, Ar-H, C4, C6
dinitrobenzene ring), 8.19 (t, 1H, Ar-H, C5 dinitrobenzene
ring), 8.47 (s, 1H, Ar-H, C2 dinitrobenzene ring)
Scheme 1. Complexation mechanism between Thy donor and acceptors.
3500 3000 2500 2000 1500 1000 500
Thy/p-CHL
Thy/CLA Thy/PA
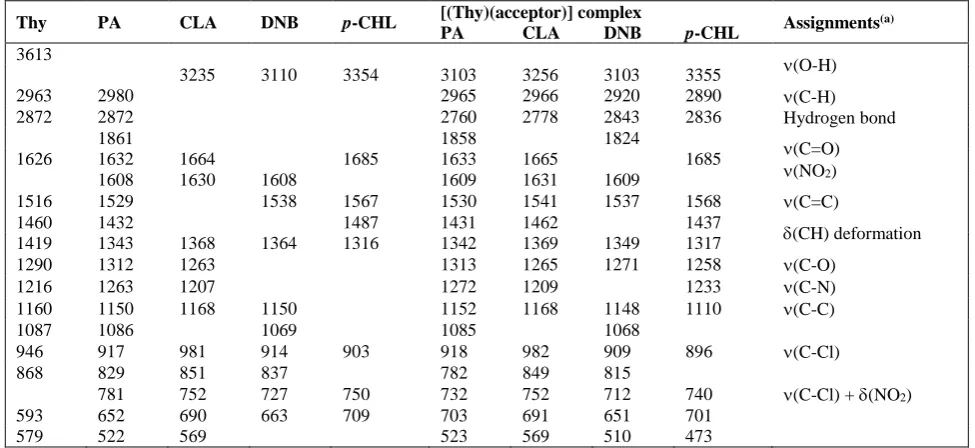
Table 2. Characteristic infrared frequencies (cm-1) and tentative assignments of Thy, PA, CLA, DNB, p-CHL and their CT complexes.
Thy PA CLA DNB p-CHL [(Thy)(acceptor)] complex Assignments(a)
PA CLA DNB p-CHL
3613
(O-H)
3235 3110 3354 3103 3256 3103 3355
2963 2980 2965 2966 2920 2890 (C-H)
Hydrogen bond
2872 2872 2760 2778 2843 2836
1861 1858 1824
(C=O)
(NO2)
1626 1632 1664 1685 1633 1665 1685
1608 1630 1608 1609 1631 1609
1516 1529 1538 1567 1530 1541 1537 1568 (C=C)
1460 1432 1487 1431 1462 1437
(CH) deformation
1419 1343 1368 1364 1316 1342 1369 1349 1317
1290 1312 1263 1313 1265 1271 1258 (C-O)
1216 1263 1207 1272 1209 1233 (C-N)
1160 1150 1168 1150 1152 1168 1148 1110 (C-C)
1087 1086 1069 1085 1068
946 917 981 914 903 918 982 909 896 (C-Cl)
868 829 851 837 782 849 815
781 752 727 750 732 752 712 740 (C-Cl) + (NO2)
593 652 690 663 709 703 691 651 701
579 522 569 523 569 510 473
a, stretching;
s , symmetrical stretching; as , asymmetrical stretching; , bending.
[(Thy)(p-CHL)] complex;
2,3,5,6-tetrachlorocyclohexa-2,5-diene-1,4-dione compound with 2-isopropyl-5-methylphenol (1:1); 1H-NMR (400 MHz,
DMSO-d6): 1.62 (d, 6H, 2CH3), 2.59 (s, 3H, CH3), 3.30
(m, 1H,CH(CH3)2), 4.67 (s, H, Ar-OH, thymol), 7.12 (d,
1H, Ar-H, C4 thymol), 7.40 (s, 1H, Ar-H, C6 thymol),
7.77 (d, 1H, Ar-H, C3 thymol).
The three aromatic protons of Thy appear at 7.37-7.77 (C3), 6.89-7.26 (C4) and 7.22-7.63 (C6) ppm. The
aliphatic protons of Thy appear at 1.18-1.62 ppm (6H), 2.40-2.59 ppm (3H) and 3.19-3.30 (1H), corresponds to the protons of 2CH3, CH3 and CH groups, respectively.
The intensities and chemical shifts of the aromatic and aliphatic signals have been significantly affected by the complxation and the accompanying changes in the structural configuration. The new peak observed at 12.2 ppm in [(Thy)(PA)] complex, which is not detected in the spectrum of the free Thy donor, is attributed to the formation of a hydrogen bond between PA and Thy. The peak at = 11.94 ppm, which is assigned to the –OH proton of free picric acid64, was absent in the spectrum of
this complex. Together, these data indicate that the hydroxyl and phenolic groups are involved in the formation of the CT complex between Thy and PA.
In the [(Thy)CLA)] complex, the phenolic proton (– OH) signal, which is observed at approximately 9.15 ppm in the spectrum of the free CLA acceptor57,
decreased in intensity with an down-field shift for the non-hydrogen-bonded one (11.9) in the spectrum of the CT complex. Instead, a new peak is observed at 12.2 ppm, attributing to two protons of OH2+. This situation
confirmed the transfer of the phenolic proton of CLA to the (-OH) group of Thy.
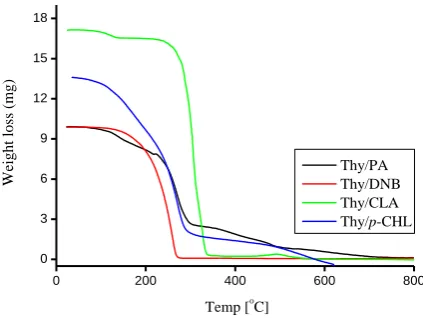
Thermal analysis
The thermogravimetric analysis (TG) provided information about the thermal stabilities of the prepared charge-transfer complexes and about the differences in the physical behavior of the starting and resulting compounds. In order to verify charge-transfer interaction between Thy donor and acceptors and thermal stability of the new CT complexes, the thermogravimetric analysis of Thy CT complexes were carried out over the temperature range of 25-800 C under an air atmosphere using 9.9, 9.87, 17.12 and 13.60 mg samples for [(Thy)(PA)], [(Thy)(CLA)], [(Thy)(DNB)] and [(Thy)(p-CHL)] complexes, respectively. The TG curves were redrawn as mg mass loss versus temperature. Figure 5 shows the thermograms for Thy CT complexes and thermal analyses data are listed in Table 3. The obtained data indicate that the [(Thy)(PA)] complex decomposes in three clear decomposition steps within the 25-800 C temperature range. The first decomposition step within the temperature range 25-152 C has a weight loss about 12.20% and is attributed to the liberation of NO2
molecule. The second decomposition step existed within the 152-300 C temperature range and is reasonably explained by the loss of 5C2H2, 2NO2 and CO2 molecules.
The final decomposition step found within the temperature range 300-800 C which corresponds to the liberation of 2C2H2, CO2 and 3/2H2 molecules. This step
Table 3. Thermal decomposition data for the Thy CT complexes.
Complex Stage TG range, °C Mass loss, % Detected fragments
Found Calculated
[Thy)(PA)] (C16H17N3O8)
I 25-152 12.20 12.13 NO2
II 152-300 62.03 61.69 5C2H2+ 2NO2 + CO2
III 300-800 25.77 26.10 2C2H2 + CO2 + 3/2H2
[Thy)(CLA)] (C16H16Cl2O5)
I 25-220 3.97 3.34 CO2
II 220-675 96.03 96.60 6C2H2+ Cl2 + 3CO2 + 2H2
[Thy)(DNB)] (C16H18N2O5)
I 25-800 100.00 99.90 7C2H2+ 2NO2 + 2CO2 + 2H2
[Thy)(p-CHL)] (C16H14Cl4O3)
I 25-345 86.16 86.34 6C2H2 + 2Cl2 + CO2
II 345-600 13.84 13.63 C2H2 + CO2
The first mass loss step occurs between 25-220 C corresponds to the loss of CO2 molecule with a weight
loss of 3.97% close to the expected theoretical value of 3.34%. The second degradation step at 220-675 C has an extremely large scale of weight loss for about 96.03%, and is attributed to the loss of 6C2H2, Cl2, 3CO2 and 2H2
molecules. The curve of [(Thy)(DNB)] complex was thermally decomposed in one decomposition step within temperature range 25-800 C, and may be assigned to the liberation of 7C2H2, 2NO2, 2CO2 and 2H2.
Figure 5. TG curves of Thy CT complexes.
The thermal analysis curve of the [(Thy)(p-CHL)] complex indicates that the decomposition occurs in two main stages in the temperature range of 25-600°C. The first decomposition step within the temperature range 25-345 C corresponding to loss of 6C2H2, 2Cl2 and CO2
molecules representing a weight loss of 86.16% very close to the expected theoretical value of 86.34%. The second decomposition step found within the temperature range 345-600 C which corresponds to the liberation of C2H2 and CO2 molecules representing a weight loss of
13.84% very close to the expected theoretical value of 13.63%.
Conclusion
Recently, considerable attention has been devoted to the formation of stable charge-transfer complexes that result from the reaction between acceptors and drugs or biological compounds. This interest stems from the significant physical and chemical properties of these complexes. The results reported in this paper are concerned with the preparation, characterization, structural and thermal studies of novel charge-transfer complexes formed between the anti-microbial agent; thymol (Thy) and the acceptors picric acid (PA), chloranilic acid (CLA, 1,3-dinitrobenzene (DNB) and p -chloranil (p-CHL). It is observed that the reaction stoichiometry is 1:1, and the resulting CT complexes
were shown to have the general formula:
[(Thy)(acceptor)]. The interaction between the Thy and PA or CLA acceptors was stabilized by hydrogen bonding. The obtained complexes were thermally stable. Physical parameters such as formation constant (KCT),
molar extinction coefficient (CT) and other spectroscopic
data have also been determined.
References
1Mulliken, R. S. J. Am. Chem. Soc., 1950, 72, 4493.
2Mulliken, R. S., Pearson, W. B. Molecular Complexes, Wiley Publishers, New York, 1969.
3Foster, R. Charge Transfer Complexes, Academic press, London, 1969.
4Mulliken, R. S. J. Am. Chem. Soc., 1952, 74, 811. 5Mulliken, R. S. J. Phys. Chem., 1952, 56, 801.
6Roy, T., Dutta, K., Nayek, M. K., Mukherjee, A. K., Banerjee, M., Seal, B. K. J. Chem. Soc.,Perkin Trans., 1999, 2, 2219. 7Fla, F. P., Palou, J., Valero, R., Hall, C. D.; Speers, P., J. Chem.
Soc., Perkin Trans., 1991, 2, 1925.
8Roy, D. K., Saha, A., Mukherjee, A. K. Spectrochim. Acta A, 2005, 61, 2017.
0 200 400 600 800
0 3 6 9 12 15 18
W
eight
los
s (mg)
Temp [oC]
9Slifkin, A. M. Charge-transfer Interaction of Biomolecules, Academic Press, New York, 1971.
10Dozal, A., Keyzer, H., Kim, H.K., Wang, W. W. Int. J. Antimicrob. Agent, 2000, 14, 261.
11Korolkovas, A. Essentials of Medical Chemistry, 2nd ed., (Chapter 3). Wiley, New York, 1998
12Abou Attia, F. M. Farmaco, 2000, 55, 659. 13Basavaiah, K. Farmaco, 2004, 59, 315.
14Saleh, G. A., Askal, H. F., Radwan, M. F., Omar, M. A. Talanta, 2001, 54(6), 1205.
15Salem, H. J. Pharm. Biomed. Anal., 2002, 29(3), 527. 16Pandeeswaran, M., El-Mossalamy, E. H., Elango, E. H. Int. J.
Chem. Kinet., 2009, 41, 787.
17Pandeeswaran, M., Elango, K. P. Spectrochim. Acta A, 2010, 75, 1462.
18Yakuphanoglu, F., Arslan, M. Solid State Commun., 2004, 132, 229.
19Yakuphanoglu, F., Arslan, M. Opt. Mater., 2004, 27, 29. 20Yakuphanoglu, F., Arslan, M., Kucukislamoglu, M.; Zengin,
M. Sol. Energy, 2005, 79, 96.
21Chakraborty, B.; Mukherjee, A. S.; Seal, B. K. Spectrochim. Acta A, 2001, 57, 223.
22Krishnamurthy, M.; Surendrababu, K.; Muralikrishna, U. Indian J. Chem.A, 1988, 27, 669.
23Andrade, S. M., Costa, S. M. B.,Pansu, R. J. Colloid Interface Sci., 2000, 226, 260.
24Dabestani, R.; Reszka, K. J.; Sigman, M. E. J. Photochem. Photobiol. A, 1998, 117, 223.
25Jakubiak, R., Bao, Z., Rothberg, L. Synth. Met., 2000, 114, 61. 26Takahasi, K., Horino, K., Komura, T., Murata, K. Bull. Chem.
Soc. Jpn., 1993, 66, 733.
27Eychmuller, A.; Rogach, A. L.; Pure Appl. Chem., 2000, 72, 179.
28Brueggermann, K., Czernuszewicz, R. S., Kochi, J. K. J. Phys. Chem., 1992, 96, 4405.
29Das, S. K., Krishnamoorthy, G., Dofra, S. K. Can. J. Chem., 2000, 78, 191.
30Jones, G., Jimenez, J. A. C. Tetrahedron Lett., 1999, 40, 8551. 31Smith, G., Lynch, D. E., Byriel, K. A., Kennard, C. H. L. J.
Chem. Crystallogr., 1997, 27, 307.
32Smith, G., Lynch, D. E.,; Bott, R. C.,Aust. J. Chem., 1998, 51, 159.
33Smith, G., Bott, R. C.,Rae, A. D., Willis, A. C. Aust. J. Chem., 2000, 53, 531.
34Hsu, S., Lin, K., Chou, C., Chiang, A., Liang, W.,
Chang, H., Tsai, J., Liao, W., Huang, F., Huang, J. K., Chen, I., Liu, S., Kuo, C.,; Jan, C. Eur. J. Pharmacol., 2011, 670, 85.
35Nerio, L. S., Olivero-Verbel, J., Stashenko, E. Bioresour. Technol., 2010, 101, 372.
36Gujar, J. G., Wagh, S. J., Gaikar, V. G. Sep. Purif. Technol., 2010, 70, 257.
37Wattanasatcha, A., Rengpipat, S., Wanichwecharungruang, S.
Int. J. Pharm., 2012, 434, 360.
38Silva, M. A, da Daemona, E., Monterio, C. M. O., Maturanoa, R., Britoa, F. C., Massoni, T. Vet. Parasitol., 2011, 183, 136.
39Buyukleyla, M., Rencuzogullari, E. Ecotoxicol. Environ.
Saf., 2009, 72, 943.
40Shapira, R., Mimran, E. Microb. Drug Resist., 2007, 13, 157. 41Lazar-Baker, E. E., Hetherington, S. D., Ku, V. V., Newman,
S. M. Lett. Appl. Microbiol., 2010, 52, 227.
42Glenn, G. M., Klamczynski, A. P., Imam, S. H., Chiou, B., Orts, W. J., Woods, D. F. J. Agric. Food Chem., 2010, 58, 4180.
43Skoog, D. A. Principle of Instrumental Analysis, 3rd ed., (Chapter 7), Saunders, New York, USA, 1985.
44Benesi, H. A., Hildebrand, J. H. J.Am. Chem. Soc., 1949, 71, 2703.
45Abu-Eittah, R., Al-Sugeir, F., Can. J. Chem., 1976, 54, 3705. 46Hossan, A. S. M.; Abou-Melha, H. M.; Refat, M. S.
Spectrochim. Acta A, 2011, 79, 583.
47Lever, A. B. P. Inorganic Electronic Spectroscopy, 2nd ed.. Elsevier, Amsterdam, 1985, p. 161.
48Tsubomura, H., Lang, R. P. J. Am. Chem. Soc., 1961, 83, 2085. 49Rathone, R., Lindeman, S. V., Kochi, J. K. J. Am. Chem. Soc.,
1997, 119,
50Aloisi, G., Pignataro, S., J. Chem. Soc., Faraday Trans. 1972, 69, 534.
51Briegleb, G., Czekalla, J., Z. Phys. Chem. (Frankfurt), 1960, 24, 237.
52Briegleb, G. Z. Angew. Chem. 1960, 72, 401, Z. Angew. Chem. 1964, 76, 326.
53Martin, A. N., Swarbrick, J., Cammarata, A., Physical Pharmacy, 3rd ed., Lee and Febiger, Philadelphia, PA, 1969, p. 344.
54El-Sayed, M., Agrawl, S. Talanta, 1982, 29, 535.
55Refat, M.S.; Elfalaky, A.; Elesh, E. J. Mol. Struct., 2011, 990, 217.
56Al-Ahmary, K. M., Habeeb, M. M., Al-Solmy, E. A; J. Mol.
Liq., 2011, 162, 129.
57Al-Attas, A. S., Habeeb, M. M., Al-Raimi, D. S. J. Mol. Struct., 2009, 928, 158.
58Refat, M. S., El-Zayat, L. A., Yesilel, O. Z., Spectrochim.
Acta A, 2010, 75, 745.
59Refat, M. S., Saad, H. A., Adam, A. A. J. Mol. Struct., 2011, 995, 116.
60Bellamy, L. J. The infrared Spectra of Complex Molecules, Chapman & Hall, London, 1975.
61Bharathikannan, R., Chandramohan, A., Kandhaswamy, M. A., Chandrasekaran, J., Renganathan, R., Kandavelu, V.
Cryst. Res. Technol., 2008, 43(6), 683.
62Gaballa, A. S., Teleb, S. M., Nour, E., J. Mol. Struct., 2012, 1024, 32.
63Adam, A. A., J. Mol. Struct., 2012, 1030, 26.