A report prepared by the Institutional Investor Custom Research Group
in conjunction with AMP Capital / October 2013
YIELD, GROWTH
OR THE BEST
Welcome to the second issue of the AMP Capital
Institutional Investor Research Report
This study provides institutional investors with benchmark information on asset allocation and investment trends through primary research among investment decision makers around the world.
This issue includes findings on: • Asset allocations as of June 2013 • Allocation intentions for the next quarter
• Allocations to and expectations for cash, fixed income, equities and alternatives • Market expectations
• Thoughts about currency exchange rates • Interest levels in alternatives
• Regional and segment differences in allocations and expectations
It finds the following assets are now in great demand from some of the world’s largest institutional investors: • Direct property • Direct infrastructure • Private equity • Infrastructure debt • European equities • Emerging market equities
We hope you find the results of this research useful, and we’d be pleased to hear your comments and questions.
Sam Knox Managing Director
Institutional Investor Research
Anthony Fasso
Chief Executive International and Head of Global Clients AMP Capital
If you are interested in participating in this research program, please contact
For more information on AMP Capital, please contact
Copyright © Institutional Investor LLC 2013. All rights reserved. All text and content of this research report are the exclusive property of Institutional Investor. The research and commentary in this document are intended to highlight results, trends, and patterns among the respondents in this study. In no event should the content of this report be construed to constitute an investment recommendation or managerial advice from Institutional Investor or AMP Capital, which sponsored this study.
A substantial
number of
investors plan
to reduce their
exposure to U.S.
equities and
government and
investment grade
corporate bonds.
Allocations to less
correlated assets,
such as high-yield
bonds, emerging
market securities
and alternative
investments, are
expected to grow.
Yield, growth or the best of both worlds?
After experiencing stronger-than-expected returns from the capital markets during the first half of this year, a substantial number of institutional investors are reevaluating their portfolios as they wait for central banks to tighten their monetary policies. But rather than abandon equities and fixed-income out of concern over higher interest rates and quantitative easing coming to an end, investors are fine-tuning their approach, with many seeking appreciation from capital growth combined with yield from new and different sources supplemented by better risk-reward profiles. They remain focused on preserving capital value.
This is one reason more investors plan to allocate additional assets to Europe, where they see undervalued stocks and bonds, with valuations there now more attractive after the sell-off in recent years. Overall, institutional investors have at present roughly a quarter of their portfolios allocated to foreign or global equities and almost a fifth devoted to domestic stocks. Similar percentages of their assets are in foreign/global and domestic bonds.
Fewer than 10% of their portfolios are at present invested in alternatives such as real estate, infrastructure debt, hedge funds or private equity. But given expectations for the economy and capital markets, more assets are expected to shift out of the public markets and into alternatives, especially real assets that combine yield with opportunity for capital growth.
About this research
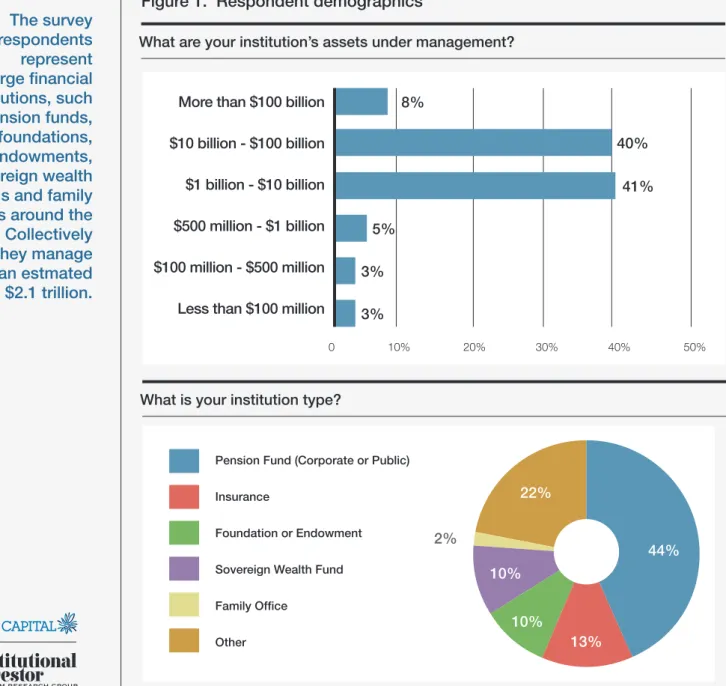
In the second quarter of 2013, Institutional Investor’s Custom Research Group was commissioned by AMP Capital to conduct a survey of senior decision makers at investing institutions in Europe, the Middle East, North and South America, and Asia (including Australia and Japan). Sixty-five individuals responded.
As shown in Figure 1 below, survey respondents represent large financial institutions—48% of them work for firms with $10 billion or more in assets under management—such as pension funds, foundations, endowments, sovereign wealth funds and family offices. Forty-three percent of respondents are located in North and South America, 44% are in Europe and the Middle East, and 13% are in Asia. Collectively they manage an estimated $2.1 trillion.
The survey
respondents
represent
large financial
institutions, such
as pension funds,
foundations,
endowments,
sovereign wealth
funds and family
offices around the
world. Collectively
they manage
an estmated
$2.1 trillion.
What is your institution type?
Percentage of respondents. Values may not total 100% due to rounding. “Other” includes asset managers and similar institutions.
What are your institution’s assets under management?
Figure 1. Respondent demographics
3%
3%
More than $100 billion
$10 billion - $100 billion
$1 billion - $10 billion
$500 million - $1 billion
$100 million - $500 million
Less than $100 million
0 10% 20% 30% 40% 50%
Pension Fund (Corporate or Public) Insurance
Foundation or Endowment Sovereign Wealth Fund Family Office Other
2%
44%
13%
10%
10%
22%
8%
40%
41%
5%
Current asset allocations
Most respondents remain heavily exposed to public equities and debt, with 41% of their portfolios in equities and 31% in fixed income assets. A considerable number of the respondents are also allocating assets to alternatives such as real estate, infrastructure debt, private equity and hedge funds. Six percent of their assets are invested in private equity, while another 6% are allocated to real estate. Pension plans are more heavily invested in equities and less heavily in hedge funds than are other institutions. Investments in all asset classes except fixed income—and government bonds in particular—have met or exceeded expectations of 90% or more of survey respondents during the past year.
Figure 2. How assets were allocated as of June 2013
Equities
Domestic equities ... 16%
Foreign/global equities ... 25%
Fixed income Domestic fixed income ... 17%
Foreign/global fixed income ... 14%
Alternatives Direct property ... 6% Listed property/REITs ... 1% Infrastructure ... 1% Hedge funds ... 4% Private equity ... 6% Other alternatives ... 5% Cash ... 5% 100%
Figure 2.1. How institutional allocations compare
Pension Fund(Corporate or Public) Insurance
Sovereign Wealth Fund/ Foundation/Endowment/
Family Office/Other
Domestic equities 19% 18% 14%
Foreign/global equities 27% 7% 27%
Domestic fixed income 17% 32% 10%
Foreign/global fixed income 10% 24% 16%
Direct property 6% 5% 7% Listed property/REITs 2% 1% 1% Infrastructure 2% 1% 1% Hedge funds 4% 1% 5% Private equity 6% 3% 7% Other alternatives 7% 2% 4% Cash 1% 7% 9%
Values may not total 100% due to rounding
The differences in allocation among types of institutional investors naturally reflect their investment objectives, risk tolerance and regulatory environment. Certain types of insurers, for example, face increased regulation that affects their investment approach, which explains in part their preference for global fixed income over global equities, private equity and hedge funds.
Pension plans
are more heavily
invested in
equities and less
heavily in hedge
funds than are
other institutions.
Investors are
likely to reduce
their fixed
income holdings
and to invest in
infrastructure,
direct real estate,
and private equity.
Trends in allocations
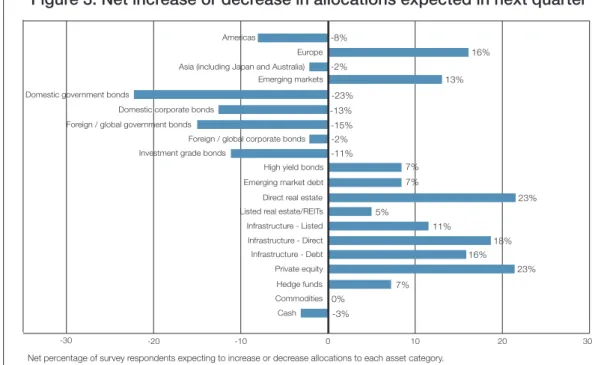
Many investors are likely to invest more in Europe this quarter, which is a reflection of the attractive valuations in the region. Investors are likely to reduce their fixed income holdings—especially in government and investment grade corporate bonds—and to invest in infrastructure, direct real estate, and private equity.
How allocations are changing
Figure 3. Net increase or decrease in allocations expected in next quarter
Figure 4. Have your investments in the following asset classes fallen short,
met or exceeded your expectations in the last 12 months?
Fallen short of
expectations expectationsMet expectationsExceeded my fund’s portfolioNot part of
Equities
Equities in general 7% 33% 55% 5%
Equities held for dividend yield 2% 41% 28% 29%
Listed real estate 3% 32% 19% 46%
Fixed Income
Fixed income in general 15% 67% 13% 5%
Government bonds 24% 53% 7% 16%
Corporate bonds 7% 62% 19% 12%
Other fixed income 4% 56% 19% 21%
Alternatives
Infrastructure 9% 31% 10% 50%
Direct investment in real estate 3% 43% 22% 32%
-3% 0% 7% 23% 16% 18% 11% 5% 23% 7% 7% -11% -2% -15% -13% -23% 13% -2% 16% -8% -30 -20 -10 0 10 20 30 Americas Europe Asia (including Japan and Australia)
Emerging markets Domestic government bonds
Domestic corporate bonds Foreign / global government bonds
Foreign / global corporate bonds Investment grade bonds
High yield bonds Emerging market debt Direct real estate Listed real estate/REITs Infrastructure - Listed Infrastructure - Direct Infrastructure - Debt Private equity Hedge funds Commodities Cash
Net percentage of survey respondents expecting to increase or decrease allocations to each asset category.
Return objectives: Back to capital growth
Figure 5. Do you favor capital appreciation or cash yields during the next
three years?
More than three-fourths of respondents indicated they now favor capital growth over yield—a major shift compared to recent years when assets generating cash yields were among the most preferred allocations of investors around the world. Today, only 23% of the respondents favor cash yields over capital apprecia-tion over the next three years.
This shift helps explain institutional investors’ renewed interest in European stocks, after all the financial concerns there in recent years, and demonstrates a bargain-hunting approach toward value investments. This is echoed in selected emerging markets equities and anywhere investors believe a quality stock or other asset has been sold off and is undervalued and will return to its true value, enabling savvy investors to collect the increase in book value along the way.
Investors have already seen good returns over the past financial year from growth-oriented investments, such as US and global shares, along with some solid gains from selected property, while returns from bonds and cash have slowed. This trend has grown stronger, despite continued recessions in Europe, fiscal problems in the United States, and a slowdown in China. These concerns were offset by continued growth in the global economy, reasonable profit growth at large enterprises, and European measures to deal with its crises, with a policy by the ECB to do “whatever it takes” to defend the euro. Meanwhile, a sea of change is underway in Japan, where Abenomics has ushered in reflationary policies that are the most aggressive in the past twenty years.
Can it continue? Judging from current allocation decisions, investors believe the cyclical bull market in shares has further room to run. Yet they are hedging their bets.
Judging from
allocation
decisions,
investors believe
the cyclical bull
market in shares
has further room
to run. Yet they are
hedging their bets.
77%
23%
My fund favors capital appreciation overcash yields over the next three years My fund favors cash yields over capital appreciation over the next three years
The demand for yield remains
Despite the shift in investment focus toward capital appreciation, this survey finds that income-generating investment strategies still rank high for a substantial proportion of investors.
“P/E multiples are rich so we expect shareholder yield to drive returns,” observes the CIO of a US public pension plan with $1 billion to $10 billion in assets. Adds an executive of a UK private plan of similar size: “As the long term is so unpredictable, cash in the hand is worth more than capital appreciation at this time.” Many institutions still seek to lock in a portion of their investments in an effort to generate predictable, consistent yield that matches their outgoing expenses. Liability-driven investing (LDI) and risk-matching remain key for defined benefit pensions and insurers in particular.
However, investors are searching for yield in different ways. Almost three in 10 of them plan to reduce their allocations to domestic government or corporate bonds in favor of high-yield corporate bonds.
Figure 6. Expectations for fixed income
Which fixed-income investment will produce the most favorable return over
the next 12 months?
Private debt (nontraded) 33%
High yield corporate bonds 29%
Emerging market bonds 16%
Investment grade corporate bonds 13%
Other fixed income assets 7%
Government bonds 2%
Liability driven
investing (LDI)
and risk-matching
remain key for
defined benefit
pensions and
insurers in
particular.
Where in the world are the best yields?
Fixed Income
There is a wide range of returns on offer in the corporate bond segment. Australian corporate bonds have outperformed those of other developed markets tracked by Bank of America Merrill Lynch indices over the past decade, returning 7% a year over 10 years to January 31, 2013.
New sources of yield
In another finding that suggests institutional investors are seeking new venues from which to derive yield, sizable proportions of respondents report increasing interest in real assets such as direct property, infrastructure and infrastructure debt.
Public vs. private debt
Investors say they will increase their allocation to the private debt markets, despite the risk of asset illiquidity, perhaps because they expect private debt to be less vulnerable to rising interest rates. Those expectations are apparent in investors substantial level of interest in infrastructure debt, which offers inflation protection through government contracts. Forty-two precent of respondents said they are somewhat or very likely to invest in that asset class during the next 24 months.
Infrastructure debt is also increasingly popular with survey respondents. Some 15% of institutions expect to increase their allocations to this asset, which has been created by the retreat of the global banking sector from infrastructure lending, in major part due to Basel III requirements.
Figure 7. Over the next two years, how likely is your fund to invest in
infrastruc-ture debt rather than traded fixed income assets in an effort to gain higher yields?
Values may not total 100% due to rounding.
Given the growing demand from investors for direct or unlisted infrastructure, almost 20% of all institutions expect to increase their allocations to this asset class in the third quarter. The greatest demand for direct infrastructure investments is from foundations, private pensions, public pensions and sovereign wealth funds, according to the survey.
Australian
corporate bonds
have outperformed
those of other
developed markets.
Not at all likely Not very likely Somewhat likely Very likely
11%
31%
36%
23%
Returns from
senior debt tend
to range between
low 200 bps to
mid 300s bps
over cash yield.
One of the appeals of this asset class is that its typical performance bridges the gap between fixed income and equity. The stable bond-like payment structure of infrastructure assets provides predictable and consistent mid- to long-term returns—absolute returns—and thus can help institutional investors meet their desired rate of return.
This trend also explains the increased interest in listed infrastructure, combining the renewed interest in stocks—and their capital appreciation—with the attraction of the wider infrastructure class and its yields.
In this asset class, subordinated or junior debt may offer the most compelling opportunities. Subordinated debt ranks behind senior debt, but ahead of equity in a company’s capital structure and offers higher yields than most fixed income and senior debt. Returns from senior debt, for example, tend to range between low 200 bps to mid 300s bps over cash yield, while junior debt provides internal rates of returns around 9-10%—well above fixed income.
Equities
With equities having rebounded over the past 18 months, especially in the US, sophisticated investors are seeking alternatives such as hedge funds that can maximize equity returns while at the same time providing downside protection if there is another turn for the worse on global share markets.
The most sought after hedge funds have a long/short strategy, with investors preferring single-manager funds to funds-of-hedge funds, according to research by Preqin in August. Quant funds account for a third of the $2.3 trillion hedge industry, according to Hedge Fund Research. Asian quant funds, in paticular, are in great demand. While quant markets are well established in America and Europe, they are less so in Asia, where their comparative absence has created opportunities.
The report found the greatest demand for hedge funds in Q2 was from endowments and foundations, then public pensions. Interestingly, the larger the institutional investor the less it allocates to hedge funds and private equity in terms of percentage of assets.
Currency
Institutional investors are split over the importance of exchange rates when they seek yield, such as foreign fixed income, with public pension funds and insurance companies reporting they care much more about currency values than sovereign wealth funds do.
Figure 8. How important is the forecast for exchange rates when institutional
investors allocate assets to foreign fixed income?
Not at all important Not very important Somewhat important Very important
19%
15%
32%
34%
A focus on both yield and capital growth
These trends in asset allocation highlight how institutional investors are seeking both capital appreciation as well as consistent yield, either in separate or in singular investments.
This explains the popularity of direct real estate, private equity, direct infrastructure and infrastructure debt (as shown in Figure 3), where institutional investors seek to combine stable capital growth with predictable, consistent yields.
The report found the greatest institutional demand in the third quarter was for direct real estate. This came from public pensions, private pensions, endowments and foundations, insurers and sovereign wealth funds. Investors are attached to its consistent yield coupled with the potential for capital gain. Of course, returns depend on the type and location of property investment.
Whether demand will continue for direct property investment is uncertain, with the withdrawal of the stimulus program known as Quantitative Easing (QE) by the Federal Reserve Bank expected to lead to a rise in interest rates, and thus debt costs. But since the tapering of QE is expected to be gradual and in response to an improving economy, it shouldn’t have too great an impact, contingent as it is on a stronger US economy, which is positive overall for property.
Location, location, location
The US real estate market is a global bright spot, supported by its recovering economic
fundamentals. The newly energized Japanese market, which was stagnant for 20 years, is supported by changing fundamentals and is not an asset bubble. The recovery in the European market has been slow, but London is showing good rental growth. While conditions in Australia are weak, the country’s high yield—one of the highest in the world—is still very attractive to institutional investors.
The report
found the
greatest
institutional
demand in the
third quarter
for direct
real estate.
Regional findings
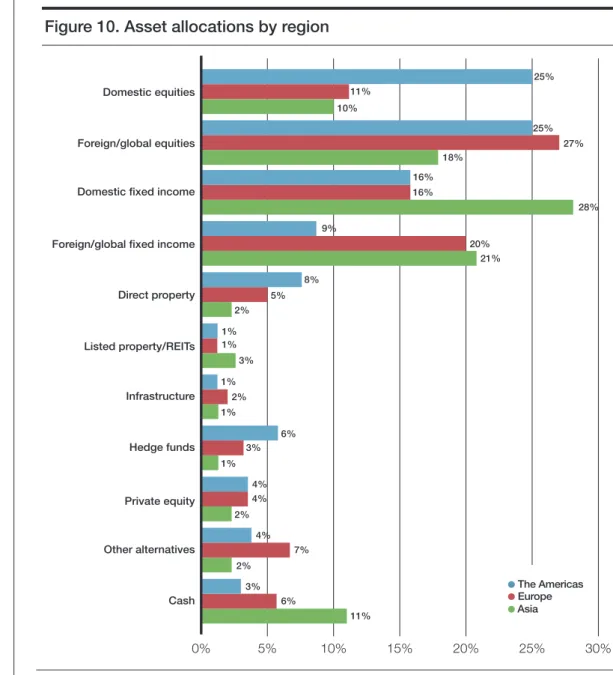
The study found sizable differences in asset allocation among regions. North American institutions allocate much more to equities, especially domestic equities, than those in other regions. The study also found American institutions currently have the lowest allocation to global fixed income.
Demand for real estate was particularly strong in Europe (with almost 41% of respondents seeking to increase their direct real estate investments), followed by Asia (29%) and North America (17%). North American institutions are the biggest investors in direct real estate, having an average allocation of over 8%, compared with 5% for Europe and just 2% for Asia.
0% 5% 10% 15% 20% 25% 30% Cash Other alternatives Private equity Hedge funds Infrastructure Listed property/REITs Direct property Foreign/global fixed income Domestic fixed income Foreign/global equities Domestic equities 25% 11% 10% 25% 27% 18% 16% 16% 28% 9% 20% 21% 8% 5% 2% 1% 1% 3% 1% 2% 1% 6% 3% 1% 4% 4% 2% 4% 7% 2% 3% 6% 11% ●Asia ● Europe ● The Americas
Allocations to
infrastructure by
North American
institutions is
expected to
grow as the US
government
starts to tap
investors as a
market for funds.
Figure 10. Asset allocations by region
Demand for direct infrastructure investments is greatest from medium- and smaller-sized European and Asian, then North American, institutions. Allocations by the latter are expected to grow as the US government starts to tap institutional investors as a market for funds to help it develop and upgrade the country’s infrastructure. The survey also shows demand for infrastructure debt being strongest from institutions in Europe and growing in Asia as well as North America.
Interest in hedge funds is particularly strong in North America, followed by Asia, and then Europe.
In summary
The survey finds investors taking a three-pronged approach to their current asset allocations:
1. Investments that offer value and potential for capital growth, such as European equities, private equity and hedge funds. These provide “blue sky” growth potential for portfolios and are larger in those that can tolerate more risk.
2. Investments that provide predictable, consistent yield, such as high-yield corporate bonds, non-traded private debt and infrastructure debt. These provide consistency of income for those investors that require less risk and are a larger component of those portfolios that require liability matching outgoings.
3. Alternatives that offer yield, such as infrastructure, equity income/dividend funds and listed infrastructure and real estate funds. These can provide both yield and capital growth—in varying degrees and with varying risk-return mixes.
The mix of these three components varies with each investor’s objectives, risk tolerance and access to investments. This can be seen in the differences in asset allocations among institutional investor segments in Figure 2.
Overall, the findings support the idea that secular trends of the last decade appear to be reversing. Developed market shares appear to be rebounding, whereas emerging market shares do not. Commodity prices appear to have peaked under the influence of slowing Chinese growth. The last six months have seen an improvement in investor confidence towards share markets. But coming from a low base, it is a long way from the excessive optimism associated with market tops. While US equity mutual funds have seen inflows this year, they will have to see a lot more before the $556bn in outflows seen over the previous five years is reversed. Conversely, bond funds have a long way to go before the $1.1 trillion in inflows seen over the last five years is reversed.
One of the appeals of real assets is their tangibility, which offers greater stability and insulation from risk of public equity markets. A second appeal is that real assets’ typical performance bridges the gap between fixed income and equity (see Figure 9).
Contact information
For more information on AMP Capital and its offerings, visit www.AMPcapital.com or contact Guy McKanna at [email protected].
Readers interested in this research and other programs like it should visit www.institutionalinvestor.com or contact Michele Luthin at [email protected].
Important note: AMP Capital Investors Limited (ABN 59 001 777 591, AFSL 232497) and AMP Capital Funds Management Limited (ABN 15 159 557 721, AFSL 426455) make no representations or warranties as to the accuracy or completeness of any statement in it including, without limitation, any forecasts. Past performance is not a reliable indicator of future performance. This document has been prepared for the purpose of providing general information, without taking account of any particular investor’s objectives, financial situation or needs. An investor should, before making any investment decisions, consider the appropriateness of the information in this document, and seek professional advice, having regard to the investor’s objectives, financial situation and needs. This document is solely for the use of the party to whom it is provided.