S O F T W A R E
Open Access
PharmDock: a pharmacophore-based docking
program
Bingjie Hu and Markus A Lill
*Abstract
Background:Protein-based pharmacophore models are enriched with the information of potential interactions between ligands and the protein target. We have shown in a previous study that protein-based pharmacophore models can be applied for ligand pose prediction and pose ranking. In this publication, we present a new pharmacophore-based docking program PharmDock that combines pose sampling and ranking based on optimized protein-based pharmacophore models with local optimization using an empirical scoring function.
Results:Tests of PharmDock on ligand pose prediction, binding affinity estimation, compound ranking and virtual screening yielded comparable or better performance to existing and widely used docking programs. The docking program comes with an easy-to-use GUI within PyMOL. Two features have been incorporated in the program suite that allow for user-defined guidance of the docking process based on previous experimental data. Docking with those features demonstrated superior performance compared to unbiased docking.
Conclusion:A protein pharmacophore-based docking program, PharmDock, has been made available with a PyMOL plugin. PharmDock and the PyMOL plugin are freely available from http://people.pharmacy.purdue.edu/~mlill/ software/pharmdock.
Keywords:Protein pharmacophores, Docking, Scoring, Biased docking, Constraint docking, Confined docking, GUI, PyMOL
Background
Pharmacophore models aim to comprise the features of ligand-protein interactions that are most crucial for bind-ing and biological activity. These models are used for vir-tual screening (VS) to identify potential new actives or for generating ligand alignments for subsequent QSAR simu-lations. Pharmacophore models are typically derived from structural features common to biologically active ligands that are hypothesized to be important for biological activ-ity [1-5]. Such ligand-based pharmacophore models are dependent on the chemical features present in the known actives. Physicochemical features that are absent in the particular set of actives, but are important for the binding of structurally different ligands, will likely be neglected in the pharmacophore model. Alternatively, the binding site of the target protein can be used to generate a protein-based pharmacophore model without the inclusion of
ligand information. These protein-based pharmacophore models are advantageous because a priori knowledge of active ligands is not required and the models are not biased by the chemical space of previously identified ac-tives. Several approaches [6-9] have been developed to derive protein-based pharmacophore models from ligand-free proteins and apply the pharmacophore models in virtual screening.
Protein-based pharmacophore models are, by definition, enriched with the information of potential interactions be-tween ligands and the protein target. Consequently, a direct application of the protein-based pharmacophore models is to use them for ligand pose prediction and pose ranking. In a recent study, we have explored the potential of protein-based pharmacophore models in ligand pose prediction and ranking [10]. We carefully optimized the pharmacophore-generation process to reproduce native contacts for a large number of experimentally-determined protein-ligand com-plexes. We then developed a fast pharmacophore-based matching and scoring scheme and tested it on the PDBbind [11] core set. When the native ligand conformations, i.e. the * Correspondence:[email protected]
Department of Medicinal Chemistry and Molecular Pharmacology, College of Pharmacy, Purdue University, 575 Stadium Mall Drive, West Lafayette, IN 47906, USA
ligand conformations from the crystal structures, were used as input, our pharmacophore-based scheme was able to identify native-like poses (with RMSD to the X-ray
pose≤2 Å) within the top-100 ranked poses for 94% of
the tested entries. When the low-energy conformations generated by OpenEye Omega [12-14] were used as input, we were still able to maintain a success rate of 71% for predicting native-like binding pose within the top-100 ranked poses. These results were comparable in quality to several widely used docking programs.
Inspired by the promising results in ligand pose predic-tion and pose ranking using protein-based pharmacophore models, we extended the pharmacophore-based matching and scoring scheme into a docking program, named
PharmDock (Pharmacophore-basedDocking). The docking
program further optimizes the top ranked binding poses predicted from the pharmacophobased scheme and re-scores the optimized binding poses with a widely used empirical scoring function. We report here PharmDock’s performance in binding pose prediction and free energy of binding estimation tested on the PDBbind core set [11,15], as well as its performance in virtual screening on 29 targets from the dictionary of useful decoys (DUD) dataset [16]. We also present an open-source graphical user interface (GUI) adapted to PyMOL [17,18] that we have developed for PharmDock for ease use of the docking software by the scientific community. In addition, we de-veloped two new features within the PyMOL GUI allowing the users to guide the docking process towards specific res-idues identified from previous experimental data.
Implementation
The docking program PharmDock
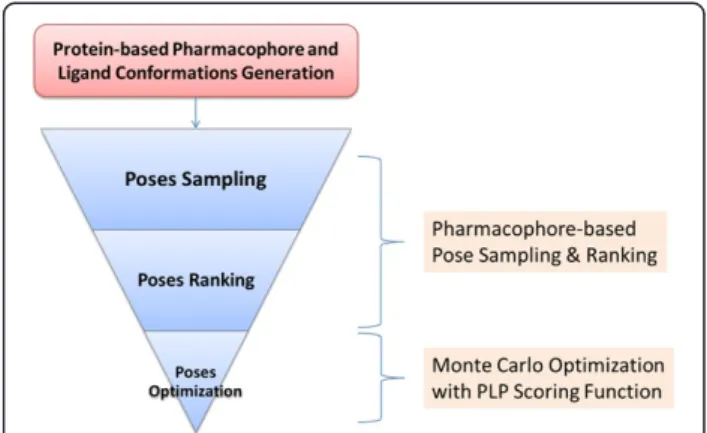
An overview of PharmDock is shown in Figure 1. It sam-ples the ligand binding poses by enumerating all possible multiple-points matches between pharmacophores of an ensemble of pre-generated ligand conformations and protein-based pharmacophores. The sampled binding poses are then ranked using a simple pharmacophore-based scor-ing function. A set of top ranked bindscor-ing poses will be lo-cally optimized within the protein binding site to obtain the final ligand binding pose and binding score. The first two parts of PharmDock are based on a pharmacophore or functional group representation of ligand and protein whereas the last step of pose optimization is atom-based. The details of pharmacophore generation, ligand poses sampling and ranking, final poses optimization will be de-scribed below.
Generation of protein-based pharmacophores
Protein-based pharmacophores refer to the potential inter-action sites for the ligand to favorably interact with the protein atoms in the binding site. They can be viewed as the negative or complementary image of the topology and
physicochemical properties of the protein binding site. Four types of protein-based pharmacophores are defined in our program: hydrogen-bond donor/acceptor, hydro-phobic, aromatic and ionic pharmacophores. In addition, the exclusive volume of the protein is also represented by the so-called forbidden pharmacophores, representing the binding site residues that would sterically overlap with lig-and atoms placed at this respective position.
were computed by a k-means clustering over all grid points with favorable hydrophobic scores. For each cluster, the hydrophobic pharmacophore element was then de-fined as the energy-weighted geometric center of all grid points of a particular cluster. The number of clusters, k,
was adjusted until the minimum distance between a clus-ter cenclus-ter iand any other cluster center was on average smaller than a certain distance cutoff. K-means clustering to generate hydrogen-bond, aromatic and ionic pharmaco-phores was performed over the grid points associated with the same nearest functional group. For example, in gener-ating a hydrogen-bond donor pharmacophore, the pro-gram iterates through all protein acceptors, and groups the grid points closest to the same acceptor into one patch. K-means clustering was then performed within this patch. In our previous study [10], we have investigated the influ-ence of clustering distance cutoff of each pharmacophore type on the ligand pose sampling accuracy and efficiency. We found that pharmacophore models comprised by only hydrophobic and hydrogen bond elements, which are generated using a distance cutoff of 1.5 Å and 2.0 Å re-spectively, provide the best compromise between pose sampling accuracy and efficiency. These values will be used for the pharmacophore-based pose sampling process described below. For the pose-ranking process, a more de-tailed pharmacophore model using a 1 Å cluster distance cutoff for all pharmacophore types was adopted. The ra-tionale is that the densest pharmacophore model provides the best description of the potential protein-ligand interac-tions and consequently should provide the largest amount of information for scoring.
Generation of ligand conformation and pharmacophores
PharmDock uses the low-energy conformers for a ligand generated by Openeye Omega [12-14] as docking input. For each ligand, a maximum of 100 conformations are generated with the calculated internal energy no more than 15 kcal/mol above the energy of the ligand conform-ation with the lowest internal energy. Duplicate conformers are removed using a 0.2 Å root-mean-square deviation (RMSD) cutoff for ligands with zero to three rotatable bonds, a 0.3 Å cutoff for ligands with four to six rotatable bonds, and a 0.4 Å cutoff for all ligands with more than six rotatable bonds. The in-houseprogram
clusterconfor-meris then used to generate the pharmacophore elements
for each ligand conformation. Four types of pharmaco-phores are defined for each ligand: hydrogen-bond donor/ acceptor, hydrophobic, aromatic and ionic pharmaco-phores. Hydrogen-bond pharmacophores are placed at the position of potential donor and acceptor groups of the lig-and: Hydrogen-bond donors are polar hydrogen atoms bonded to oxygen, nitrogen and sulfur atoms, acceptors are oxygen, nitrogen and sulfur atoms with at least one lone pair. Ligand atoms (excluding hydrogen atoms) are
defined to be hydrophobic if they were not hydrogen-bond donors or acceptors or directly hydrogen-bonded to a ligand’s donor or acceptor atoms. The hydrophobic atoms from each ligand conformation are clustered using hierarchical clustering with a minimum distance between cluster centers of 2.0 Å. Clustering is performed to reduce the number of hydrophobic ligand pharmacophores. This sig-nificantly reduces the cost of clique detection and conse-quently increases the efficiency of the docking process. Aromatic pharmacophores are defined as centers of aro-matic rings. Ionic groups included functional groups that are formally charged positive or negative, e.g. protonated amines or deprotonated carboxylic acids, and are placed at the centroid of the functional group.
Pharmacophore-based pose sampling and ranking
heavy atoms overlapped with forbidden pharmacophores, the pose is rejected.
The ligand poses sampled by PharmDock are initially scored and ranked using a simple geometric function based on the matching pharmacophore pairs formed by each ligand pharmacophore and its closest protein-based pharmacophore of the same type:
S¼‐0:7X
hbondf rð Þ‐0:4
X
hphobf rð Þ‐0:6 X
aromf rð Þ‐0:6
X
ionicf rð Þ
ð1Þ
The weights for the different types of pharmacophores were optimized to achieve the best separation between native-like poses (≤2 Å RMSD to the X-ray binding pose) and decoy poses for 190 tested protein-ligand complex structures. A detailed description of the optimization pro-cedure can be found in our previous publication [10]. f(r) is a distance-dependent function that measures the spatial separation of ligand and protein-based pharmacophores of a matching pharmacophore pair:
f rð Þ ¼
1:0 r≤0:5Å 2ð1:0−rÞ 0:5Å<r≤1:0Å
0 r>1:0Å
8 <
: ð2Þ
r is the distance between the ligand pharmacophore and its closest matching protein-based pharmacophore of the same type. It is noteworthy that equation 2 calculates the score of a pose based on all the ligand pharmacophores ra-ther than only those involved in forming the matching cli-ques. Also, the detailed pharmacophore models with 1 Å clustering distance cutoff were used for the ranking process.
Local optimization of the ligand binding poses
The pharmacophore-based pose sampling and ranking scheme was deployed to efficiently filter out ligand bind-ing poses that are unlikely to be the native bindbind-ing pose. As shown in our previous study [10], this procedure was indeed very effective to enrich the ranking list of binding poses with native-like poses within the top-100 positions. To further optimize the predicted ligand binding poses and estimate the binding energy of the ligand to the tar-get, we perform a local Metropolis Monte Carlo (MC) [24] optimization for the top-100 ranked poses with the Piecewise Linear Pairwise (PLP) scoring function [25].
PLP [25] is one of the earliest developed empirical scoring functions. It is a sum of pairwise interactions be-tween protein and ligand atoms based on their interac-tions types. Only hydrogen bonding (H-bond) and steric interactions are considered:
Etotal¼EH−bondþEsteric ð3Þ
A detailed description of the PLP function can be found in Gehlhaar et al.’s [25] original work. Briefly, each ligand and protein atom is categorized into four types: H-bond donor, H-bond acceptor, H-bond donor/ acceptor, nonpolar. Each pair of ligand-protein atoms is then assigned with one and only one of the interaction types: H-bond or steric. Both EH−bond and Esteric are
computed using similar piecewise linear functions but with different parameters [25]. Despite the simplicity of PLP, it was shown to be one of the best scoring func-tions in identifying the true ligand binding poses among decoy poses and ranking the different ligands that bind to the same protein according to their binding affinities [26]. Therefore, we finally settled on PLP scoring func-tion for our local optimizafunc-tion and final scoring of the ligand binding poses.
An individual MC optimization was performed for every of the top-100 binding poses generated by clique detection and ranked by the simple pharmacophore-based scoring function. Throughout MC refinement for a given ligand binding pose, a new ligand pose is gener-ated from the previous pose by applying small perturba-tions on its position, orientation and torsion angles. The newly sampled pose is accepted based on several criteria: 1) If the RMSD of the current ligand pose compared to the starting pose is larger than 3.5 Å, the current pose is rejected and coordinates of the starting pose are reas-signed to the ligand. 2) If the RMSD is smaller than 3.5 Å, the PLP score of the current pose (Scorecur) is
compared with the minimum PLP score of all previous poses (Scoremin). IfScorecuris smaller thanScoremin, the
current step is accepted. Otherwise, the Scorecur is
compared with the score of the last accepted step (Scorepre) and the current pose is accepted based on
the probabilityP:
P¼ exp −Scorecur−Scorepre RT
ð4Þ
where Ris the ideal gas constant (1.986 cal/mol-K) and T the temperature (300 K). If this factor is larger than a random number generated from a uniform distribution between 0 and 1, the current pose is accepted.
different maximum step sizes for central and terminal torsions are determined based on the equation:
ratio¼ 1:0þcos πNatomsNmax
0:5ð1:0−εÞþε;jNatoms<Nmax ε;jNatoms≥Nmax (
ð5Þ
Whereεis set to 0.15 andNmaxis 8.Natomsis the total
number of heavy atoms attached to the smaller branch of this torsion. Equation 5 determines a scaling factor
‘ratio’with which the maximum allowed torsional change is modified. For example, if the maximum torsional change is set tomax= 60°, this value will be scaled by ra-tio =0.5 + 0.5ε= 0.575 (yielding max= 34.5°) and ratio=
0.15 (max= 9°) for torsions with 4 and 8 heavy atoms
attached to the smaller branch of the torsion, respectively.
Development of the PyMOL plugin
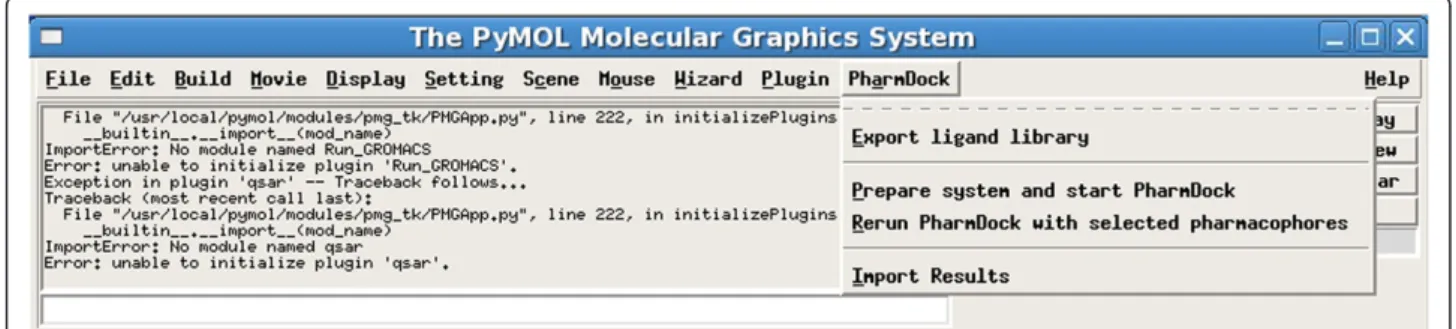
For easy use of PharmDock, a GUI plugin of PyMOL was built using the Python programming language. The Python script is located in the startup folder of PyMOL to allow for automatic load and display of the submenu
“PharmDock” (Figure 2) within the standard PyMOL
menubar. The plugin features the generation of ligand libraries by exporting all ligand objects present in a PyMOL session. A lexicon of exported libraries is stored and each library of compounds can later be modified, combined with other libraries, and imported for docking to different
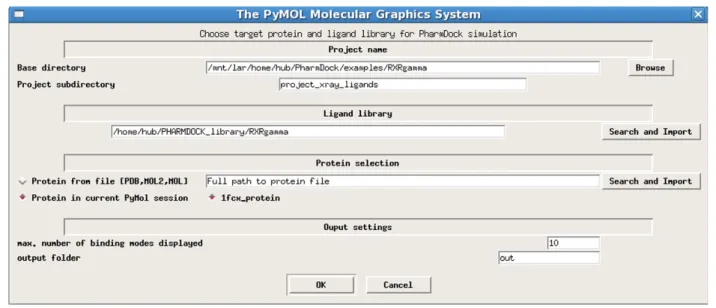
target proteins. The submenu“prepare system and start
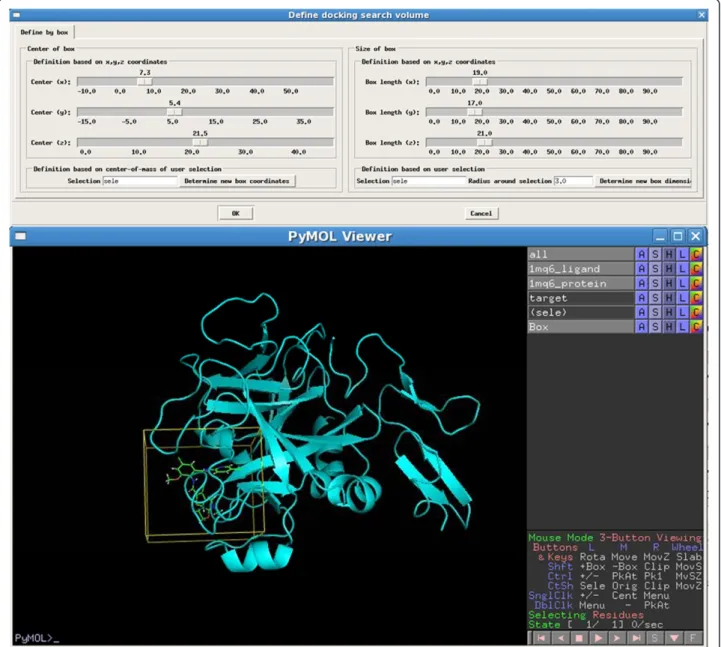
PharmDock”directs the user to select the target protein, import the ligand library, define the protein binding site and settings for the output of docking results (Figure 3). Users can define the docking search volume by visually adjusting the position and size of the box displayed in PyMOL (Figure 4).
The docking calculations are performed in the back-ground after submitting the job. The location of the dock-ing results is stored in a monitordock-ing file that allows the user to check the progress of the docking runs and re-import the docking results into PyMOL. All docking poses will be automatically displayed to the user with a separate
dialog displaying the docking solutions and associated docking scores.
In the default setting, PharmDock searches the ligand binding poses using all protein-based pharmacophores independent from information about known active li-gands. In this setting, docking results are not biased to-wards the chemical space of previously identified active ligands. However, it is possible that researchers would like to use previously acquired empirical knowledge about the target and identify compounds that can form specific interactions with certain region or specific residues of the binding pocket. To allow for inclusion of such informa-tion, we provide the users with the option to perform docking with PharmDock focusing on a set of selected pharmacophore elements (Figure 5). The GUI will allow users to load protein-based pharmacophore files and se-lect critical pharmacophores for protein-ligand binding. Two options are available to guide docking towards the selected pharmacophores: Confined docking, where the search volume will be confined to include only the se-lected pharmacophores; and constraint docking, where the generated docking poses must match at least one of the selected pharmacophores but the search volume is un-modified compared to the original unbiased docking. Con-fined docking is designed for the purpose of “confining” the docking poses within certain regions of the binding pocket and the confined region can be defined by using the known active ligands. Constraint docking is designed for identifying ligands or ligand poses that form interac-tions with specific residues within the binding site. Exam-ples for the two options will be shown in the“Results and Discussion”section.
Tests of PharmDock’s docking performance Cognate docking
The “core set”of the PDBbind [11,15] database (version 2007) was used to test PharmDock for its performance on ligand binding pose prediction and binding energy estima-tion. The PDBbind“core set”provides 210 protein-ligand complexes non-redundantly sampled from 1,300 protein-ligand complexes [15]. It covers 70 different proteins, each
of which contains three protein-ligand complexes with different binding affinities. All the protein-ligand com-plexes in the PDBbind core set were pre-processed with hydrogen atoms added and were therefore used directly without additional preparations. Due to various reasons, 20 protein-ligand complexes were excluded from the pose prediction and ranking study as described in our previous study [10].
The performance of PharmDock in ligand binding pose prediction was evaluated by its ability to reproduce the native-like pose for each protein-ligand complex in the PDBbind core set at the top-1 position. The top pose RMSD, i.e. the RMSD between the top-1 ranked pose to the native binding pose denoted as RMSDtop, was
calcu-lated. The average RMSDtop over the studied
protein-ligand complexes was reported to assess the overall sampling performance. In addition, the percentages of complexes that were successfully predicted with RMSDtop
within 1 Å, 2 Å and 3 Å to the native conformation were also used to evaluate the overall performance of pose generation and ranking. The correlation between
PharmDock’s predicted binding energies with the
ex-perimentally measured binding affinities was used to
evaluate PharmDock’s performance in binding energy
estimation. And finally, the success rate of PharmDock in ranking three ligands bound to the same protein ac-cording to their binding affinities was also calculated.
Virtual screening
The dictionary of useful decoys (DUD) [16] dataset was used to perform virtual screening (VS) studies. The DUD dataset contains 40 protein targets and a set of active and decoy ligands corresponding to each target. In the current
version of PharmDock, the parameters of ions and co-factors were not included. Therefore, the four metal-loenzymes, two folate enzymes and five other enzymes (aldose reductase, enoyl ACP reductase, glycogen
phos-phorylase β, purine nucleoside phosphorylase and
S-adenosyl-homocysteine hydrolase) were excluded in our VS experiment. For each protein structure in DUD, the side-chain conformations of ASN, GLN and HIS, and tautomers and protonation states of HIS were adjusted using the Reduce program [27]. The hydrogens were added to the protein using the tleap module of Amber 10 [28]. The protein-based pharmacophores and ligand conformations and pharmacophores were generated for each target following the methods described in“Generation
of Protein-based Pharmacophores” and “Generation of
Ligand Conformation and Pharmacophores”.
To analyze the VS results, the ligands for each protein system were ranked based on their predicted binding energies. The Receiver Operating Characteristic (ROC) curve displaying the fraction of ranked actives (true positive rate) at a given fraction of ranked decoys (false positive rate) was plotted for each VS run. The area-under-the-curve (AUC) was calculated for each ROC curve and used to assess the overall enrichment quality.
Results and discussion
Prediction of binding poses
many other docking studies [29,30] have shown that the input ligand conformations can have a significant influ-ence on the prediction of the binding poses. To assess the influence of the input ligand conformations on PharmDock, we performed two docking runs for each protein-ligand complex: one with the native conform-ation seeded within the low energy conformconform-ations of Omega (Native-Seeded) and one with only the low energy conformations (Omega-Only). In our previous study, we have presented pose prediction and ranking results using pharmacophore models without any local optimization of the binding poses or use of an atomistic scoring function. To demonstrate that the optimization process is effective in improving the docking power, we compared the pose
prediction and ranking results with and without the MC optimization. When the native conformer was used as docking input, the fraction of entries that have correctly
predicted poses (RMSD≤2 Å to the native binding pose)
optimization combined with PLP scoring function signifi-cantly improves the ability of PharmDock to identify the native binding pose of a ligand.
A detailed analysis of the distribution of the RMSD values between the top-1 ranked binding pose and the
X-ray binding pose (RMSDtop) for PharmDock with MC
optimization is shown in Figure 6B. When the native lig-and conformations were provided together with the low-energy conformations, PharmDock was able to predict
binding poses with RMSDtop≤1 Å for 45% of the tested
protein-ligand complexes. When the native ligand con-formations were excluded from the docking inputs, this number dropped to 20%. Obviously, the starting ligand conformations are critical for obtaining the correct docking solutions in PharmDock. As demonstrated in our previous study [10], Omega was not always able to sample ligand conformations within 1 Å RMSD to the
native ligand conformation. Under our current setting (see
“Generation of Ligand Conformation and Pharmacophore”
in Methods section), 67% ligands had at least one con-former generated within 1 Å RMSD to its native conform-ation. This lack of generating native ligand conformations with Omega for a significant fraction of the docked ligands was the major reason for the dramatic drop in the success rate after excluding the native conformation from the docking inputs.
We compared the performance of PharmDock in pre-dicting the ligand binding poses with the results of seven widely used docking programs evaluated by Plewczynski
et al. on the PDBbind refined set [31]. The average RMSDtop(avg RMSDtop) and the fraction of protein-ligand
complexes that have RMSDtop≤2 Å (%entries≤2 Å) are
shown in Table 1. When the native conformations were provided together with the low-energy conformations in Figure 5Illustration of PharmDock’s settings for confined or constraint docking.Pharmacophores can be visually selected with the PyMOL GUI.
Figure 6Prediction of binding poses by PharmDock. (A)Comparison between the docking performance of PharmDock with and without Monte Carlo (MC) optimization. The fraction of protein-ligand complexes that have at least one predicted pose within 2.0 Å RMSD to the native binding pose is displayed on the y-axis. The first two columns are the docking results using native conformer as the docking input. The last two columns are using the Omega-generated low-energy conformers as docking input.(B)Distribution of the RMSDtop. Native-Seeded: Docking was
docking, PharmDock was able to predict a correct binding
pose (RMSD≤2 Å) for 56% of the complexes with an
average RMSDtop of 2.9 Å. This result was among the
best of the compared docking programs. When the na-tive conformation was excluded from the docking input of PharmDock, the fraction of protein-ligand complexes with correctly predicted binding poses was significantly
reduced (37%). But taking the average RMSDtop into
consideration, the performances of PharmDock were still comparable to that of Glide and AutoDock, and better than LigandFit and FlexX.
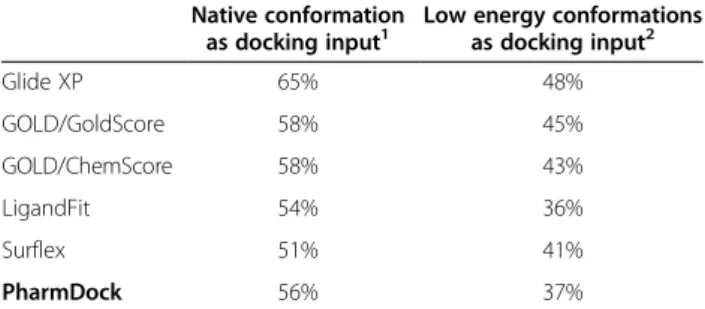
We recognized that the dataset used in our study was not exactly the same as used by Plewczynskiet al.. How-ever the“core set”we used was a subset non-redundantly sampled from the“refined set”used by Plewczynskiet al.. To further substantiate our comparison, we compared PharmDock with four docking programs (Glide, GOLD,
LigandFit and Surflex) evaluated by Li et al. on the
PDBbind core set [29]. As shown in Table 2, when the na-tive ligand conformers were provided in the docking in-puts, PharmDock was still among the best of the studied docking programs. When only the low energy conformers were provided, PharmDock performed comparably to Sur-flex and LigandFit. This is consistent with the previous comparison against Plewczynskiet al.’s study.
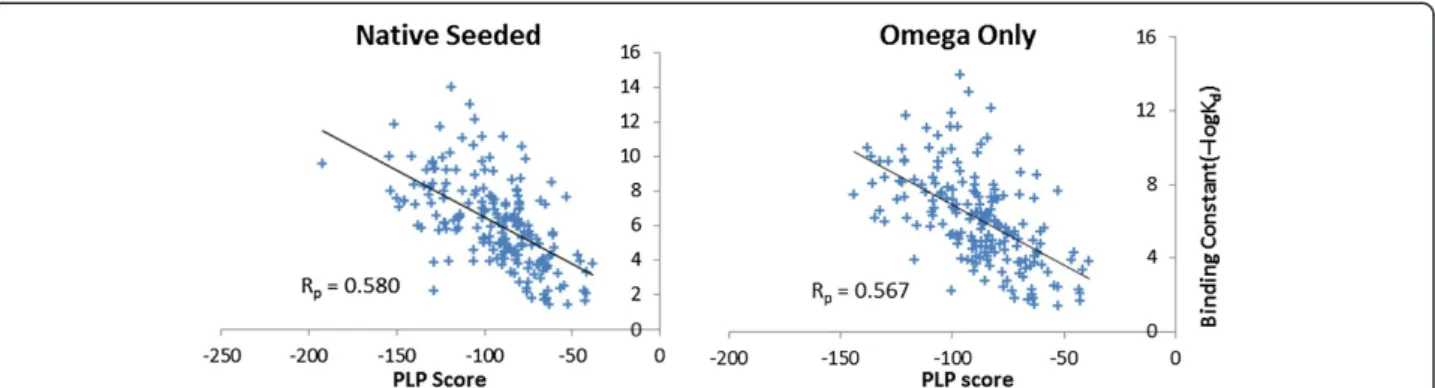
Prediction of binding affinities
Another important evaluation of the docking program is how well the predicted binding energies correlate with
the experimentally measured binding affinities. Experi-mentally measured binding affinities are available for all protein-ligand complexes provided in the PDBbind data-base. Figure 7 shows the correlations between the experi-mentally measured binding constants (in –log Kd units)
and the predicted binding scores by PharmDock for all tested protein-ligand complexes. The Pearson correlation coefficients (Rp) were 0.580 and 0.567 for the docking
cal-culations based on native-seeded and omega-only input conformations, respectively. Previously, Cheng et al. [26] have performed a comparative study on 16 widely-used scoring functions using the PDBbind core set. They used these scoring functions to estimate the binding affinities of the protein-ligand complex structures as obtained from the X-ray experiments; thus, no pose sampling was per-formed removing the uncertainty typically generated in this step of standard docking protocols. The correlations between the predicted binding scores of individual scoring function and the experimentally measured binding affin-ities range from 0.644 to 0.216. The top three best
corre-lations were obtained by X-score with Rp of 0.644,
DrugScore with Rpof 0.569 and ChemScore with Rpof
0.555. Using PLP scoring function on the X-ray
protein-ligand complexes an Rp of 0.545 was obtained. It is
worth noting that the X-ray protein-ligand structures
were used in Cheng et al.’s study whereas the top-1
ranked poses from PharmDock were used in our study for computing the binding scores. Despite the additional uncertainty in generating native poses in our study, a
higherRp(in both native-seeded and omega-only cases)
was obtained compared to the study from Chenget al.’s using the same PLP scoring function. One other signifi-cant difference between using PharmDock generated ligand poses and the crystal ligand poses is that in our study PharmDock MC optimization were performed to locally optimize the binding poses according to the PLP Table 1 Comparison of PharmDock with docking
programs evaluated by Plewczynskiet al.
Native conformation as docking input1
Omega conformations as docking input2 avg
RMSDtop(Å)
%entries≤ 2 Å
avg RMSDtop(Å)
%entries≤ 2 Å
Surflex 3.2 52% 3.1 51%
GOLD 2.8 55% 2.4 63%
eHiTs N/A N/A 2.6 58%
Glide SP 3.3 52% 3.7 43%
AutoDock 2.3 56% 4.0 41%
LigandFit 3.2 48% 4.4 33%
FlexX 4.2 41% 4.3 37%
PharmDock 2.9 56% 3.9 37%
Avg RMSDtop: RMSDtopaveraged over all the tested complexes. %entries≤2 Å:
the fraction of complexes with RMSDtop≤2 Å. The results for the seven
docking programs in comparison were extracted from Plewczynskiet al.’s study [31].1
In Plewczynskiet al.’s study, only the native ligand conformation is provided. In PharmDock simulations, the native ligand conformation is seeded within the Omega-generated low energy conformations, because PharmDock does not generate ligand conformations on-the-fly during pose sampling. Conformations are further modified during pose optimization. All other docking programs take the input ligand conformation and re-generate multiple ligand conformations during the search process.2
Plewczynskiet al. generated ten low-energy conformers per ligand using Omega for their study.
Table 2 Comparison of PharmDock with docking
programs evaluated by Liet al.
Native conformation as docking input1
Low energy conformations as docking input2
Glide XP 65% 48%
GOLD/GoldScore 58% 45%
GOLD/ChemScore 58% 43%
LigandFit 54% 36%
Surflex 51% 41%
PharmDock 56% 37%
Fraction of protein-ligand complexes with RMSDtop≤2 Å for PharmDock in
comparison with the four docking programs evaluated by Liet al. [29].1
Similar as in Table1, the result using PharmDock is shown for omega-generated conformations seeded with native conformation as input, whereas the results extracted from Liet al.’sstudy only take the native conformation as docking input.2
scoring function. Therefore, our results suggest that an
in situoptimization with the final scoring function may be beneficial for reducing possible steric clashes in the original crystal structure and optimizing the beneficiary protein-ligand contacts.
The PDBbind “core set” contains three protein-ligand complexes for each protein target. We studied if Pharm-Dock is able to correctly rank the three different ligands bound to the same protein according to their binding af-finities. There are 70 different proteins in the original PDBbind core set. After removal of the 20 complexes, as described before, 55 proteins remained that still had three different complexes available for our ranking study. For 42% of these 55 protein targets in both native-seeded and omega-only cases PharmDock was able to correctly rank the three ligands according to their binding affinities. Ac-cording to the results reported by Chenget al., when the original crystal complex structures are used for estimating the binding energies, the highest success rate of ranking the ligands for the same protein target was 58.5%. Our 42% success rate ranks at the 9thposition compared to the
16 scoring functions tested by Cheng et al.. However,
we need to mention again, that the top ranked docking poses rather than the X-ray conformations were used in our case, where the former is more complicated than the latter approach, as additional uncertainties are in-troduced throughout the pose sampling stage. Therefore a firm conclusion cannot be drawn directly from this comparison. However, combined with the comparable high correlation coefficients between the PharmDock predicted binding energies and the experimentally mea-sured binding affinities, this result suggests that a good prediction in the overall correlation does not guarantee a good ranking power for the ligands bound with the same protein. A scoring function specifically developed for ranking the ligands bound to the same protein might be necessary for improving the performance of PharmDock in such studies.
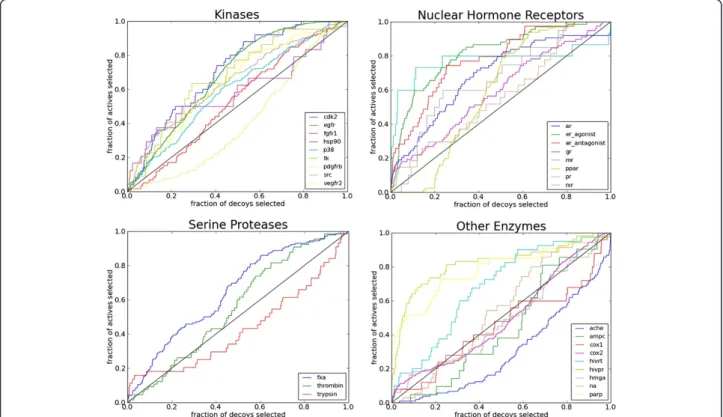
Virtual screening experiment
The performance of PharmDock in retrieving active compounds from a virtual compound library was evalu-ated against 29 targets from the DUD data set. For each
target, the “own decoy” set was used, which includes
only decoys with physical properties similar to the native ligands. The overall virtual screening performance was evaluated by calculating the area-under-the-curve (AUC) value of the ROC curve plotted for each target system (Figure 8). In general, PharmDock provides an AUC above random for 22 out of the 29 tested targets. The average AUC among all the tested targets is 0.61. This value is com-parable to those reported by Crosset al. [32] on the virtual screening performance of six docking programs (Figure 9). When breaking down our VS results into different protein families, PharmDock provides an average AUC of 0.61, 0.69 and 0.55 for kinases, nuclear hormone receptors (NHRs)
and serine proteases respectively. PharmDock’s
per-formance on kinases and NHRs are among the best in comparison with the other docking programs. Serine pro-teases turned out to be a difficult system for PharmDock. One possible reason for the rather weak performance of PharmDock on the serine proteases could be the neglect of solvation effects in the scoring function. Re-cent studies [33] on serine proteases suggest that the inclusion of explicit solvent effects is necessary to explain the structure-activity relationships of serine protease in-hibitors. Therefore, a more sophisticated scoring function might be required to improve the performance of Pharm-Dock on serine protease targets.
Confined and constraint docking with PharmDock
To guarantee easy use of PharmDock, a PyMOL GUI was developed as described in the“Implementation” sec-tion. Besides the basic docking settings, the plugin also provides the user with the option to restrict docking to selections of the protein-based pharmacophores in order to concentrate the docking search volume to certain Figure 7Correlations between the experimentally measured binding constants of the protein-ligand complexes and the PharmDock-predicted binding scores.The experimentally measured binding constants were shown in–log Kdunits.Left. Correlations between the binding
constants and the predicted binding scores when native conformers were provided together with low-energy conformers as input for docking.
regions of the binding site. We termed this docking protocol as“confined docking”. Alternatively, the user can choose to utilize the“constraint docking”option, where at least one ligand pharmacophore of an accepted docking pose has to match with the user-selected pharmacophore elements. This option allows to enforce certain interac-tions that are critical for ligand binding to the target
protein of interest. Typically, all pharmacophore elements of a property such as hydrogen-bonding are treated equally in the scoring function. The physicochemical en-vironment of the hydrogen-bonding group or desolvation effects, however, can significantly alter the strength of a hydrogen bond [34]. Pharmacophores derived from an analysis of existing protein–ligand structures or previously identified active compounds can be used to differentiate between important and weak hydrogen bonds. The phar-macophores can be incorporated as constraints into dock-ing, thus binding modes that do not match any of the selected pharmacophores will be discarded. To demon-strate how these two novel docking features can benefit the docking performance, examples of using the confined and constraint docking are shown in this section.
To demonstrate the potential of confined docking, we chose the inhibitor 3-chloro-N-[4-chloro-2-[[(5-chloro-2-pyridinyl)amino]carbonyl]-6-methoxyphenyl]-4-[[(4, 5-dihydro-2-oxazolyl)methylamino]methyl]-2-thiophe-necarboxamide complexed with human factor Xa (PDB-code: 1MQ6) as an example. Unbiased docking to all protein-based pharmacophores identified for factor Xa Figure 8ROC plots for 29 tested targets from the DUD dataset.Diagonal line on each figure indicates the random performance. Enzyme abbreviations: AChE, acetylcholinesterase; AmpC, AmpCβ-lactamase; AR, androgen receptor; CDK2, cyclindependent kinase 2; COX-1, cyclooxygenase-1; COX-2, cyclooxygenase-2; DHFR, dihydrofolate reductase; EGFr, epidermal growth factor receptor; ER, estrogen receptor; FGFr1, fibroblast growth factor receptor kinase; FXa, factor Xa; GR, glucocorticoid receptor; HIVPR, HIV protease; HIVRT, HIV reverse transcriptase; HMGR, hydroxymethylglutaryl-CoA reductase; HSP90, human heat shock protein 90; MR, mineralocorticoid receptor; NA, neuraminidase; P38 MAP, P38 mitogen activated protein; PARP, poly(ADP-ribose) polymerase; PDGFrb, platelet derived growth factor receptor kinase; PPARg, peroxisome proliferator activated receptorγ; PR, progesterone receptor; RXRa, retinoic X receptorα; SRC, tyrosine kinase SRC; TK, thymidine kinase; VEGFr2, vascular endothelial growth factor receptor.
(fXa) (Figure 10A) resulted in the predicted docking pose which significantly deviates (RMSD = 7.7 Å) from the na-tive pose. When several known factor Xa inhibitors were overlaid within the protein binding site, we found that they all bind within the groove formed by the S1 and S4 sub-pocket of fXa (Figure 10B). Based on this observation, only the pharmacophores within such groove were se-lected for confined docking simulation (Figure 10B). Using omega-generated conformers as input for confined dock-ing the ligand of the 1MQ6 X-ray structure was accurately reproducing the native pose of this ligand with a 1.8 Å RMSD to the X-ray pose (Figure 10C).
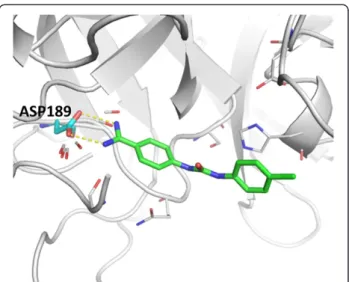
In the virtual screening experiment, serine proteases turned out to be a difficult protein family for PharmDock with lower AUC values compared to the other docking programs (Figure 9). Among the serine proteases, trypsin only achieved an AUC value of 0.43. The aspartate residue (Asp189 in Figure 11) located in the active site of trypsin forms a specificity pocket that is responsible for attracting and stabilizing positively charged lysine or arginine side-chains in endogenous substrates. Non-covalent trypsin inhibitors with amidinophenyl moiety are also found to form stable hydrogen bonds with Asp189 [35,36] (Figure 11). Therefore, we hypothesized that a constraint docking simulation that requires interactions with residue Asp189 will lead to improved virtual screening results. To test this idea, we selected the six hydrogen bonding phar-macophores identified around the carboxylic acid group of Asp189. The selected pharmacophores represent the fa-vorable locations for potential ligands to form hydrogen bonds with Asp189 (Figure 11). Re-running PharmDock using the constraint docking setting resulted in a signifi-cant increase in enrichment compared to the unbiased docking simulation, supported by an increase of the AUC from 0.43 for unbiased to 0.54 for constraint virtual screening.
Conclusions
Starting from pre-generated ligand and protein-based pharmacophores, we extended our pharmacophore-based pose sampling and ranking into a docking program, named
PharmDock. PharmDock’s performance in ligand binding
pose prediction and binding energy estimation was tested using the PDBbind core set. We found that the presence of the native ligand conformation greatly influenced Pharm-Dock’s performance in pose prediction: when native ligand conformation was provided together with the low energy
Figure 10Example of results obtained by confined docking protocol. (A)All protein-based pharmacophores identified based on protein structure of factor Xa (PDB: 1MQ6) without inclusion of information about known active ligands. The protein surface is colored as grey. Protein-based pharmacophores are shown as lines for hydrogen bond donor/acceptor and small green spheres for hydrophobic elements.(B)A subset of the protein-based pharmacophores selected from(A)with the consideration of three known active ligands. The X-ray binding poses of known ligands are shown in stick representation.(C)Ligand binding poses predicted by PharmDock for co-crystallized ligand in PDB structure 1MQ6. Orange: Ligand binding pose predicted in the unbiased docking setting with all identified protein-based pharmacophores. Green: Ligand binding pose predicted with the selected pharmacophores showing excellent agreement (1.8 Å RMSD) with the X-ray pose (yellow ligand inB).
conformations in docking, PharmDock was able to repro-duce the native binding pose within an RMSDtop≤2 Å for
56% of the protein-ligand complexes. This success rate dropped to 37% when the native ligand conformation is ex-cluded from the docking inputs. Interestingly, the influence of the native ligand conformation was not that dramatic for binding energy estimation. Linear correlations between the predicted binding scores and the experimentally mea-sured binding affinities were observed. The Pearson correl-ation coefficient of 0.580 and 0.567 were reached with and without the presence of native ligand conformations in the docking input.
We also measured PharmDock’s ability in ranking dif-ferent ligands bound to the same protein according to their binding affinities. This test is directly related to the virtual screening study where the rankings rather than the absolute binding energies are critical to distinguish potentially active ligands from decoys. PharmDock was able to correctly rank the ligands bound to the same protein according to their binding affinities for 42% of the tested proteins. Subsequent test of PharmDock in virtual screening on 29 targets of DUD dataset yielded an average AUC of 0.61. Dependent on the size of protein binding site and ligand molecule, the required computa-tion time needed to dock one ligand using PharmDock varies between 0.5 and 7 min for the DUD dataset on a single core of a 2.5 GHz Quad Core AMD2380 computer. The average time required for docking was about 2.7 min per ligand.
Many docking programs have been developed since the establishment of the computer-aided molecular design field. While we understand that due to many influencing factors a fair comparison between different docking programs is quite difficult [37], we chose to compare PharmDock with several widely used docking programs evaluated by
other studies so we can better understand PharmDock’s
weaknesses and strengths. Using a simple empirical
scoring function, PLP, PharmDock’s performances in
binding pose prediction and binding energy estimation were comparable to or better than many widely used docking programs. Whereas PharmDock provided a high Pearson correlation coefficient between the estimated binding energy and experimentally measured binding af-finities compared to other programs, the overall binding affinity prediction is still not accurate enough for drug optimization purposes. This difficulty in predicting bind-ing affinities is also reflected in its mediocre performances in ranking ligands bound to the same protein and of vir-tual screening experiments, although comparable to other available docking methods. A more sophisticated scoring
function is still necessary for improving PharmDock’s
performance for separating physically similar ligands with distinct biological affinity. Furthermore, the com-parison between the Native-Seeded and Omega-Only
results also indicates that a better sampling of the ligand conformations, in particular for large, flexible ligands
would improve PharmDock’s performance for this class
of compounds. Last but not least, it has also been shown that the inclusion of protein flexibility and dynamics using the“ligand model concept”recently developed in our group can significantly improve the enrichment of virtual screen-ing experiment [38]. Future version of PharmDock will be combined with this“ligand model concept”to take protein flexibility and dynamics into consideration.
To make PharmDock accessible to any researcher in the field of biological and medicinal chemistry, we devel-oped an open access PyMOl GUI for PharmDock. Both PharmDock and the PyMOl GUI can be downloaded from http://people.pharmacy.purdue.edu/~mlill/software/ pharmdock. Two new features, confined docking and con-straint docking, were built into the GUI. The idea is to provide users with the flexibility to include their expert knowledge about the target protein into the docking simu-lations. Two examples of these features demonstrated their usefulness in binding pose prediction and virtual screening.
Availability and requirements
Project name: PharmDock
Project home page: http://people.pharmacy.purdue. edu/~mlill/software/pharmdock
Operating system(s): Linux Programming language: C, Python
Other requirements: OpenEye Omega (version 2.2.0 or newer), Python (version 2.4 or newer), Scipy, Numpy, OpenBabel (with Python bindings), PyMOL (tested on version 1.1r1 and 1.5.0)
License: GNU GPL v3
Any restrictions to use by non-academics: None
Competing interests
The authors declare that they have no competing interests.
Author’s contributions
BH developed PharmDock and PharmDock plugin, prepared the data sets, tested PharmDock, and drafted the manuscript. MAL participated in the development of PharmDock and PharmDock plugin, the discussion of the results, and helped to draft the manuscript. Both authors read and approved the final manuscript.
Acknowledgements
M.A.L. thanks the National Institutes of Health (GM092855) for funding the present research.
Received: 20 January 2014 Accepted: 4 April 2014 Published: 16 April 2014
References
2. Barnum D, Greene J, Smellie A, Sprague P:Identification of common functional configurations among molecules.J Chem Inf Comput Sci1996,
36:563–571.
3. Dixon SL, Smondyrev AM, Knoll EH, Rao SN, Shaw DE, Friesner RA:PHASE: a new engine for pharmacophore perception, 3D QSAR model
development, and 3D database screening: 1. Methodology and preliminary results.J Comput Aided Mol Des2006,20:647–671.
4. Richmond NJ, Abrams CA, Wolohan PRN, Abrahamian E, Willett P, Clark RD:
GALAHAD: 1. Pharmacophore identification by hypermolecular alignment of ligands in 3D.J Comput Aided Mol Des2006,20:567–587. 5. Chen X, Rusinko A III, Tropsha A, Young SS:Automated pharmacophore
identification for large chemical data sets 1.J Chem Inf Comput Sci1999,
39:887–896.
6. Kirchhoff PD, Brown R, Kahn S, Waldman M, Venkatachalam C:Application of structure‐based focusing to the estrogen receptor.J Comput Chem
2001,22:993–1003.
7. Barillari C, Marcou G, Rognan D:Hot-spots-guided receptor-based pharmacophores (HS-Pharm): a knowledge-based approach to identify ligand-anchoring atoms in protein cavities and prioritize structure-based pharmacophores.J Chem Inf Model2008,48:1396–1410.
8. Tintori C, Corradi V, Magnani M, Manetti F, Botta M:Targets looking for drugs: A multistep computational protocol for the development of structure-based pharmacophores and their applications for hit discovery. J Chem Inf Model2008,48:2166–2179.
9. Cross S, Cruciani G:Grid-derived structure-based 3D pharmacophores and their performance compared to docking.Drug Discov Today Technol2011,
7:e213–e219.
10. Hu B, Lill MA:Exploring the potential of protein-based pharmacophore models in ligand pose prediction and ranking.J Chem Inf Model2013,
53:1179–1190.
11. Wang R, Fang X, Lu Y, Yang CY, Wang S:The PDBbind database: methodologies and updates.J Med Chem2005,48:4111–4119. 12. OpenEye Scientific Software.Santa Fe N, USA:. www.eyesopen.com: OMEGA:
version 2.2.0.
13. Hawkins PCD, Skillman AG, Warren GL, Ellingson BA, Stahl MT:Conformer generation with OMEGA: algorithm and validation using high quality structures from the Protein Databank and Cambridge Structural Database.J Chem Inf Model2010,50:572–584.
14. Hawkins PCD, Nicholls A:Conformer generation with OMEGA: learning from the dataset and the analysis of failures.J Chem Inf Model2012,
52:2919–2936.
15. Wang R, Fang X, Lu Y, Wang S:The PDBbind database: collection of binding affinities for protein-ligand complexes with known three-dimensional structures.J Med Chem2004,47:2977–2980.
16. Huang N, Shoichet BK, Irwin JJ:Benchmarking sets for molecular docking. J Med Chem2006,49:6789–6801.
17. DeLano WL:The PyMOL Molecular Graphics System.San Carlos CA, USA: DeLano Scientific; 2002.
18. The PyMOL Molecular Graphics System, Volume Version 1.1r1. Schrödinger: LLC; http://www.pymol.org/citing.
19. Eldridge MD, Murray CW, Auton TR, Paolini GV, Mee RP:Empirical scoring functions: I. The development of a fast empirical scoring function to estimate the binding affinity of ligands in receptor complexes.J Comput Aided Mol Des1997,11:425–445.
20. Baxter CA, Murray CW, Clark DE, Westhead DR, Eldridge MD:Flexible docking using tabu search and an empirical estimate of binding affinity. Proteins: Struct, Funct, Bioinf1998,33:367–382.
21. Bron C, Kerbosch J:Algorithm 457: finding all cliques of an undirected graph.Commun ACM1973,16:575–577.
22. Harley ER:Graph algorithms for assembling integrated genome maps.
University of Toronto; 2003.
23. Kabsch W:A solution for the best rotation to relate two sets of vectors. Acta Crystallogr A1976,32:922–923.
24. Metropolis N, Rosenbluth AW, Rosenbluth MN, Teller AH, Teller E:Equation of state calculations by fast computing machines.J Chem Phys1953,
21:1087.
25. Gehlhaar DK, Verkhivker GM, Rejto PA, Sherman CJ, Fogel DB, Fogel LJ, Freer ST:
Molecular recognition of the inhibitor AG-1343 by HIV-1 protease: conformationally flexible docking by evolutionary programming. Chem Biol1995,2:317–324.
26. Cheng T, Li X, Li Y, Liu Z, Wang R:Comparative assessment of scoring functions on a diverse test set.J Chem Inf Model2009,49:1079–1093. 27. Word J, Lovell S, Richardson J, Richardson D:Asparagine and glutamine:
using hydrogen atom contacts in the choice of side-chain amide orientation1.J Mol Biol1999,285:1735–1747.
28. Case DA, Darden TA, Cheatham TE, Simmerling CL, Wang J, Duke RE, Luo R, Crowley M, Walker RC, Zhang W, Merz KM, Wang B, Hayik S, Roitberg A, Seabra G, Kolossváry I, Wong KF, Paesani F, Vanicek J, Wu X, Brozell SR, Steinbrecher T, Gohlke H, Yang L, Tan C, Mongan J, Hornak V, Cui G, Mathews DH, Seetin MG,et al:AMBER 10.San Francisco: University of California; 2008.
29. Li X, Li Y, Cheng T, Liu Z, Wang R:Evaluation of the performance of four molecular docking programs on a diverse set of protein-ligand complexes. J Comput Chem2010,31:2109–2125.
30. Kellenberger E, Rodrigo J, Muller P, Rognan D:Comparative evaluation of eight docking tools for docking and virtual screening accuracy.Proteins
2004,57:225–242.
31. Plewczynski D,Łaźniewski M, Augustyniak R, Ginalski K:Can we trust docking results? Evaluation of seven commonly used programs on PDBbind database.J Comput Chem2011,32:742–755.
32. Cross JB, Thompson DC, Rai BK, Baber JC, Fan KY, Hu Y, Humblet C:
Comparison of several molecular docking programs: pose prediction and virtual screening accuracy.J Chem Inf Model2009,49:1455–1474. 33. Abel R, Salam NK, Shelley J, Farid R, Friesner RA, Sherman W:Contribution
of explicit solvent effects to the binding affinity of small‐molecule inhibitors in blood coagulation factor serine proteases.Chemmedchem
2011,6:1049–1066.
34. Smith R, Hubbard RE, Gschwend DA, Leach AR, Good AC:Analysis and optimization of structure-based virtual screening protocols: (3). New methods and old problems in scoring function design.J Mol Graph Model
2003,22:41–53.
35. Presnell SR, Patil GS, Mura C, Jude KM, Conley JM, Bertrand JA, Kam C-M, Powers JC, Williams LD:Oxyanion-mediated inhibition of serine proteases. Biochemistry (Mosc)1998,37:17068–17081.
36. Sherawat M, Kaur P, Perbandt M, Betzel C, Slusarchyk WA, Bisacchi GS, Chang C, Jacobson BL, Einspahr HM, Singh TP:Structure of the complex of trypsin with a highly potent synthetic inhibitor at 0.97 A resolution.Acta Crystallogr Sect D: Biol Crystallogr2007,63:500–507.
37. Cole JC, Murray CW, Nissink JWM, Taylor RD, Taylor R:Comparing protein– ligand docking programs is difficult.Proteins: Struct, Funct, Bioinf2005,
60:325–332.
38. Xu M, Lill MA:Significant enhancement of docking sensitivity using implicit ligand sampling.J Chem Inf Model2011,51:693–706.
doi:10.1186/1758-2946-6-14
Cite this article as:Hu and Lill:PharmDock: a pharmacophore-based docking program.Journal of Cheminformatics20146:14.
Open access provides opportunities to our colleagues in other parts of the globe, by allowing
anyone to view the content free of charge.
Publish with
Chemistry
Central and every
scientist can read your work free of charge
W. Jeffery Hurst, The Hershey Company.
available free of charge to the entire scientific community peer reviewed and published immediately upon acceptance cited in PubMed and archived on PubMed Central yours you keep the copyright
Submit your manuscript here: