THE USE OF AGRICULTURAL LAND IN VÂLCEA COUNTY
(2009-2011)
MEDELETE D.M., PÂNZARU R.L. Faculty of Agronomy, University of Craiova
Key words: agricultural non-agricultural, arable, pasture, hay, fruit tree plantation, vineyard
ABSTRACT
The land represents land capital. Traditionally, of the capital land belong the things that are incorporated to them: buildings, land amelioration (roads, drainage facilities and facilities for irrigation, drainage) and plantations. Earth does not wear out and therefore are not amortized, unlike other elements of capital land, especially amelioration and plantations, which deteriorate through use and so must be written to be renewed. Based on these considerations, in the modern optics, buildings, land amelioration and plantations are considered operating capital. Capital determines land through their specific economic potential of agricultural holdings.
INTRODUCTION
Directions to efficiently use the land as the main production address the following topics:
a. removing wasteful phenomenon and complete use of farmlandbased on the natural and economic data through: the territory organization and systematization of rural communities; the land management on farms on sole or plots in order to create conditions for practicing rational agriculture; optimization of the crop having a main restriction full use of agricultural areas and aim to increase economic efficiency by maximizing profits.
b. reducing the degradation process of quality farmland. It involves the expansion and efficient use of land amelioration works. Of these particular importance presents: irrigation; works of preventing and combating soil erosion; dams and drainage works; improving sands and sandy soils; Salty soil improvement.
c. increasing the fertility of agricultural land through appropriate measures (is based on generalization in practice the most advanced cultivation technology. Within the culture technologies, links with the greatest effect on improving the quality of land are: correcting soil reaction, fertilization and crop maintenance).
METHOD AND MATERIAL
Preparation of the study called for comparison method in time and space. Besides temporal sequences included in the analysis, was worked with their average.
For the present study, were determined and interpreted after recommended methodology, the following indicators: the land usage - presentation of areas on categories; structure of cultivated arable area; share (In) cultivated area (Sn) of the total arable area (Sa); weight (Ii) of intensive crops (Sci) of the total arable area; degree of intensity of agricultural land use.
RESULTS AND DISCUSSIONS
Data on land use in Valcea County during 2009-2011, the structure of land usage mode and reporting to the South - West Oltenia area, are shown in the Table 1.
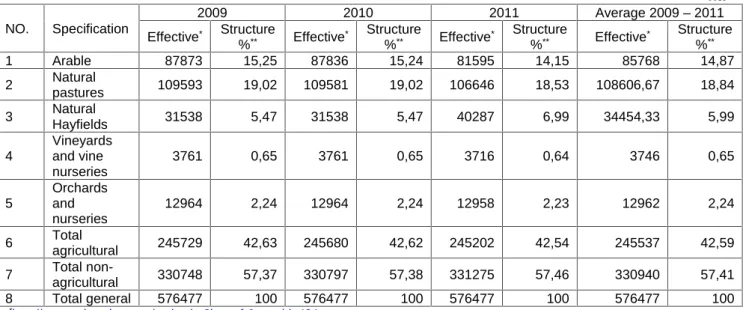
Table 1. VÂLCEA COUNTY
Mode of usage the land – STRUCTURE 2009 – 2011
-ha-NO. Specification
2009 2010 2011 Average 2009 – 2011
Effective* Structure
%** Effective*
Structure
%** Effective*
Structure
%** Effective*
Structure %**
1 Arable 87873 15,25 87836 15,24 81595 14,15 85768 14,87
2 Natural
pastures 109593 19,02 109581 19,02 106646 18,53 108606,67 18,84
3 Natural
Hayfields 31538 5,47 31538 5,47 40287 6,99 34454,33 5,99
4
Vineyards and vine nurseries
3761 0,65 3761 0,65 3716 0,64 3746 0,65
5
Orchards and nurseries
12964 2,24 12964 2,24 12958 2,23 12962 2,24
6 Total
agricultural 245729 42,63 245680 42,62 245202 42,54 245537 42,59
7 Total
non-agricultural 330748 57,37 330797 57,38 331275 57,46 330940 57,41
8 Total general 576477 100 576477 100 576477 100 576477 100
*http://www.valcea.insse.ro/main.php?lang=fr&pageid=484 **own calculation
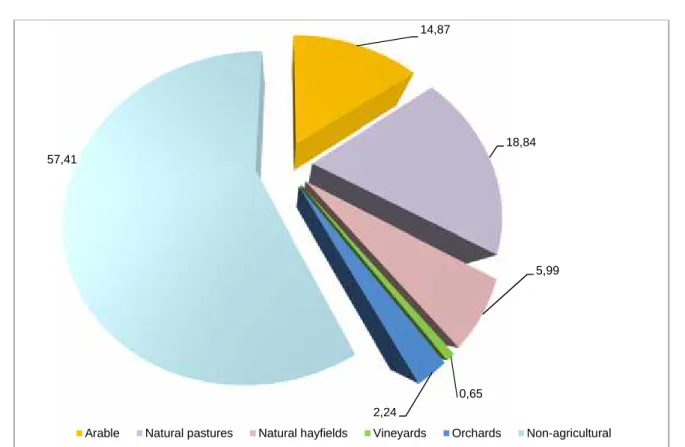
In 2009, there is a general total of 576 477 ha, of which agricultural land has represented 42.63% (245729 ha) while non-agricultural land owned 57.37% of the total (330748 ha). Compared to the total, land-use categories have held shares as follows: 0.65% vines and vine nurseries - 3769 ha, 2.24% orchards and nurseries - 12964 ha natural grassland 5.47% - 31 538 ha, 15.25% arable land - 87,873 hectares and 19.02% natural pastures - 109593 ha.
The year 2010 registered a 245680 ha of agricultural land - 42.62% in the structure, and a non-agricultural area of 330797 ha - 57.38% of the total. By category of use, the agricultural land surface records: 109581 ha for natural pastures - 19.02% from the total, 87836 hectares of arable land - 15.24% 31538 ha hayfields - 5.47% 12964 ha orchards and nurseries - 2.24%, 3761 ha vineyards and vine nurseries - 0.65%.
For 2011 it appears that agricultural land has represented 42.54% of the total (245202 ha) and non-agricultural land has reached a level of 57.46% (331275 ha). In ascending order, agricultural land use categories held areas: 3716 ha vineyards and vine nurseries - 0.64% of the total, 12,958 ha orchards and nurseries - 2.23% 40287 ha natural grassland 6.99%, 81595 ha of arable land 14.15% and 106646 ha natural grassland -18.53%.
Fig. 1. Vâlcea County - Mode of land utilization Average 2009-2011
Table 2. Shows the share of Vâlcea County from region, in terms of contribution to the achievement of specific indicators levels.
Table 2. VÂLCEA COUNTY
Mode of land utilization – Share from region*
2009 – 2011
-%-No.
Specification 2009 2010 2011 Average 2009 –
2011
1 Arable 7,01 7,02 6,55 6,86
2 Natural pastures 28,84 28,91 28,28 28,68
3 Natural hayfields 35,84 36,04 41,61 37,96
4 Vineyards and vine nurseries
9,60 9,54 9,71 9,62
5 Orchards and nurseries 30,02 30,84 32,07 30,95
6 Total agricultural 13,63 13,65 13,64 13,64
7 Total non-agricultural 29,58 29,48 29,49 29,52
8 Total general 19,73 19,73 19,73 19,73
*own calculation
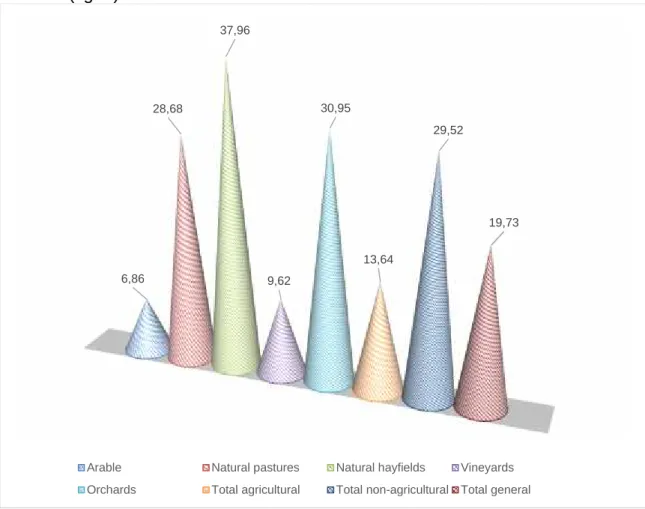
The arable land had weights from 6.55% in 2011 to 7.02% in 2010, which led to an average share of 6.86%.
For natural grassland average share reached 28.68%, due to annual contributions of 28.84, 28.91 and 28.28% specific to years 2009, 2010 and 2011.
For natural meadows, are noted the limits of 35.84% for 2009 and 41.61% in 2011,
14,87
18,84
5,99
0,65 2,24
57,41
If we analyze the situation of viticultural patrimony, there is an average share of 9.62%, a level that is based on the 9.54% sequential contributions in 2010, 9.60% for 2009 and respectively 9.71% for 2011.
Orchards patrimony is characterized by variable share from 30.02% in 2009 to 32.07% for 2011. In these circumstances, period average recording a share of 30.95%.
In terms of agricultural land, Vâlcea represented 13.64% of the region's potential, with sequential values of 13.63% in 2009, 13.64% and 13.65% in 2011 for 2010.
In terms of non-agricultural area, there is an average contribution of 29.52%, resulting from annual sequential levels 29.48, 29.49 and 29.58% in 2010, 2011 and respectively 2009.
The weight of Valcea County, at regional level, from area ratio point of view was 19.73% total (fig. 2).
Fig. 2. Vâlcea County - Mode of use land - regional share Average 2009-2011
Setting up the arable county structure was made taking into account the following crop groups: grains (wheat and rye, barley, maize), oil plants - in which sunflower, potatoes, vegetables and other crops, area under cultivation and uncultivated land - table 3.
6,86 28,68
37,96
9,62
30,95
13,64
29,52
19,73
Arable Natural pastures Natural hayfields Vineyards
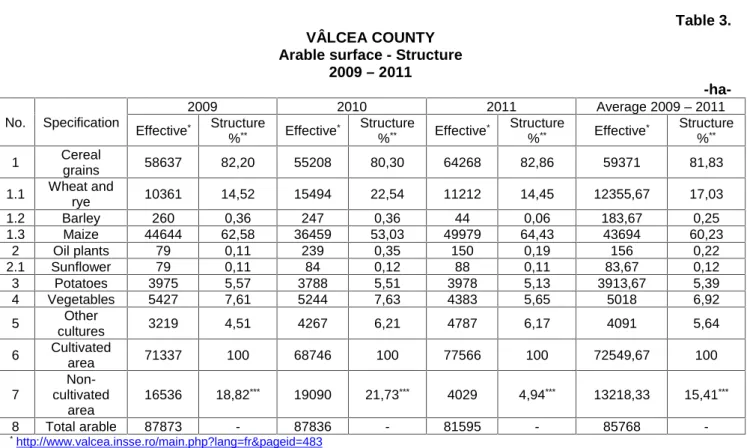
Table 3. VÂLCEA COUNTY
Arable surface - Structure 2009 – 2011
-ha-No. Specification
2009 2010 2011 Average 2009 – 2011
Effective* Structure
%** Effective*
Structure
%** Effective*
Structure
%** Effective*
Structure %**
1 Cereal
grains 58637 82,20 55208 80,30 64268 82,86 59371 81,83
1.1 Wheat and
rye 10361 14,52 15494 22,54 11212 14,45 12355,67 17,03
1.2 Barley 260 0,36 247 0,36 44 0,06 183,67 0,25
1.3 Maize 44644 62,58 36459 53,03 49979 64,43 43694 60,23
2 Oil plants 79 0,11 239 0,35 150 0,19 156 0,22
2.1 Sunflower 79 0,11 84 0,12 88 0,11 83,67 0,12
3 Potatoes 3975 5,57 3788 5,51 3978 5,13 3913,67 5,39
4 Vegetables 5427 7,61 5244 7,63 4383 5,65 5018 6,92
5 Other
cultures 3219 4,51 4267 6,21 4787 6,17 4091 5,64
6 Cultivated
area 71337 100 68746 100 77566 100 72549,67 100
7
Non-cultivated
area
16536 18,82*** 19090 21,73*** 4029 4,94*** 13218,33 15,41***
8 Total arable 87873 - 87836 - 81595 - 85768
-*http://www.valcea.insse.ro/main.php?lang=fr&pageid=483 **own calculation
***share of total arable
The year 2009 is characterized by a total area of 87873 ha arable land, which was cultivated in a share of 81.18% 71337 ha, 18.82%represented the uncultivated land -16536 ha. Main crops group was represented by cereals grains - 58637 ha (82.80%), followed by vegetables 5247 ha (7.61%), potatoes 3975 ha (5.57%), other cultures -3219 ha (4.51%) and oil plants - 79 ha (0.11%). Among cereals, the largest areas were occupied by corn - 44644 ha (62.58%), followed by wheat and rye - 10361 ha (14.52%) and by barley - 260 ha (0.36%). From the oil plants, the main culture was sunflower the same surface as the plant oils.
In 2010, at the county level arable land of 87836 ha was cultivated in rate of 78.27% - 68746 ha and 19090 ha uncultivated - 21.73%. In ascending order - the total arable land - were recorded weights: 0.12% sunflower - 84 ha, 0.35% oil plants - 239 ha, 0.36% barley and barley - 247 ha, 5.51 % potatoes - 3788 ha, 6.21% other crops - 4267 ha, 7.63% vegetables - 5244 ha, 22.54% wheat and rye - 15494 ha, maize 53.03% - 80.30% 36 459 ha and cereals grains - 55 208 ha.
The specific situation of 2011 show a 77566 ha of arable land cultivated (95.06% from the existing arable of 81595 ha) and an area of 4029 hectares uncultivated (4.94%). Referring to the components of cultivated area is found that they hold in total arable variable weights as follows: 0.06% for barley (44 ha), 0.11% for sunflower (88 ha) 0.19% oil plants (150 ha), potatoes 5.13% (3978 ha), 5.65% vegetables (4384 ha), 6.17% other crops (4787 ha), wheat and rye 14.45% (11212 ha), maize 64.63% (49 979 ha), cereals grains 82.86% (64 268 ha).
potatoes (3913.67 ha); barley 0.25% (183.67 ha); 0.22% oil plants (156 ha); Sunflower 0.12% (83.67 ha).
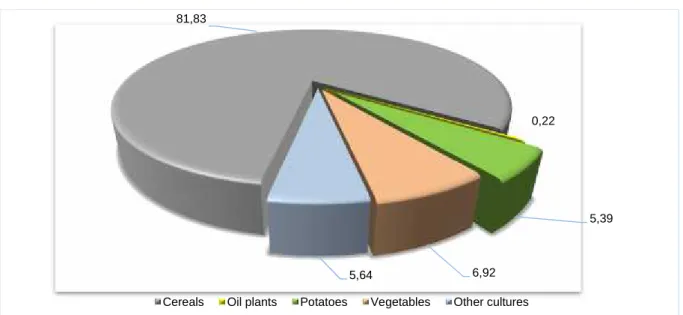
Fig.3. Vâlcea County – Structure of arable surface Average 2009-2011
If we consider the framing mode for Vâlcea County in which means Region South -West realities, in terms of areas for the various crops in arable land, the relevant data are given in Table 4.
Table 4. VÂLCEA COUNTY
Arable land cultivated – Share at regional level*
2009 – 2011
-%-No. Specification 2009 2010 2011 Average
2009 – 2011
1 Cereal grains 7,11 7,38 8,12 7,53
1.1 Wheat and rye 2,69 3,80 3,17 3,23
1.2 Barley 0,80 0,70 0,18 0,59
1.3 Maize 11,68 13,19 12,93 12,54
2 Oil plants 0,07 0,15 0,11 0,12
2.1 Sunflower 0,11 0,09 0,08 0,09
3 Potatoes 21,01 20,89 21,42 21,11
4 Vegetables 12,14 11,26 9,65 11,01
5 Other cultures 8,12 7,81 8,63 8,20
6 Cultivated area 6,90 6,72 7,39 7,00
7 Non-cultivated area 7,55 8,39 2,07 6,18
*own calculation
For 2009 it can be seen that Valcea held 6.90% of the regional area cultivated and represented 7.55% of total cultivated land area. In ascending order, the county at regional weights were 0.07% oil plants, sunflowers 0.11%, 0.80% barley and two-row barley, wheat and rye 2.69%, 7.11% grain cereals 8 12% other crops, 11.68% corn, 12.14% vegetables, potatoes 21,01%.
For 2010 it can be seen that Vâlcea represented 6.72% of the regional total cultivated land and 8.39% of the total uncultivated. For different crops or crop groups, were registered varying weights (regional), as follows: 20.89% for potatoes, maize 13.19%, 11.26% for vegetables, 7.81% other crops, cereal grains at 7.38%, 3.80% for wheat and rye crops, 0.70% for barley, oilseeds at 0.15% and 0.09% for sunflower.
81,83
0,22
5,39
6,92 5,64
If we analyze the specific situation of 2011, stands out weights of 7.0 and 6.18% for the surface area cultivated and uncultivated - from regional total. Relating to different crops or groups of crops (in arable land), is found in the context of the county regional the following contributions: 0.08% in sunflower, for oil plants 0.11%, 0.18% for barley, wheat and rye 3.17%, 8.12% for cereal grains, 8.63% for other crops, 9.65% for vegetables, 12.93% for corn and 21.42% to culture of potatoes.
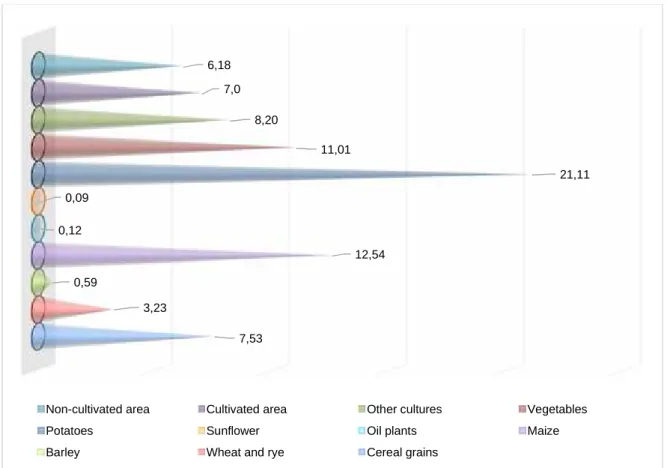
Referring to the specific situation of the average period are observed at regional county level weights as follows (fig. 4): 21.11% for potatoes; 12.54% for maize; 11.01% for vegetables; 8.20% in other cultures; 7.53% for cereal grains; 7.0% for the total area cultivated; 6.18% for uncultivated land; 3.23% for the crops of wheat and rye; barley 0.59%; 0.12% for oil plants; 0.09% of the sunflower crop.
Fig. 4. Vâlcea County – Cultivated surface structure – share at regional level Average 2009-2011
CONCLUSIONS
- The trend of reducing agricultural land is induced by specific evolutions of arable and natural pastures. The remaining categories, evolving downward stationary (plantations), stationary upward (natural grassland) or upward (nonn-agricultural). It is reported that some changes are not spectacular - exceptions are natural grasslands (increase of 27.74% in 2011, based mostly on reducing the phenomenon of arable land);
- In the structure of cultivated arable land, stands out as principal cereal grain crop group - 81.83%, followed at a distance of vegetables - 6.92%, other cultures - 5.64% and potatoes - 5.39%. Oil plants represented only 0.22% of
7,53 3,23
0,59
12,54 0,12
0,09
21,11 11,01
8,20 7,0 6,18
Non-cultivated area Cultivated area Other cultures Vegetables
Potatoes Sunflower Oil plants Maize
- Dynamics of cultivated arable area is one uneven (decrease in 2010, growth in 2011), which is mainly influenced of changes in the area planted with cereals. The uneven trend is manifested in all species grain, and potatoes. Oil plants (sunflower) recorded an upward trend, just like group of "other cultures", while vegetable areas have evolved strictly decreasing.
We can say that in terms of areas held and the composition of crops in arable, Vâlcea County is one of the most important national and regional, but must be better exploited the potential for the production of vine and fruit, but also the potential of the manufacturing livestock sector.
BIBLIOGRAPHY
1. Barbu C., Pânzaru R.L., 2000, Agrarian Economy, Hyperion Publishing House, Craiova
2. Pânzaru R.L., Medelete D. M., 2005, Agrarian Economy, Applications, Ed. Universitaria Craiova
3. Pânzaru R. L., Medelete D. M., Ștefan G., 2007, "Elements of management and marketing in agriculture" Universitaria Craiova.
4. Pânzaru R. L., Medelete D. M., Ștefan G., 2009, "The economy crop production" Universitaria, Craiova
5. Ştefan G., Bodescu D., Toma A.D., Pânzaru R.L., 2007, Economy and agri-food chain, Ed. Alfa Iaşi
6. http://www.valcea.insse.ro/main.php?lang=fr&pageid=483