Multicore Platform Efficiency Across Remote Sensing
Applications
Ekaterina O. Tyutlyaeva1, Alexander A. Moskovsky1, Igor O. Odintsov2, Sergey S. Konyukhov1, Alexey A. Poyda3, Mikhail N. Zhizhin4,5,
Igor V. Polyakov4,6
©The Authors 2018. This paper is published with open access at SuperFri.org
A wide range of modern system architectures and platforms targeted for different algorithms and application areas is now available.
Even general-purpose systems have advantages in some computation areas and bottlenecks in another. Scientific applications on specific areas, on the other hand, have different requirements for CPU performance, scalability and power consumption.
The best practice now is algorithm/architecture co-exploration approach, where scientific problem requirements influence the hardware configuration; on the other hand, algorithm imple-mentation is re-factored and optimized in accordance with the platform architectural features.
In this research, two typical modules used for multispectral nighttime satellite image process-ing are studied:
• measurement of local perceived sharpness in visible band using the Fourier transform; • cross-correlation in a moving window between visible and infrared bands.
Both modules are optimized and studied on wide range of up-to-date testbeds, based on different architectures. Our testbeds include computational nodes based on Intel Xeon E5-2697A v4, Intel Xeon Phi, Texas Instruments Sitara AM5728 dual-core ARM Cortex-A15, and NVIDIA JETSON TX2.
The study includes performance testing and energy consumption measurements. The results achieved can be used for assessing serviceability for multispectral nighttime satellite image pro-cessing by two key parameters: execution time and energy consumption.
Keywords: energy consumption, performance analysis and optimization, cross-platform anal-ysis, energy consumption analanal-ysis, multispectral image processing, nighttime remote sensing.
Introduction
This paper describes the cross-platform analysis of the nighttime remote sensing multispec-tral image processing algorithms.
The timeliness and relevance of the nighttime remote sensing was reaffirmed by such studies as correlation of electric lighting on the Earths surface with socioeconomic trends [1], monitoring of night fishing boat lights [2], detection and characterization of combustion sources [3], and global survey of natural gas flaring [4].
The first step to design a suitable HPC system for processing remote sensing data is analyz-ing the applicability of modern platforms to the typical algorithms used in multispectral image processing.
A wide range of modern system architectures and platforms targeted for different algorithms and application areas is now available. Even general-purpose systems have advantages in some computation areas and bottlenecks in another.
1RSC Technologies, Moscow, Russian Federation 2RSC Labs, Moscow, Russian Federation
3National Research Centre “Kurchatov Institute”, Moscow, Russian Federation 4Space Research Institute, Moscow, Russian Federation
5University of Colorado Boulder, Boulder, USA
Following the current trends in system architecture, all the experiments were conducted on different platforms:
• Modern Intel® architectures Intel® Xeon® E5 (2697A v4). • multicore architecture Intel® Xeon Phi® 7250.
• GPU Nvidia Jetson TX2.
• Dual-core ARM (Texas Instruments Sitara AM5728 dual-core ARM Cortex-A15).
Scientific applications used in specific areas have different requirements for CPU perfor-mance, scalability and power consumption. The co-design approach is widely considered as best practice for designing an effective and economical system. This approach implies that scientific problem requirements influence the hardware configuration; on the other hand, algorithm imple-mentation is re-factored and optimized in accordance with the platform architectural features.
Two typical algorithms used in nighttime image processing have been selected therefore for further cross-platform examination:
• Correlation ModuleInter-channel image cross-correlation in a moving window. • Sharpness Module Spectral and spatial measure of local perceived sharpness [9].
The study was conducted using multispectral images from VIIRS radiometer onboard of Suomi National Polar Partnership (SNPP) satellite.
The image processing modules have been implemented and optimized for the different hard-ware architectures.
According to the latest trends, the key research issue remains in providing a holistic so-lution that can collectively minimize energy consumption by HPC facility [5]. So, the energy consumption study in addition to the performance analysis is required to choose the most suit-able architecture for future HPC system.
This paper mainly contributes to characterization of selected HPC architectures in terms of energy consumption and execution time while running the remote sensing data processing tasks. To perform this study, different implementation and architecture-dependent optimization of a source code were developed, and both time and energy consumptions were measured and analyzed using the chosen architectures.
The rest of the paper is structured as follows. Section 1 reviews earlier research of perfor-mance and energy consumption in hyperspectral imaging field. Section 2 provides a detailed specification of the compared architectures. After that, Section 3 describes the selected bench-marking algorithms used in nighttime image processing. Section 4 describes the parallel imple-mentation and architecture-specific optimizations of these algorithms on selected architectures. Section 5 describes software and hardware used for measurements. Section 6 provides tables with measured results as well as the testing protocol. Finally, the last Section concludes the paper with discussion of the obtained results.
1. Related Work
There are some research efforts aimed at energy efficient processing of hyperspectral image data. For example, in 2013 Remon et al. [6] presented a detailed assessment of performance and energy consumption of hyperspectral unmixing algorithms on multi-core platform equipped with 4 AMD Opteron 6172 processors.
Another study entitled “Energy consumption characterization of a Massively Parallel Pro-cessor Array (MPPA) platform running a hyperspectral SVM classifier” [7] presents a study of the MPPA-256-N power dissipation and energy consumption while running a SVM hyperspectral classifier. This paper also includes comparison with GPU 780Ti GTX.
2. Hardware
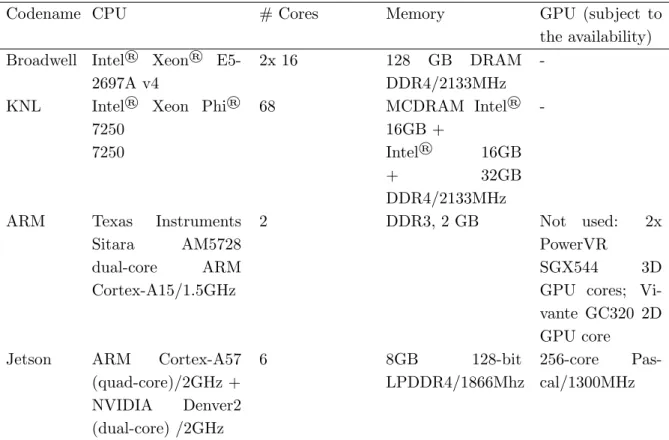
In Tab. 1, codenames and specifications of the studied testbeds are listed.
Table 1. Testbeds Specifications
Codename CPU # Cores Memory GPU (subject to
the availability) Broadwell Intel® Xeon®
E5-2697A v4
2x 16 128 GB DRAM
DDR4/2133MHz
-KNL Intel® Xeon Phi®
7250
68 MCDRAM Intel®
16GB +
-7250 Intel® 16GB
+ 32GB
DDR4/2133MHz
ARM Texas Instruments
Sitara AM5728
dual-core ARM
Cortex-A15/1.5GHz
2 DDR3, 2 GB Not used: 2x
PowerVR
SGX544 3D
GPU cores; Vi-vante GC320 2D GPU core
Jetson ARM Cortex-A57
(quad-core)/2GHz +
6 8GB 128-bit
LPDDR4/1866Mhz
256-core Pas-cal/1300MHz
NVIDIA Denver2
(dual-core) /2GHz
3. Algorithms
3.1. Sharpness
Sharpness module is the most computationally intensive part of the automatic system for detecting fishing boat lights from nighttime images of the VIIRS multispectral radiometer [2].
from the VIIRS Day/Night Band (DNB). If part of the image appears blurry according to the Sharpness Module result, it will be discarded from the search for the isolated electric lights from boats.
The flow graph of the module is shown in Fig. 1
Figure 1. Sharpness Module Flow Graph
The Sharpness module reads input from the VIIRS DNB image stored in HDF5 format. Output data are stored in binary ENVI format. Data processing includes the following steps:
• Logarithmic transformation of the brightness histogram (stretch). • Applying the Wiener filter [8].
• Computing the Spike Median Index (SMI).
• Computing the Sharpness Index (SI) [9] in a moving window of Block Size ×Block Size. The Direct Fourier Transforms and Overdetermined real linear systems solving routines are repeatedly performed during this step.
3.2. Cross-Correlation
TheCross-correlationmodule calculates correlations between two spectral bands, visible and infrared. The main idea of the algorithm is validating the detected sources in different spectral bands under moonlit conditions.
The validation is carried out by performing a synchronous computing the linear Pearson’s correlation between the corresponding moving windows in two spectral images. If the visible and infrared images are locally well-correlated, it means that the signal in the visible images is coming from moonlit clouds. If the local correlation is weak, it means that the visible signal is coming from the sea surface.
4. Implementation Details
The original versions of both algorithms were implemented using Matlab programming language.
We implemented the studied modules using C++. The source code was refactored to reach the maximal level of compiler-assisted optimization. The final C++ version of the code was implemented in a straight-line manner; all repeatedly performed loops had single entry and single, not data-dependent exit.
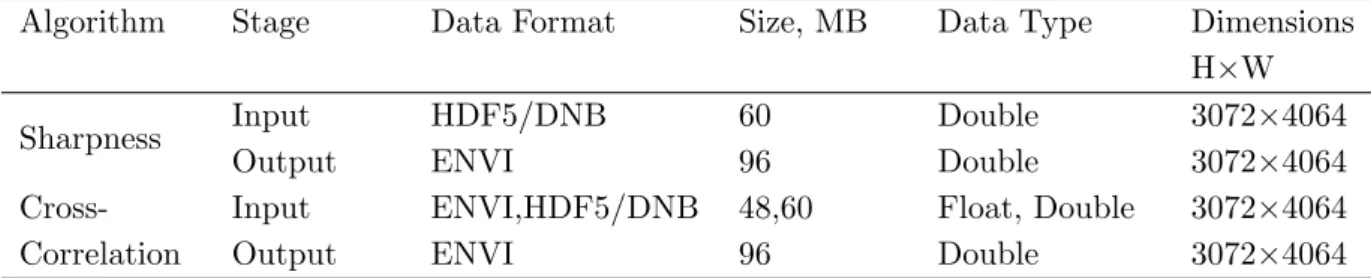
Input and output data details for both algorithms are presented in Tab. 2. HDF5-1.8.19 was used for parsing and reading HDF5 data.
4.1. Intel Version
In order to achieve the best performance on Intel testbeds, the vectorization features were used. In this context vectorization means using of the Intel SSE instruction set, which is an extension to the x86 architecture [10].
Table 2. Data Specifications
Algorithm Stage Data Format Size, MB Data Type Dimensions
H×W
Sharpness Input HDF5/DNB 60 Double 3072×4064
Output ENVI 96 Double 3072×4064
Cross- Input ENVI,HDF5/DNB 48,60 Float, Double 3072×4064
Correlation Output ENVI 96 Double 3072×4064
Intel compiler pragmas were used to inform the compiler of where it can safely ignore data dependencies and to inform that data is aligned.
Repeated operations with data arrays were implemented in a consecutive manner to use direct load from memory in a single SSE instruction.
Moreover, the typical trip count of the loop based on the typical image size is advised to the compiler in the Cross-Correlation module.
Mathematical calculations such as vector logarithm computation, Direct Fourier Transforms and solving the Overdetermined real linear systems were performed using the Intel MKL Library (2017).
The Processor-specific options of the form -ipo -O3 -xMIC-AVX512 (for KNL)/-xCORE-AVX2 (for BRW) were used to generate optimized and specialized code for processors.
The hybrid (MPI + OpenMP) parallelization scheme for an efficient application of the mul-ticore architectures was used for this implementation. Each MPI rank processes its own images independently, so there are minimum communications between the processes. The OpenMP threads were used on Sharpness Index computation step. OpenMP threads process independent data in different positions of a moving window.
This version was tested on Intel testbeds with codenames Broadwell and KNL (Tab. 1).
4.2. ARM Version
The ARM-optimized version of FFTW3 open source library was used for Direct Fourier Transforms. The LAPACK library (3.7.1-4) was used for solving the overdetermined real linear systems. The processor-specific options were used for compilation.
Current implementation uses only ARM Cortex-A15 cores; the GPU cores are idle during the computation. So, the ARM testbed still have room for code optimization to achieve maximum possible performance.
The simple MPI-only parallelization scheme was used for this implementation, where each MPI rank processes its own images independently. An additional OpenMP parallelization layer is not required in this case due to the absence of hyperthreads. We used MPICH MPI imple-mentation optimized for the ARM.
This version was tested on the ARM testbed (Tab. 1).
4.3. CUDA Version
The preparation steps, such as data input, stretch, applying the Wiener filter, and computing the Spike Median Index (SMI) are performed on CPU. The most computationally intensive step (computing the Sharpness Index) is implemented using CUDA (V8.0.62). This step is performed using GPU cores only.
The Cross-Correlation algorithm is also implemented using CUDA. The number of threads used in each block is justified with the image’s width; the number of blocks is justi-fied with the image’s height.
CUDA threads effectively use GPU resources, so the MPI layer is not used in this imple-mentation.
This version was tested on Jetson testbed (Tab. 1).
5. Measuring Equipment
Running Average Power Limit (RAPL) energy sensors, available in recent Intel CPUs, were used for measuring energy consumption for Intel testbeds (Broadwell and KNL). According to the Intel research [11], RAPL software power closely follows the actual power measurements. RAPL reports various energy readings. This includes energy consumption for the processor packages and the DRAM packages.
PAPI library [12] was used on Intel testbeds as an interface to RAPL energy consumption measurements [13]. PAPI provides a uniform access to performance counters as well as to RAPL data, so it provides the opportunities for enhanced measurements in the feature.
Hantek DSO2000 Series USB Oscilloscope [14] was used for power measurements for ARM and NVidia testbeds. Electric current was measured in ampers at every second of testing. Voltage was measured before execution of test series.
The execution time was measured using PAPI Library (P AP Igetrealnsec() function) on all
testbeds.
6. Performance and Energy Consumption Study
This section presents experimental results of processing of time and energy consumption measurements of the modules reported in Section 3, measured using the equipment described in Section 5 on the testbeds listed in Section 2.
The testing procedure consisted of measurements regarding energy consumption and exe-cution time. The testing procedure included a series of 10 exeexe-cutions per each combination of input data set and input feature sets.
Appropriate preparatory steps had been done prior to each execution, especially removing the results of previous computations and cleaning up the caches and swap.
The aggregate result is calculated as a median value of the measured results. Median value is used for understanding the central tendency of benchmarking results and for filtering out values that are skewing the results (for example, abnormally big values caused by temporal system processes’ routines).
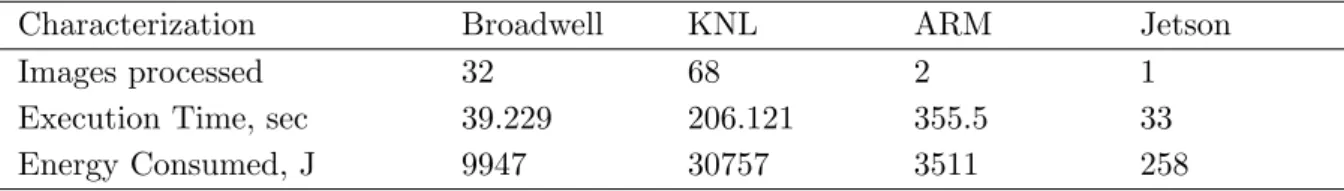
Testing results for the Sharpness module are listed in Tab. 3; results for the
Cross-Correlation module are shown in Tab. 4.
Table 3. SharpnessModule Execution Statistics
Characterization Broadwell KNL ARM Jetson
Images processed 32 68 2 1
Execution Time, sec 39.229 206.121 355.5 33
Energy Consumed, J 9947 30757 3511 258
Table 4. Cross-CorrelationModule Execution Statistics
Characterization Broadwell KNL ARM Jetson
Images processed 32 (×2) 68 (×2) 2 (×2) 1 (×2)
Execution Time, sec 25.7 39 20 5
Energy Consumed, J 4382 5107 179 27
It is important to note that measuring tools used in this research (see Section 5) oversee global energy consumption of the system, not just the energy consumed by the module under study. So, energy consumption results listed in Tab. 3, 4 refer to the total testbeds’ consumptions during execution of the studied module.
As stated above, the number of processes and threads was selected according to the architec-ture requirements and implementation details. For Intel architecarchitec-tures in particular the optimal number of MPI processes refers to the number of physical cores; the number of OMP threads refers to the number of hyperthreads per core (2 OMP threads per MPI process for Broadwell testbed and 4 OMP threads per MPI process for KNL testbed). For ARM testbed, only MPI processes weere used. Finally, only CUDA threads were used for Jetson testbed. Thus, the num-ber of pictures, processed in a parallel, differs for each testbed; execution time and consumed energy also vary in a wide range. So, it is difficult to define the appropriate testbed for these modules.
In this context, in is important to outline that rapid technological progress in multispectral imaging area stimulates new methods and challenges coming to existense in analysis and inter-pretation of hyperspectral data sets. This, in turn, leads to re-processing of data collected over the last year(s). So, the re-processing procedure is maintained systematically.
According to the current data, one Visible Infrared Imaging Radiometer Suite (VIIRS) day/night band (DNB) image corresponds to 5 min observations’ data. Therefore, observation data archived for 1 year contains approximately 52560 DNB images. Table 5 shows the estimated time and energy to process a 1-year archive using the the Sharpnessmodule in conformity with the experimental results mentioned above.
Table 5. SharpnessModule’s Estimated Time To Process a 1-year archive
Characterization Broadwell KNL ARM Jetson
Time to Process, hours 17.9 44.3 2595.15 481.8
As shown in Tab. 5, the best energy consumption (13560 kJ) is reported for Jetson testbed. Following a close second is Broadwell testbed with 16337 kJ estimated energy consumption to process a 1-year archive. However, the execution time is much longer in Jetson testbed (481 hours corresponding to 20 days), while Broadwell testbed should complete processing of the archive with 18 hours.
As an alternative solution, the GPU cluster can be constructed to reduce the computation time and increase the performance. While this approach could benefit for the time of processing, energy consumption would be increased due to communication costs. Moreover, it is worth noting that increasing the number of components affects resilience of the solution.
Conclusion
This paper presents a research regarding execution time and energy consumption at different testbeds while running a multispectral image processing module.
Intel®Xeon® E5 and Nvidia Jetson TX2 demonstrated the most efficient results regarding computation performance and energy consumption criteria.
As a result, Intel® Xeon® E5 can be recommended for periodical re-processing of large archives of multispectral images in a reasonable time (days or weeks of full HPC cluster load). NVidia Jetson TX2 could be used for near real-time image processing, for example, at a direct receiving station, because it shows good results in per-picture processing.
However, ARM testbed must be further studied to fully exploit its potential. We intend to continue this work in the following directions:
• In the nearest future, we are planning to study other types of architectures, including Russian VLIW Elbrus CPUs and Intel® Xeon® Scalable Processors.
• We are planning to carry out a more detailed analysis of correlations between energy consumption and other performance metrics, including cache misses, the number of cycles and executed instructions, and so on.
Designing an energy-efficient system for processing multispectral observation data is a com-plex task that introduces new programming and optimization challenges. However, the results listed in this paper could be helpful for selection of the most appropriate architectures.
Acknowledgements
This research was supported by the grant from the Russian Ministry of Education and Science (The government contract 14.607.21.0165, unique identifier RFMEFI60716X0165).
This paper is distributed under the terms of the Creative Commons Attribution-Non Com-mercial 3.0 License which permits non-comCom-mercial use, reproduction and distribution of the work without further permission provided the original work is properly cited.
References
1. Elvidge, C., Baugh, K., Zhizhin, M., Hsu F.-C., Ghosh T.: VIIRS night-time lights, International Journal of Remote Sensing 38(21), 5860–5879 (2017), DOI: 10.1080/01431161.2017.1342050
Sys-tem for VIIRS Low Light Imaging Data. Remote Sensing Journal 7(3), 3020–3036 (2015), DOI: 10.3390/rs70303020
3. Elvidge, C., Zhizhin, M., Hsu, F.-C., Baugh, K.: What is so great about nighttime VIIRS data for the detection and characterization of combustion sources? In: Proceedings of the Asia-Pacific Advanced Network, vol. 35. pp. 33–48. DOI: 10.7125/APAN.35.5
4. Elvidge, C., Zhizhin, M., Baugh, K., Hsu, F.-C., Tilottama, G.: Methods for Global Survey of Natural Gas Flaring from Visible Infrared Imaging Radiometer Suite Data. Energies 9(1), 14 (2015), DOI: 10.3390/en9010014
5. Khan, S., Bouvrym, P., Engel, T.: Energy-efficient highperformance parallel and distributed computing. The Journal of Supercomputing 60(2), 163–164 (2012)
6. Remn, A., Snchez, S., Bernab, Quintana-OrtAntonio, E., Plaza, A.: Performance versus en-ergy consumption of hyperspectral unmixing algorithms on multi-core platforms. EURASIP Journal on Advances in Signal Processing 2013(1), 68 (2013), DOI: 10.1186/1687-6180-2013-68
7. Madroal, D., Lazcano, R., Fabelo, H., Ortega, S., Salvador, R., Callic, G. M., Jurez, E., Sanz, C.: Energy consumption characterization of a Massively Parallel Processor Array (MPPA) platform running a hyperspectral SVM classifier. In: Design and Architectures for Signal and Image Processing (DASIP) 2017, 27–29 September, Dresden, Germany. pp. 1–6. IEEE (2017), DOI: 10.1109/DASIP.2017.8122112
8. Lim, J. S.: Two-Dimensional Signal and Image Processing. Englewood Cliffs, NJ, Prentice Hall (1990)
9. Vu, C.T., Phan, T.D., Chandler, D.M: S3: A spectral and spatial measure of local per-ceived sharpness in natural images. IEEE Trans. Image Processing, 21(3), 934–945 (2012), DOI: 10.1109/TIP.2011.2169974
10. Intel Corporation: A Guide to Vectorization with Intel C++
Compilers (2012) https://software.intel.com/en-us/articles/
a-guide-to-auto-vectorization-with-intel-c-compilers, accessed: 2018-11-29
11. Rotem, E., Naveh, A., Ananthakrishnan, A., Weissmann, E., Rajwan, D.: Power-Management Architecture of the Intel Microarchitecture Code-Named Sandy Bridge. IEEE Micro, 32(2), 20–27 (2012), DOI: 10.1109/MM.2012.12
12. Jagode, H., YarKhan, A., Danalis, A., Dongarra, J.: Power Management and Event Verifi-cation in PAPI. In: 9th Parallel Tools Workshop, Dresden, Germany, September 2–3, 2015. pp. 41–51 (2015), DOI: 10.1007/978-3-319-39589-0 4
13. Weaver, V. M., Johnson, M., Kasichayanula, K., Ralph, J., Luszczek, P., Terpstra, D., Moore, S.: Measuring Energy and Power with PAPI. In: 2012 41st Interna-tional Conference on Parallel Processing Workshops. pp. 262–268, Pittsburgh, PA (2012), DOI: 10.1109/ICPPW.2012.3