MJCCA9 – 700 ISSN 1857-5552 e-ISSN 1857-5625
Received: March 8, 2016 UDC:663.253:[547.233:543.544.5.068.7
Accepted: April 6, 2016 DOI:10.20450/mjcce.2016.884
Original scientific paper
OPTIMIZATION AND VALIDATION OF A DERIVATIZATION METHOD
FOR ANALYSIS OF BIOGENIC AMINES IN WINES USING RP-HPLC-DAD
Krste Tašev1,2,*, Violeta Ivanova-Petropulos3, Marina Stefova2
1State Phytosanitary Laboratory, Blvd. Alexander the Great bb, 1000 Skopje, Republic of Macedonia
2Institute of Chemistry, Faculty of Natural Sciences and Mathematics, Ss. Cyril and Methodius University,
Arhimedova 5, 1000 Skopje, Republic of Macedonia
3Faculty of Agriculture, University Goce Delčev, Krste Misirkov bb, Štip, Republic of Macedonia
An analytical method for determination of the biogenic amines tryptamine, putrescine, histamine, phenylethylamine, tyramine, cadaverine, spermidine and spermine in red and white wines using pre-column derivatization with dansyl chloride (DnsCl) and reversed phase-high performance liquid chroma-tography with diode array detector (RP-HPLC-DAD) was developed and optimized. The concentration of DnsCl, pH, time of reaction and evaporation under nitrogen were tested and optimized. Best recoveries, ranging from 72 to 102 % were obtained for all analyzed amines applying derivatization with 10 mg/ml of DnsCl for 1 h at 60 ºC and pH 9. The developed method showed excellent linearity with R2 > 0.99 for all
of the tested amines. The accuracy was checked with the standard addition method showing satisfactory recovery, good repeatability and reproducibility. The optimized and validated method was applied for the analysis of white and red wines from Macedonian origin, observing higher total amounts of biogenic amines in red wines. The content of the individual biogenic amines was below the maximal allowed con-centration in all tested wines.
Keywords: wine; biogenic amines; HPLC; derivatization; dansyl chloride; validation
ОПТИМИЗАЦИЈА И ВАЛИДАЦИЈА НА МЕТОД ЗА АНАЛИЗА НА БИОГЕНИ АМИНИ ВО ВИНА СО ПРИМЕНА НА RP-HPLC-DAD
Развиен е и оптимизиран аналитички метод за определување на биогените амини трип-тамин, путрескин, хистрип-тамин, фенилетиламин, тирамин, кадаверин, спермидин и спермин во црвени и бели винa со примена на претколонска дериватизација со дансилхлорид (DnsCl) и реверзно-фазна високоефикасна течна хроматографија со детектор со низа од диоди (RP-HPLC-DAD). Концентрацијата на DnsCl, pH, времето на реакцијата и испарувањето со азот беа тестирани и оптимизирани. За сите анализирани амини беа постигнати најдобри аналитички приноси во граници од 70 до 102 %, применувајќи дериватизација со раствор од DnsCl со концентрација од 10 mg/ml, за време од 1 h на 60 ºC и pH 9. Развиениот метод се карактеризира со одлична линеарност со R2 > 0.99 за сите анализирани амини. Точноста на методот беше проверена со метод на
стандарден додаток, при што беа добиени задоволителни вредности за аналитичкиот принос, добра повторливост и репродуцибилност. Оптимизираниот и валидиран метод беше применет за анализа на бели и црвени вина од македонско потекло, при што повисоки вредности на вкупните амини беа забележани во црвените вина. Во сите вина содржината на индивидуалните биогени амини беше пониска од максимално дозволената концентрација.
1. INTRODUCTION
Biogenic amines are organic nitrogen com-pounds with low molecular weight whose presence plays a vital role in oenology because their pres-ence at high levels in wine can lead to health prob-
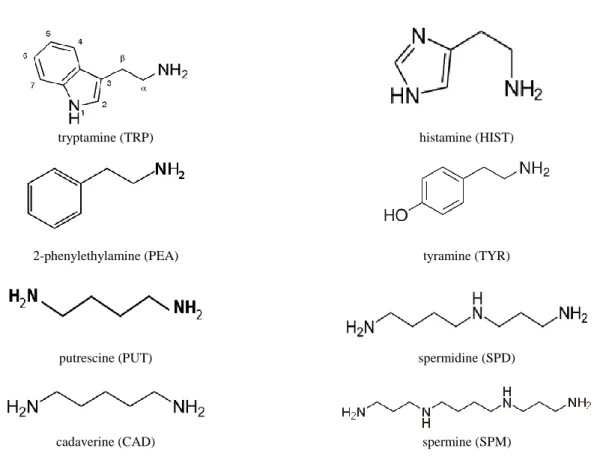
lems.The most important biogenic amines in wine are tryptamine (TRP), putrescine (PUT), histamine (HIST), phenylethylamine (PEA), tyramine (TYR), cadaverine (CAD), spermine (SPM), spermidine (SPD) [1–6]. The chemical structures of biogenic amines are presented in Figure 1.
tryptamine (TRP) histamine (HIST)
2-phenylethylamine (PEA) tyramine (TYR)
putrescine (PUT) spermidine (SPD)
cadaverine (CAD) spermine (SPM)
Fig. 1. Chemical structures of biogenic amines
The upper limits of biogenic amines in wine are set at different levels in different countries. For example, the upper limit for histamine is 2 mg/l in Germany, 5 to 6 mg/l in Belgium, 8 mg/l in France, and 10 mg/l in Switzerland [7, 8].
Biogenic amines can be found in the grape must, but they can also be formed by yeast during alcoholic and malolactic fermentation, as well as during wine aging [9–11]. Sometimes, biogenic amines show correlation with the spoilage of wine and associate with other wine spoilage components for example butyric acid, lactic acid, acetic acid, ethyl acetate and diethyl succinate [4–7, 25]. An increase in the levels of biogenic amines in wines usually occurs towards the end of the malolactic fermentation (MLF) or during maturation, when lactobacilli and pediococci are the main culprits [6].
The health risks arising from the presence of biogenic amines are related to symptoms such as nausea, respiratory discomfort, hot flushes, cold sweat, palpitations, headaches, red rash, high or
low blood pressure, intracerebral hemorrhage or even death [9, 12, 16, 17]. The most problematic biogenic amine is histamine, which causes head-aches, low blood pressure, heart palpitations, ede-ma, vomiting and diarrhea [1, 18–20].
the most commonly used technique because of its great versatility and is therefore an official tech-nique for the analysis of histamine in foods (AOAC, Association of Official Analytical Chemists).
Since the presence of high amounts of bio-genic amines in wines can lead to health problems, their determination is very important, using suita-ble methods for simultaneous determination of the most common representatives with suitable analyt-ical performance. To the best of our knowledge, the analysis of biogenic amines has not been previ-ously performed on Macedonian wines. Therefore, the aim of this work was: (1) to develop and opti-mize a pre-column derivatization method with dansyl chloride, followed by HPLC-DAD analysis and (2) to report, for the first time, data on the content of biogenic amines in Macedonian red and white wines.
2. EXPERIMENTAL
2.1. Chemicals
Standards of biogenic amines used in the study were: tryptamine, putrescine, cadaverine, spermine, spermidine, tyramine and histamine, provided by Sigma Aldrich (Munich, Germany) and 2-phenylethylamine, provided by Fluka (Mu-nich, Germany). Acetonitrile and water (purity for HPLC) were from Carlo Erba (Cornaredo, Italy). Dansyl chloride (99.0% purity) was from Sigma Aldrich (Lyon, France) and Na2CO3 (p.a.) from Merck – Alkaloid (Skopje, Macedonia). All other chemicals used were of analytical grade purity.
2.2. Wine samples
In total, 13 wines, 6 white (Muscat, Risling, Smederevka, Sauvignon Blanc, Žilavka, Chardon-nay) and 7 red (Vranec, Cabernet Sauvignon, Ka-darka, Kratošija, Merlot, Plavac, Pinot Noir) pro-duced in the Tikveš wine region (latitude 41° 25' 57" N and longitude 22° 05' 11" E) (Republic of Macedonia), vintage 2015, were analyzed. All wines were produced in vintage 2015 and kept at 4 °C before analysis.
2.3. Sample preparation
In this work, a simple direct derivatization of the biogenic amines using dansyl chloride (DnsCl) was applied [5, 16, 21] because this rea-gent allows reaction with primary and secondary amino groups, establishing very stable derivatives that are well retained on a C18 column and exhibit
absorption in the UV region at 220 nm [9,16]. For sample preparation, a volume of 500 µl wine was added to 1000 µl solution of previously prepared DnsCl (20 mg/ml), followed by the addition of 250 µl Na2CO3 solution (0.4 M) to adjust the pH to 9. Derivatization reaction was performed in a 15 ml
plastic test tube, which was placed in a water bath (Grant), at 60 ºC for 1 h. Then, the sample was centrifuged at 3500 rpm for 5 min. The supernatant was transferred into another tube and evaporated to dryness using a nitrogen evaporator (Organomation N-EVAP), heated at 40 ºC during the evaporation. Dry wine residue was reconstituted in 500 µl ace-tonitrile, shaken on a vortex for 5 min and ultrasoni-cated for 15 min, followed by filtration with a 0.45 µm filter (Agilent PTFE). A volume of 10 µl was injected into the HPLC-DAD system.
The derivatization agent DnsCl was pre-pared as follows: 1 g DnsCl was dissolved in 10 ml
acetone, due to the stability of the DnsCl in ace-tone. Each day, a volume of 2 ml of this solution was dissolved in 10 ml of acetonitrile and used for wine sample derivatization.
2.4. Calibration curves
Stock solutions (1 mg/ml) of each biogenic amine (tryptamine, 2-phenyethylamine, putrescine, cadaverine, spermine, spermidine, tyramine and histamine) were prepared in 0.1 M HCl. For quan-tification, seven-point calibration curves were con-structed in a range as shown in Table 1. Each cali-bration standard was prepared following the proce-dure for wine sample preparation, as described above (section 2.3).
2.5 HPLC-DAD analysis
2.6. Statistical analysis
Statistical treatment of the data for biogenic amines obtained after the HPLC analysis was per-formed, including calculation of mean, relative standard deviation, standard error and one-way ANOVA, with STATISTICA 6.0 software (Stat Soft Inc., USA).
3. RESULTS AND DISCUSSION
3.1. Optimization of the HPLC method
In order to develop a convenient, simple and rapid HPLC method for quantitative analysis of biogenic amines in wine, different HPLC columns with different lengths and particle sizes were used: the Perkin Elmer Brownlee C18 column (150 mm 4.6 mm, 5 µm) with spherical end caped parti-cles; the Supleco LiChrosorb C18 column (250 mm 4.6 mm, 5 µm) with irregular particles, and the Varian Microsorb 100-5 C18 column (250 mm
4.6 mm, 5 µm) with spherical particles. Separa-tion of the analytes tryptamine, 2-phenyethylamine, putrescine, cadaverine, spermine, spermidine, tyra-mine and histatyra-mine performed on these three col-umns is presented in Figure 2.
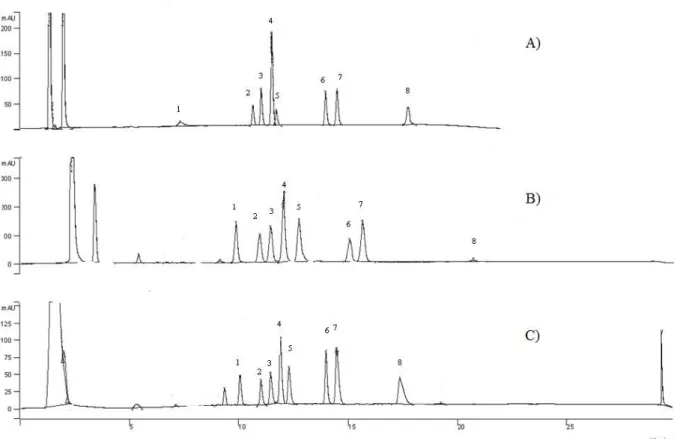
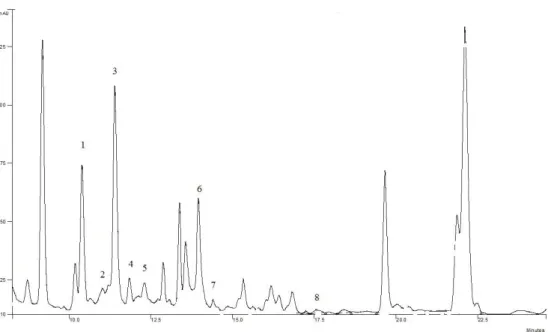
The shortest run-time (total 22 min) was achieved with the Perkin Elmer column (Fig. 2 A), using a faster gradient program (flow rate of 1 ml/min, gradient: 0 min, 50 % B; 8 min, 80 %; 18 min, 90 %; 20 to 22 min 50 %), but satisfactory separation between cadaverine (peak 4) and hista-mine (peak 5) was not achieved using this column. The other two columns, from Supelco and Varian (Fig. 2 B and C) showed similar separation effi-ciency, presenting satisfactory resolution between all biogenic amines. Finally, the column from Var-ian was selected for further work due to the better response and elution time of the last compound, spermine. The gradient elution program was the one given in section 2.5. A chromatogram obtained from a real sample of red wine (Vranec) recorded at 220 nm is presented in Figure 3.
Fig. 2. HPLC chromatograms of standard solution of biogenic amines obtained at 220 nm with three columns: A) Perkin Elmer Brownlee column 150 mm 4.6 mm, 5 µm; B) Supleco LiChrosorb 250 mm 4.6 mm, 5 µm; C) Varian Microsorb 100-5 C18 250 mm 4.6 mm, 5 µm. Gradient elution (described in the Material and methods)
with water and acetonitrile, flow rate 1 ml/min, 10 µl sample.
Fig. 3. HPLC chromatograms of biogenic amines in red wine obtained at 220 nm: on Varian Microsorb 100-5 C18 250 mm 4.6 mm, 5 µm. Peak numbers: 1 – tryptamine,
2 – 2-phenylethylamine, 3 – putrescine, 4 – cadaverine, 5 – histamine, 6 – tyramine, 7 – spermidine, 8 – spermine
3.2. Optimization of the derivatization conditions
Biogenic amines are small and very polar molecules, which cannot be retained on C18 col-umns. Furthermore, amines do not exhibit satisfacto-ry absorption in the visible or ultraviolet wavelength region and do not have any fluorescence. Therefore, derivatization is a necessary step for their analysis.
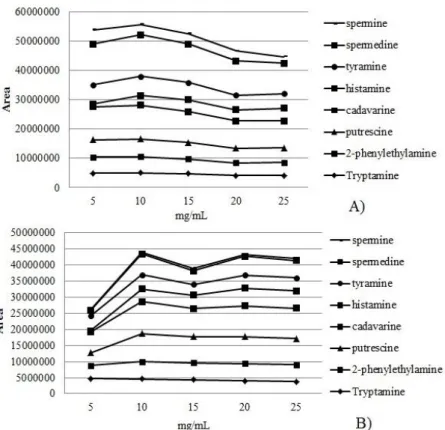
In this study, we used dansyl chloride (DnsCl) as a derivatization reagent. In order to study the influence of the concentration of DnsCl, solutions with variable concentrations were pre-pared: 5, 10, 15, 20 and 25 mg/ml, using a fixed concentration of the mixed standards solution of biogenic amines (5 mg/ml) (Fig. 4A) and a wine sample (Fig. 4B). The effect of the concentration of derivatization reagent DnsCl on the peak area of each biogenic amine is presented in the graphs in Figure 4. It was found that DnsCl presented a simi-lar influence on the derivatization of biogenic amines in the standard solution and the wine ex-cept for the lowest concentration of DnsCl in wine samples. The concentration of DnsCl of 10 mg/ml
was chosen, giving highest peak areas for all ana-lytes. The subsequent increase in concentration did not cause any significant changes in the peak areas of the components.
The effect of pH on derivatization was fur-ther investigated. The following pH values were tested: 8.5, 9, 9.5 and 10. The pH value was varied with the addition of Na2CO3 (0.4 M); the obtained results are presented in Figure 5. As can be seen,
pH 9.5 presented a lower response for spermine, spermidine, tyramine and histamine, and higher response for cadavarine, putrescine, and 2-phenylethylamine, but other pH values tested did not have a significant effect. Taking into account the recommended working pH values for the col-umn (between 2 to 10), pH 9 was chosen as opti-mal for further analyses.
Optimization of time for reaction between DnsCl and biogenic amines is very important. To optimize the reaction time, standard solutions of each biogenic amine were prepared and derivatized after 20, 30, 40 50 and 60 min (Fig. 6), followed by HPLC analysis. Derivatization time of 1 h was proposed as sufficient for complete derivatization reaction.
Fig. 4. Influence of concentration of DnsCl on the peak area of each biogenic amine used with standard solution (A) and wine (B)
Fig. 5. Influence of pH of derivatization on the peak area of biogenic amines in wine
3.3. Validation of the method
The linearity data, including slope, intercept and correlation coefficient (R2), are presented in Ta-ble 1. As can be seen from the taTa-ble, the linearity is satisfactory in all cases with correlation coefficients (R2 > 0.99), ranging from 0.9964 for 2-phenyletyl-amine to 0.9995 for spermidine and spermine.
Limit of detection (LOD) determined as a LOD = 3 × SD/slope and limit of quantification
(LOQ) determined as LOQ = 10 × SD/slope in a low concentration level, were calculated for all amines (Table 1).
Accuracy and precision. The intra-day and in-ter-day accuracy and precision were determined by
injection of standard solutions with low (0.2 mg/l), medium (5 mg/l) and high concentration (10 mg/l). For determination of intra-day accuracy and preci-sion, freshly prepared solutions were used, analyzed immediately, in 3 repetitions during one day. Inter-day accuracy and precision were determined during 3 consecutive days with three repeated analyses. The results are presented in Table 2.
The accuracy was expressed with a relative error of the determined concentration compared with the true (nominal) value. Satisfactory results for the relative error are lower than 20 % for low concentrations and lower than 10 % for high con-centrations.
T a b l e 1
Range of determination, coefficients of the regression curves (slope and intercept), correlation coefficient (R2), LOD and LOQ
Biogenic amines Calibration range
(mg/l) Slope Intercept R
2 LOD LOQ
Tryptamine 0.05–10 800648.9 –43378.0 0.9979 0.01 0.04
2-Phenylethylamine 0.09–10 621432.4 –35326.6 0.9964 0.03 0.09
Putrescine 0.05–10 86187.7 –36119.9 0.9989 0.01 0.03
Cadavarine 0.05–2 1849653.5 –84706 0.9988 0.01 0.03
Histamine 0.06–2 1097320.8 –57324.1 0.9983 0.02 0.06
Tyramine 0.05–2 1367873 –53868 0.9978 0.01 0.04
Spermidine 0.09–2 1996501.6 –85383.1 0.9994 0.03 0.09
Spermine 0.10–2 1624648.5 –65967.1 0.9995 0.05 0.10
T a b l e 2
Inter- and intra-day accuracy and precision
Biogenic amines
The content of standard addition in wine
0.2 mg/l 5 mg/l 10 mg/l
<x> SD RSD
(%) eR <x> SD
RSD
(%) eR <x> SD
RSD
(%) eR
Inter-day accuracy and precision (3 replicates in one day)
TRP 0.23 0.02 9.91 4 4.57 0.27 5.98 –10 9.97 0.08 0.79 –1
PEA 1.45 0.09 5.98 –10 5.91 0.55 9.26 –10 10.3 0.29 2.84 –1
PUT 2.56 0.07 2.65 –9 6.98 0.28 4.05 –7 12.5 0.36 2.89 2
CAD 0.34 0.03 8.96 –12 4.50 0.37 8.19 –8 10.2 0.15 1.51 –9
HIST 0.41 0.04 9.47 –16 4.48 0.44 9.92 –7 10.2 0.04 0.43 –3
TYR 0.99 0.06 5.72 –12 5.30 0.51 9.57 –13 10.6 0.23 2.20 –6
SPD 0.17 0.01 8.32 –19 4.29 0.39 9.03 –9 9.88 0.13 1.32 –5
SPM 0.14 0.01 7.21 –18 4.55 0.33 7.33 –10 8.92 0.63 7.05 –4
Intra-day accuracy and precision (3 replicates in 3 different days)
TRP 0.23 0.03 12.52 1 4.56 0.34 7.40 –9 9.94 0.14 1.41 0
PEA 1.50 0.07 4.81 –1 5.87 0.44 7.50 –10 11.2 0.05 0.47 –8
PUT 2.51 0.04 1.64 6 6.81 0.66 9.73 –9 12.3 0.21 1.67 0
CAD 0.34 0.03 8.96 3 4.50 0.30 6.73 –8 9.47 0.41 4.28 –2
HIST 0.41 0.04 9.47 6 4.57 0.35 7.71 –10 10.2 0.16 1.61 0
TYR 1.00 0.07 6.57 –5 5.15 0.49 9.60 –9 10.3 0.24 2.30 –3
SPD 0.18 0.01 7.88 –20 3.94 0.19 4.84 –7 9.75 0.42 4.36 –2
SPM 0.17 0.01 6.94 –20 4.13 0.16 3.76 –11 9.65 0.58 6.02 –8
Precision was expressed as a relative stand-ard deviation (RSD). Satisfactory results for RSD
are lower than 20 % for low concentrations and lower than 10 % for high concentrations.
The relative errors for inter-day and intra-day accuracy and precision ranged between –19 and 4 % and between –20 and 6 %, respectively. The relative errors were highest (–20 %) for spermine and sper-midine but only for the lowest standard addition (0.2 mg/l), so the results confirmed that the developed method is accurate and convenient for quantitative analysis of biogenic amines.
The accuracy of the method was also checked using the standard addition method on real wine samples. One wine sample was spiked at three concentration levels with mixed standard solutions of biogenic amines with low (0.2 mg/l),
medium (5 mg/l) and high (10 mg/l) concentra-tions. The analysis of these spiked samples led to calculated recoveries ranging between 70 and 105 % (Table 3), which confirmed the accuracy of the method and its suitability for the analysis of bio-genic amines in wine samples.
Repeatability and reproducibility. Repeata-bility was checked with 6 repetitions in one day, while reproducibility was checked with 3 repeti-tions in 5 consecutive days, both performed on real wine samples (Table 4). Values for the relative standard deviation were very low, ranging from 3.80 to 11.7 % for repeatability and 5.97 to 15.8 % for reproducibility, confirming that the method is accurate and can be applied for the determination of biogenic amines in white and red wines.
T a b l e 3
Standard additions method for checking the accuracy on real samples
Biogenic amines
Found without addition
0.2 mg/l 5 mg/l 10 mg/l
Found mg/l Recovery
% Found mg/l
Recovery
% Found mg/l
Recovery %
TRP 0.02 0.23 105 4.56 91 9.96 99
PEA 1.29 1.45 82 5.76 90 11.2 99
PUT 2.42 2.56 96 7.14 96 12.5 102
CAD 0.16 0.31 78 4.63 89 9.40 92
HIST 0.22 0.52 99 4.77 89 10.0 97
TYR 0.82 0.99 82 5.22 88 10.3 94
SPD 0.02 0.17 77 3.69 74 9.52 95
SPM n.d 0.14 72 3.55 71 9.60 96
T a b l e 4
Results for repeatability and reproducibility of biogenic amines (mg/l) in wine
<x> – average in mg/l, SD – standard deviation, RSD – relative standard deviation
3.4. Application of the method on wine samples analysis
The optimized and validated HPLC method, after derivatization of biogenic amines with DnsCl, was applied to the analysis of white and red wines of Macedonian origin. The content of the tested biogen-ic amines in the wines is presented in Table 5.
Comparing the total amount of biogenic amines, it was concluded that red wines contained a higher content (28.8 mg/l, on average) compared to white wines (14.5 mg/l, on average). In general, wines having undergone malolactic fermentation usually have higher levels of amines as was found here for the red wines.
Samples TRP PEA PUT CAD HIST TYR SPD SPM
Red wine Repeatability (6 replicates in one day)
<x> 0.02 1.29 2.42 0.16 0.22 0.82 0.02 n.d
SD 0.00 0.09 0.20 0.02 0.02 0.03 0.00 n.d
RSD (%) 7.06 7.34 8.41 11.7 11.1 3.80 11.8 n.d
Red wine Reproducibility (3 replicates × 5 days)
<x> 0.02 1.33 2.51 0.15 0.22 0.78 0.02 n.d
SD 0.00 0.12 0.15 0.01 0.02 0.08 0.00 n.d
T a b l e 5
Content of biogenic amines in Macedonian wines given in mg/l ± standard deviation (n=3)
TRP PEA PUT CAD HIST TYR SPD SPM
Total
con-tent
White wine
Muscat 1.20±2.14 ≤ LOQ 7.01±0.09 0.21±0.03a ≤ LOQ 0.09±0.05a,c n.d n.d 8.51
Risling 4.99±1.20 0.93±0.05a 8.20±0.36 n.d 1.01±0.08a 0.13±0.04c 0.13±0.09 n.d 15.4 Smederevka 5.30±3.25a 11.1±0.26 0.37±0.10a 0.19±0.03a ≤ LOQ 0.23±0.05b ≤ LOQ n.d 17.2 Sauvi. Blanc 5.60±1.78a n.d n.d n.d 0.16±0.02 0.09±0.06a ≤ LOQ ≤ LOQ 5.85 Žilavka 9.62±2.94 12.2±0.28 0.57±0.29a 0.20±0.07a n.d 0.19±0.18b ≤ LOQ n.d 22.8 Chardonnay 5.75±1.39a 1.63±0.63a 8.68±0.57 0.13±0.04a 1.05±1.12a 0.21±0.04b ≤ LOQ n.d 17.5
Red wine
Plavac 6.29±2.90b 2.46±0.06b,c 10.5±0.29cb 0.73±0.20b 0.48±0.05 6.15±0.08 0.21±0.09a n.d 26.8 Pinot Noir 7.98±0.22 1.69±0.44 10.3±0.06b 0.06±0.06 0.07±0.01 1.29±0.28 0.04±0.04b 1.67±0.25 23.1 Vranec 6.69±1.90b 2.17±0.11c 15.6±0.54 0.63±0.14b 4.07±0.22b 1.99±0.08 n.d 0.62±0.21 31.8 Caber. Sauv. 5.01±0.54 15.0±0.29 11.1±0.47c 0.12±0.02 4.04±0.09b 4.30±0.21 0.10±0.04 0.85±0.20 40.5 Kadarka 3.18±2.31c 4.10±1.85 16.6±9.41d 0.36±0.06 1.53±1.49 0.12±0.05d 0.06±0.05b n.d 25.9 Kratošija 3.76±1.03c 2.81±0.17b 13.3±227 0.61±0.1b 0.21±0.14c n.d n.d 1.05±0.28 21.7
n.d = not detected; ≤ LOQ means value lower than the limit of quantification; same letters in the column indicate values that are not significantly different (p >0.05), analyzed by the ANOVA Tukey-Kramer Multiple Comparisons Test.
Histamine was the main biogenic amine pre-sent in a higher content as a result of that fermenta-tion. Moreover, the levels of biogenic amines de-pending on the free amino acid content (i.e. bio-genic amines increase with increase in amino ac-ids). Grape variety, geographical region, vintage as well as vinification methods also influence the levels of amino acids in grapes, and then in the corresponding wine [25]. In our wines, histamine was found in all red wines, ranging from 0.07 to 4.07 mg/l, which is lower than the upper limits established in Belgium (6 mg/l), in France (8 mg/l) or in Switzerland (10 mg/l) [7, 8]. In the Republic of Macedonia, the maximal content of biogenic amines in wines has not yet been officially estab-lished. The biogenic amines that have toxicological effects (HIST, TYR, TRP and PEA) [9, 12, 16, 17, 25] were in the ranges: 1.20–9.62 mg/l for TYR, 0.07–4.30 mg/l for HIST, 0.93–15.0 mg/l for PEA and 1.20–9.40 mg/l for TRP. PUT and CAD were also found in red wines at higher concentrations than in white wines and the quantities were in the following ranges: PUT: 10.3 mg/l to 16.6 mg/l for red wines and 0.37 to 8.68 mg/l for white wines; and CAD: 0.06 to 1.26 mg/l and 0.13 to 0.21 mg/l for the red and white wines, respectively. SPD and SPM were present in low ranges for red wines (0.04–0.21 mg/l and 0.62 to 1.25 mg/l, respective-ly), while in white wines, SPD was detected only in Riesling wine and SPM was not quantified. These results are similar to other reported results for biogenic amines in wines [5, 21, 25].
In general, all wines contained low amounts of biogenic amines that were lower than the settled maximal concentrations allowed, especially evident for histamine, which is considered a compound that causes headaches and migraines after consuming red wine, suggesting that all of the analyzed Mace-donian wines are safe for human consumption.
CONCLUSIONS
A fast and accurate method for analysis of the biogenic amines tryptamine (TRP), putrescine (PUT), histamine (HIST), phenylethylamine (PEA), tyramine (TYR), cadaverine (CAD), sper-midine (SPD), spermine (SPM) in wines was de-veloped and validated. The method presented satis-factory separation of the analytes, good linearity, sensitivity, precision and accuracy. The developed and validated method was used for determination of these biogenic amines in Macedonian red and white wines. Red wines presented a higher content of amines compared to white wines. All wines contained biogenic amines in a concentration that was lower than the maximal allowed.
REFERENCES
[1] A. Lonvaud-Funel, Biogenic amines in wines: role of lactic acid bacteria, FEMS Microbiology Letters, 199, 9– 13 (2001).
fu-ture trends. Critical Reviews in Food Science and Nutri-tion, 45, 265–286 (2005).
[3] J. M. Landete, S. Ferrer, I. Pardo, Biogenic amine produc-tion by lactic acid bacteria, acetic bacteria and yeast isolated from wine. Food Control, 103(4), 1475–1486 (2007). [4] R. Romero, D. Gázquez, M. G. Bagur, M.
Sánchez-Vinas, Optimization of chromatographic parameters for the determination of biogenic amines in wines by re-versed-phase high-performance liquid chromatography,
Journal of Chromatography A, 871, 75–83 (2000). [5] C. Proestos, P. Loukatos, M. Komaitis, Determination of
biogenic amines in wines by HPLC with precolumdan-sylation and fluorimetric detection, Food Chemistry, 106, 1218–1224 (2008).
[6] E. Soufleros, M. L.Barrios, A. Bertrand, Correlation between the content of biogenic amines and other wine compounds, American Journal of Enology and Viticul-ture, 49, 266–278 (1998).
[7] K. D. Millies, D. Zimlich, Histamingehalte von Weinen und Schaumweinen. Weinwirtschaft- Technik, 1, 21–24 (1988.)
[8] P. Lehtonen, Determination of amines and amino acids in wine – a review. Am. J. Enol. Vitic. 47, 127–133 (1996). [9] Z. Loukou, A. Zotou, Determination of biogenic amines
as dansyl derivatives in alcoholic beverages by high-performance liquid chromatography with fluorimetric detection and characterization of the dansylated amines by liquid chromatography–atmospheric pressure chemi-cal ionization mass spectrometry, Journal of Chroma-tography A, 996, 103–113 (2003).
[10] A. Lonvaud-Funel, Biogenic amines in wines: Role of lactic acid bacteria. FEMS Microbiology Letters, 199, 9– 13 (2001).
[11] L. Arce, L. Rios, M. Valcarel, Direct determination of biogenic amines in wine by intergrating continuous flow clean-up and capillary electrophoresis with indirect UV detection. Journal of Chromatography A, 803, 249–260 (1998).
[12] B. M. De Borba, J. S. Rohrer, Determination of biogenic amines in alcoholic beverages by ion chromatography with suppressed conductivity detection and integrated pulsed amperometric detection. Journal of Chromato-graphy, 1155, 22–30 (2007).
[13] S. Santos, Biogenic amines: their importance in foods,
Journal of Food Microbiology, 29, 213–231(1996).
[14] L. Yongmei, L. Xin, C. Xiaohong, J. Mei, L Chao, D. Mingsheng, A survey of biogenic amines in Chinese rice wines, Food Chemistry, 100, 1424–1428 (2007). [15] A. Moreno-Arribas, M. C. Polo, F. Jorganes, R. Munoz,
Screening of biogenic amine production by lactic acid bacteria isolated from grape must and wine, Internation-al JournInternation-al of Food Microbiology, 84, 117–123 (2003). [16] G. Mo. Dugo, F. Vilasi, G. L. La Torre, T. M.
Pelli-cano`, Reverse phase HPLC/DAD determination of bio-genic amines as dansyl derivatives in experimental red wines, Food Chemistry, 95, 672–676 (2006).
[17] S. Millán, C. Sampedro, N. Unceta, A. M. Goicolea, J. R. Barrio, Simple and rapid determination of biogenic amines in wine by liquid chromatography – electrospray ionization ion trap mass spectrometry, Analytica Chim-ica Acta, 584, 145–152 (2007).
[18] J. Gafner, 32nd Annual; New York Wine Industry Workshop. Biogenic amines in wine, Proceedings of the 13th International Enology Symposium in Montpellier, France, 95–106, 2002.
[19] A. Marcobal, B. de Rivas, R. Muñoz, Methods for the detection of bacteria producing biogenic amines on foods: A Survey, Journal of Consumer Protection and Food Safety, 187–196 (2006).
[20] J. T. Littlewood, C. Gibbs, V. Glover, M. Sandler, P. T. G. Davies, F. Rose, Red wine as a cause of migraine,
Lancet, 1(8585), 558–559 (1988).
[21] R. E. Anli, N. Vural, S. Yilmaz, Y. H. Vural, The deter-mination of biogenic amines in Turkish red wines. Jour-nal of Food Composition and AJour-nalysis, 17, 53–62 (2004). [22] M. C. Vidal-Carou, F. Lahoz-Portoles, S. Bover-Cid, A.
Marine-Font, Ion-pair high-performance liquid chroma-tographic determination of biogenic amines and polyam-ines in wine and other alcoholic beverages, Journal of Chromatography A, 98, 235–241 (2003).
[23] A. Sass-Kiss, E. Szerdahelyi, G. Hajós, Study of biolog-ically active amines in grape and wines by HPLC,
Chromatographia Supplement 51, 316–320 (2000). [24] N. Garcia-Villar, J. Saurina, S. Hernandez-Cassou,
High-performance liquid chromatographic determination of biogenic amines in wines with an experimental design optimization procedure, Analytica Chimica Acta, 575, 97–105 (2006).