13
RESEARCH ON THE INFLUENCE OF SIZE, AXES, POSITION ON THE
AXES AND THEIR INTERDEPENDENCE ON THE DENSITY OF
HUNGARIAN AND THE TURKEY OAK SEEDLINGS IN THE NATURAL
REGENERATION AREAS IN THE WESTERN PART
OF THE GETIC PLATEAU
BERCEA IULIAN1, COJOACĂ FLORIN2
1 Faculty of Agriculture and Horticulture, University of Craiova, [email protected]
2 ICAS, Research Centre of Craiova, f_cojoacă@yahoo.com
Key words: Hungarian oak, Turkey oak, natural regeneration, density, seedlings
ABSTRACT
The research on the influence of size, axes, position on the axes and their interdependence on the density of Hungarian and Turkey oak seedlings in natural regeneration areas has shown the practical solutions to the optimisation of natural regeneration. The main research outputs run as follows:
- the most fertile areas are the outer ones, to the South and West.The regeneration group cuts are ellipse-shaped, while the big axis is oriented to the south and west;
- the widening of the group cuts takes place in strips whose width depends on dimensions up to a height equal to that of the regenerating trees, oriented to the centre of the group cuts to south and west.
INTRODUCTION
The climatic changes of the last decades have impacted on the Hungarian and Turkey oak seedlings in the western part of the Getic Plateau. Besides intense dryness
during 1988-1994 (45% of the Hungarian oak trees were affected) (Badea, 2008), the
Hungarian oak trees did not bear fruit as regularly as before – every 5 or 7 years, but
every 8 or 13 years (22 years) (Bercea: 2007, 2008), which compromised the natural
regeneration of seedlings old enough to be exploited. The dramatic climatic clanges (temperature and rainfall) which compromised the natural regeneration of seedlings may be softened or even reversed via research-driven regeneration methods and techniques aimed at optimising the size, shape and position of group cuts. The density of the seedlings can be optimised according to the ecological factors, in their turn, depending on size, shape and position of group cuts.
Our research focuses on the influence of the size of the Hungarian and Turkey oak group cuts, the woodlands area, the position on the axes of the stands and their interdependence in order to establish the size, shape and orientation of the group cuts and to ensure that regeneration cuts will result in optimal conditions for the density of seedlings that will replace the seed trees.
MATERIALS AND RESEARCH METHOD
14
before 2004 to identify all the variables explaining the different density rates of the targeted Hungarian and Turkey oak.
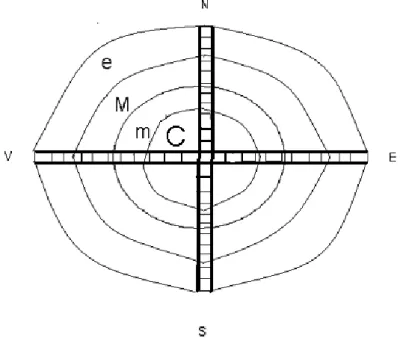
Measurements were made in group cuts of different sizes: 0.5 H; 0.75 H; 1.0 H; 1.5 H and 2.0 H, respectively, at the end of the growing season every year. In each group cuts, starting from the centre, 1-meter wide strips were placed along the length of axes, divided into central parts (C), midpoints (m), peripheral parts (P) and outer parts (o). The data were interpreted and centralised by calculating the average for group cuts of different sizes and at different distances from their centre in the direction of the four cardinal points. The findings were statistically processed via the ,,CSS Statistica" software, where the average of the variables related to each group cut was introduced. The importance of each factor - group cut size, axis, position on the axis - was determined by the analysis of variance, i.e. the ,,ANOVA-MANOVA" test, which also generated the following picture:
Fig. 1 Sample of permanent plot installed both in group cuts and in regeneration areas
RESEARCH FINDINGS
Table 1 comprises 4 variables, out of which 3 are independent: the diameter of the group cut (DIAM), axis of the group cut (AXIS), position on the axis (POS AXIS) and 1 dependent variable: the density of the seedlings (SEEDLING DENSITY).
The average height and height growth of seedlings in the experimental plot in the forest of Macrea U.P. II Argetoaia – Filiaşi Woodland
Table 1
No. DIAM AXIS POS AXIS SEEDLING DENSITY
(no./m2)
0 1 2 3 4
1 0.5H N C 0.83
2 0.5H N M 1
3 0.5H N M 1.5
4 0.5H N E 1.5
5 0.5H S C 2.33
6 0.5H S M 2
15
8 0.5H S E 3.42
9 0.5H E C 1.17
10 0.5H E M 1.67
11 0.5H E M 1.67
12 0.5H E E 1.42
13 0.5H V C 1.33
14 0.5H V M 2.67
15 0.5H V M 1.67
16 0.5H V E 3.83
17 0.75H N C 1.33
18 0.75H N M 1.75
19 0.75H N M 1.29
20 0.75H N E 1.08
21 0.75H S C 1.83
22 0.75H S M 2.13
23 0.75H S M 2.67
24 0.75H S E 4
25 0.75H E C 1
26 0.75H E M 1.67
27 0.75H E M 1.33
28 0.75H E E 2
29 0.75H V C 1.11
30 0.75H V M 2.4
31 0.75H V M 2.83
32 0.75H V E 3.5
33 1.0H N C 0.67
34 1.0H N M 0.67
35 1.0H N M 0.81
0 1 2 3 4
36 1.0H N E 1.67
37 1.0H S C 1.39
38 1.0H S M 1.67
39 1.0H S M 0.87
40 1.0H S E 4.67
41 1.0H E C 0.28
42 1.0H E M 0.28
43 1.0H E M 0.47
44 1.0H E E 1
45 1.0H V C 1.11
46 1.0H V M 10
47 1.0H V M 2.22
48 1.0H V E 3.11
49 1.5H N C 4.67
50 1.5H N M 1.2
51 1.5H N M 1.29
52 1.5H N E 0.96
53 1.5H S C 1.75
54 1.5H S M 2
16
56 1.5H S E 1.67
57 1.5H E C 2.58
58 1.5H E M 1
59 1.5H E M 0.86
60 1.5H E E 0.88
61 1.5H V C 0.5
62 1.5H V M 1.61
63 1.5H V M 1.52
64 1.5H V E 2.5
65 2.0H N C 3.5
66 2.0H N M 0.45
67 2.0H N M 1.53
68 2.0H N E 1.16
69 2.0H S C 2.08
70 2.0H S M 1.18
71 2.0H S M 1.75
72 2.0H S E 1.33
73 2.0H E C 3
74 2.0H E M 0.67
75 2.0H E M 0.75
76 2.0H E E 0.77
77 2.0H V C 1
78 2.0H V M 1.32
79 2.0H V M 1
0 1 2 3 4
80 2.0H V E 0.87
1.8
The result of statistical processing using the ANOVA-MANOVA test for three independent variables: size of group cuts (1-DIAM), axis of group cuts (2-AXIS), position on the axis (3-POS AXIS) as indicated in Table 2, and 1 dependent variable (seedling density), as well as the interaction of the factors 1x2 (size of clear-cut stands and their axes) points to "extremely important” (***).
Overall result of the analysis of triple variance on the densityof Hungarian and
Turkey oak seedlings of younger than 4 years
Table 2
Independent variables Degrees of
freedom
Degree of
importance (p)
df1 df 2
1 2 3 4
1 – group cut size (DIAM) 28 556 0.000000***
2 – group cut axis (AXIS) 21 442 0.000000***
3 – position on the axis (POS AXIS) 21 442 0.000000***
1x2 – interaction between group cut size and axis 84 951 .000000***
1x3 – interaction between group cut size and position on
the axis
84 951 .999890
2x3 – interaction between axis and position on the axis 63 873 .146653
1x2x3 – interaction between group cut size, axis and
position on the axis
17
The analysis of the data in Table 2 shows that the density of the seedlings is directly influenced by the size of the group cuts, the position of the seedlings in the group cuts to the direction of the cardinal points (N, S, E, W), the area they occupy within the group cuts (centre, midpoint, periphery, outer circle); the interaction of the size of the group cuts and of their axes (1x2), being extremely important (p) (***).
To obtain fully-fledged data on the the density of the seedlings belonging to group cuts of different sizes and on the interaction with the size and shape of the group cuts and the position of the Hungarian and Turkey oak seed trees within the group cuts and in the outer areas, the analysis of the triple variance of the independent variables (characteristics
of the group cuts) and the density of the seedlings was performed – for results, see Table
3.
Result of the analysis of triple variance on the densityof 4-year-old Hungarian and
Turkey oak seedlings in regeneration group cuts
Table 3
Independent variables Degree of importance (p) of dependent
variables: *** - extremely important, ** -
highly important, * - important, -
unimportant
Seedling density (no./m2)
1 2
1 – group cut size (DIAM) .01337*
2 – group cut axis (AXIS) .000000***
3 – position on the axis (POS AXIS) .000000***
Interaction 1x2 .126640
Interaction 1x3 .609697
Interaction 2x3 .013586*
Interaction 1x2x3 .992184
Density of Hungarian and Turkey oak seedlings according to the size of the
regeneration group cuts
The density of the Hungarian and Turkey oak seedlings in the first year heavily depends on the size of the group cut, and the result of the analysis of the variance points
to important (*) – see Table 3.
Fig. 2.Density of seedlings in forest group cuts of different sizes Desity of seedlings af ter pushing out 2004
p<0.000
Group cut size (av erage H of seed trees/10)
D
e
si
ty
o
f s
e
e
d
lin
g
s
(n
o
./m
2
)
1.2 1.3 1.4 1.5 1.6 1.7 1.8 1.9 2 2.1
18
Diagram 2 shows that the highest density is encountered in small-sized group cuts (0.75 H and 0.5 H).
In small-sized group cuts (0.5 H), the seedlings show the lowest values, whereas in the large-sized group cuts (2.5 H), the seeddlings are the highest (Fig. 2).
The number of the seedlings drops by half in the group cuts of 1.0 H and 1.5 H and it also drops dramatically in the group cuts of 2.0 H, as compared to the number of seedlings in small-sized group cuts.
1-year-old seedlings show the highest values in the group cuts of 0.75 H and 0.5 H, the lowest values being attached to group cuts of 2.0 H. The large number of 1-year-old seedlings in small-sized group cuts is due to the large number of seeds spread in the small-sized group cuts and due to the protection of the regenerating trees against sun rays in summertime, while securing the necessary light.
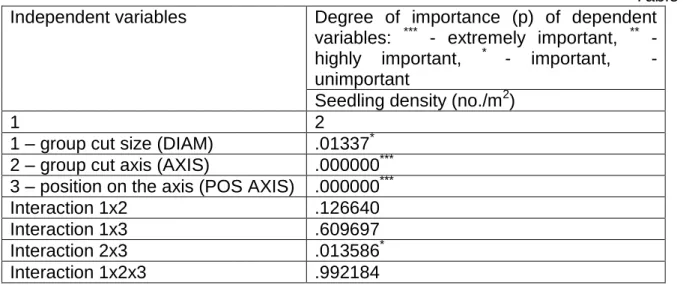
Density of Hungarian and Turkey oak seedlings according to their position on the axes of the regeneration group cuts
Seedlings show the highest density on the axis from the centre of the group cut to east and west, whereas the smallest number is on the axis from the centre of the group cut to east and north (Fig. 3).
Fig. 3. Density of seedlings according to the position on the axis
The smallest number of seedlings on the axis centre-east and centre-north depends
on ecological factors – temperature, humidity and light. In hot summertime, lack of
humidity and longer daylight time causes heatstroke and seedling whithering.
The importance (p) resulting from the analysis of variance (Table 3) and density of seedlings according to the axes of the group cuts is extremely important (***).
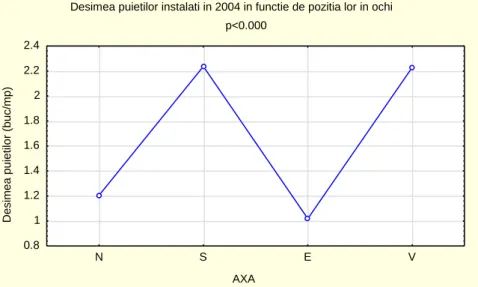
Density of Hungarian and Turkey oak seed trees according to their position in the regeneration group cuts
The lowest value of density is recorded in the centre (C) of the group cut, followed by that of the midpoint (m) and periphery (P). From the periphery (P) to the outer circle (O), under the storey, the seedlings density rises significantly due to the larger number of fruit-bearing mature trees and to micro-climatic life enhancing conditions (Fig. 4)
Desimea puietilor instalati in 2004 in functie de pozitia lor in ochi p<0.000
AXA
Desim
ea
pui
et
ilor
(buc/
m
p)
0.8 1 1.2 1.4 1.6 1.8 2 2.2 2.4
19
Fig. 4. Density of seedlings according to position in the group cut
The high density values of 2004 seedlings in the outer circle was steady during the targeted period.
The result of the analysis of the variance of the density of Hungarian and Turkey
oak seedlings according to their position in the group cuts – see Table 3 – indicates
extremely important (***) based on the negative effect of temperature and light in summertime in the central parts and at the midpoint of the group cuts.
Density of Hungarian and Turkey oak seedlings according to the interaction between group cut size and seedlings position in the group cuts
The density of the Hungarian and Turkey oak seedlings is directly influenced by the interaction between group cut size and seedlings position in the group cuts (Fig. 5).
The highest value of density is recorded on the axis centre –west in group cuts of
1.0 H, and also on the axis centre – south in group cuts of 0.75 H.
The lowest value of density (no. of seedlings/m2) is on the axis centre –north in
group cuts of 1.0 H, and on the axis centre – east in group cuts of more than 1.0 H. The
analysis indicates that the widening of group cuts will be to the south, south-west and west, avoiding any widening to the east and north. The peaks in the sample area are south- and south-west oriented, which favours high temperatures in the eastern and northern parts due to sunlight and scarcity of water in the soil. Hence, plants wither away in late summer characterised by little rainfall and high temperature.
Fig. 5 Density of seedlings according to interaction between size and zoning within group cuts
Desimea puietilor in functie de pozitia in interiorul si la marginea ochiurilor p<0.000
Pozitia puietilor in ochiuri: C- centru, m- mijloc, M-margine, e-exterior
Des
im
ea
puiet
ilor
(
nr
/m
p)
1 1.2 1.4 1.6 1.8 2 2.2 2.4 2.6
C m M e
DIAMOCHI 0,5H DIAMOCHI 0,75H DIAMOCHI 1,0H DIAMOCHI 1,5H DIAMOCHI 2,0H Desimea puietilor in functie de marimea ochiurilor si pozitia pe axa
p<.9999
Pozitia puietilor pe axe
Desim
ea
pui
et
ilor
(buc/
m
p)
0.5 1 1.5 2 2.5 3 3.5
20
In group cuts of 0.5 H and 2.0 H, the larger number of seedlings from the central part to the outer circle can be described by a similar curve, i.e. lower in the central part, rising at the midpoint, slightly lower at the periphery, but, in comparison to the central part, density is higher, whereas in the outer circle it is extremely high. In group cuts of 0.75 H and 1.0 , the number of seedlings is larger from the central part to the outer circle, slightly lower at the periphery (P), followed by a significant rise in the outer circle (o). In group cuts of 1.5 H, the density of the seedlings in the central part is almost equal to that at the midpoint, and the highest density value is in the outer circle.
CONCLUSIONS
The density of the 1-year-old Hungarian and Turkey oak seedlings shows the highest values in the group cuts of 0.75 H and 0.5 H, and the lowest values in the group cuts of 2.0 H.
Optimal density and maintenance is recorded in group cuts of 0.75 – 1.5 H.
Density is higher on the axis centre-south-west, whereas the lowest value is recorded on the axis centre-east-north, showing the same degree of importance as the size and growth of Hungarian and Turkey oak seedlings.
The density of seedlings is influenced by their position on the axes of the group cuts. In the central parts, the density value is the lowest, whereas the highest value is in the outer circle, the degree of importance being extremely important (***).
The highest density value is recorded in the group cuts showing the smallest size on the axis centre-south-west, whereas the lowest density value goes to large-sized group cuts on the axis centre-east and centre-west.
The density of seedlings is extremely low in large-sized group cuts (2.0 H) in the central parts (C) and at the midpoint (m), as well as to the east (E) and north (N), more particularly at the periphery; density is higher in the small-sized group cuts to the south and west in the outer circle and at the periphery.
The fertile areas in the group cuts are the outer ones to the south and west. In order to secure larger areas in a short period of time, meeting the requirements for the seedlings zoning and growth, the group cuts should be ellipse-shaped, while zoning should have the big axis oriented to east-west.
The widening of group cuts will take place in strips of variable width up to the height of the regenerating trees on the axes centre-south and centre-west.
BIBLIOGRAPHY
Badea, O., 2008. Manual privind metodologia de supraveghere pe termen lung a stării ecosistemelor forestiere aflate sub acţiunea poluării atmosferice şi modificărilor climatice
(Handbook of the methodology of long-term monitoring of forest ecosystems under the
influence of air pollution and climatic changes). Bucharest: Editura Tehnică Silvică.
Bercea, I., 2007. Cercetări privind regenerarea arboretelor de gârniţă şi cer din partea
vestică a Podişului Getic. (Research on the regeneration of Hungarian and Turkey oak
seed trees in the western part of the Getic Plateau). Doctoral Thesis. University
,,Transilvania"of Braşov.
Bercea, I., 2008. Silvobiologia (Silvobiology). Craiova:Editura Sitech.
Bercea, I., 2008. Hungarian oak and Turkey oak fructification in the Western part of the
Getic Plateau. ICAS Bucharest, Sustainable forestry in a changing environment,