EXERCISE TRAINING MAY RESCUE IMPAIRMENTS IN MUCOSAL ASSOCIATED INVARIANT T-CELL MOBILIZATION FOLLOWING ACUTE EXERCISE IN
BREAST CANCER SURVIVORS
Lauren C. Bates
A thesis submitted to the faculty at the University of North Carolina at Chapel Hill in partial fulfillment of the requirements for the degree of Master of Arts in the Department of Exercise
and Sport Science (Exercise Physiology) in the College of Arts and Sciences.
Chapel Hill 2020
Approved by: Erik Hanson
ABSTRACT
Lauren C. Bates: Exercise Training May Rescue Impairments in Mucosal Associated Invariant T-cell Mobilization Following Acute Exercise in Breast Cancer Survivors
(Under the Direction of Erik Hanson)
To determine mucosal associated invariant T (MAIT) cell response to acute exercise and exercise training in breast cancer (BC) survivors and healthy controls (HC), 13 BC and 13 HC completed VO2 testing and intermittent exercise at 60% peak wattage (Pre/Post-training). MAIT cells were isolated at baseline, immediately following exercise, and 1 hour after exercise.
Participants completed 16-weeks of aerobic and resistance training for 60 minutes/3 days per
ACKNOWLEDGEMENTS
TABLE OF CONTENTS
LIST OF TABLES ... viii
LIST OF FIGURES ... ix
LIST OF ABBREVIATIONS ... xi
CHAPTER I: INTRODUCTION ... 1
Purpose ... 4
Study Aims ... 4
Research Questions ... 5
Research Hypothesis ... 5
Delimitations ... 6
Limitations ... 6
Significance of Study ... 6
CHAPTER II: LITERATURE REVIEW ... 8
Section 1: The Effects of Exercise on the Immune System of Breast Cancer Survivors: Lymphocyte Response ... 8
Section 2: Overview of MAIT cells, Development, and Cytokine Response ... 13
Section 4: MAIT cell Response to Acute Exercise ... 17
CHAPTER III: METHODOLOGY ... 19
Subjects ... 19
Study Procedure ... 19
Body Composition ... 22
Calculation of Plasma Volume ... 23
Blood Analysis ... 23
Experimental Standard ... 24
Get Real and Heel Exercise Training ... 24
Statistical Analysis ... 26
CHAPTER IV: RESULTS ... 27
Subjects ... 27
Exercise Testing ... 28
Acute Exercise ... 29
Acute Hematological Response ... 29
Pre-Training Acute Response: MAIT Cell Frequencies and Counts ... 30
Pre-Training Acute Response: Cytokine Frequencies and Counts ... 31
Exercise Training ... 34
Exercise Adherence and Compliance ... 35
Hematological Response ... 35
MAIT Cell Mobilization and Egress: Cell Counts ... 35
MAIT Cell Mobilization and Egress: Frequencies ... 36
MAIT Cell Mobilization and Egress: Cytokine Frequencies and Counts ... 37
CHAPTER V: DISCUSSION ... 39
Conclusion ... 47
LIST OF TABLES
Table 1: Immune Response to Exercise Post Treatment in Breast Cancer Survivors...12
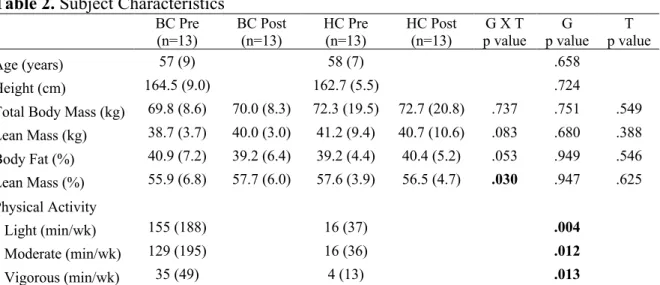
Table 2: Subject Characteristics...28
Table 3: Clinical Characteristics of BC...29
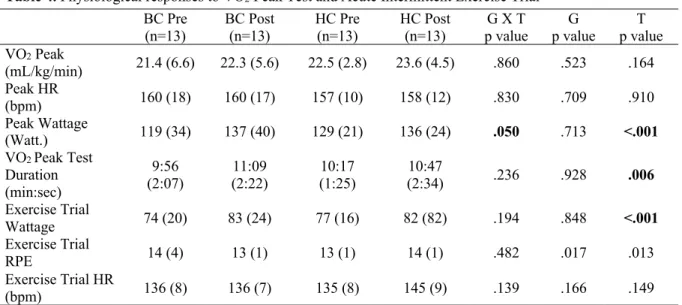
Table 4: Physiological Responses to VO2 Peak Test and Acute Intermittent Exercise Trial...30
Table 5: Pre-Training Complete Blood Cell Count from Acute Intermittent Exercise Trial...31
LIST OF FIGURES
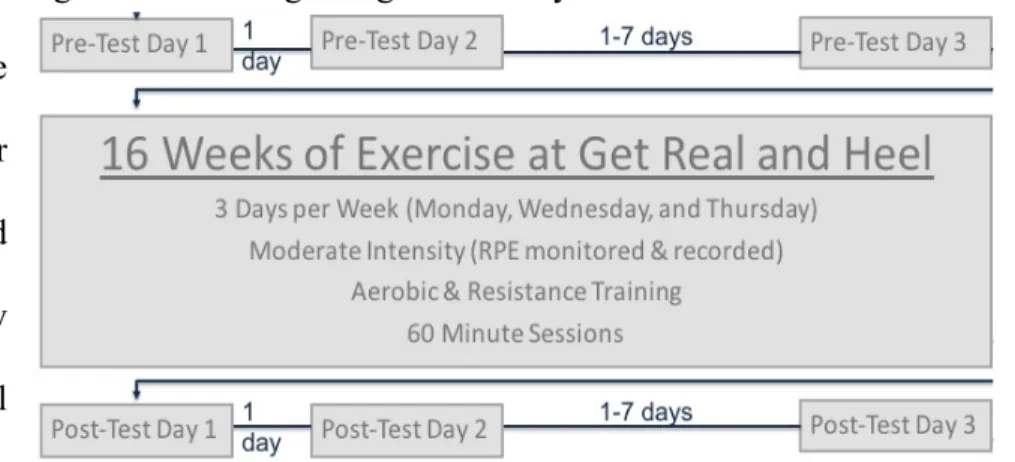
Figure 1: Overall Experimental Timeline...19
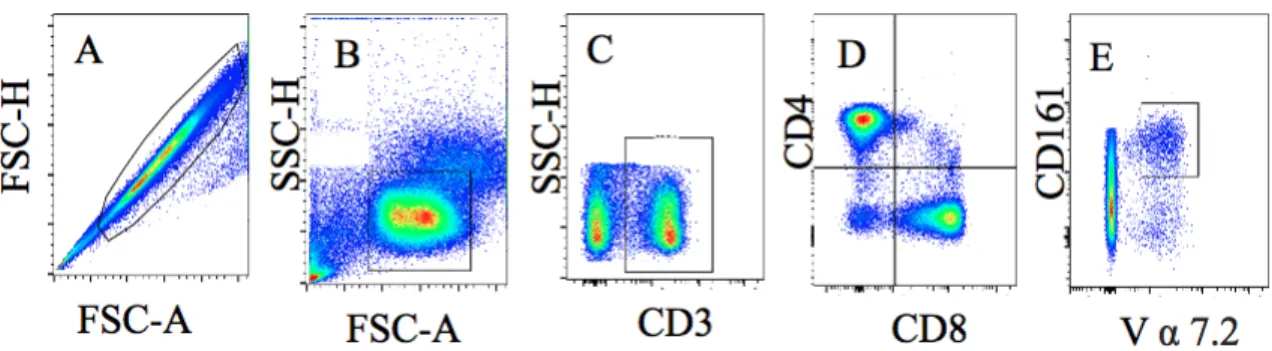
Figure 2: Representative Image of MAIT Cell Gating Strategy...24
Figure 3: Standard Control of Cytokine Response...24
Figure 4: MAIT Cell Acute Exercise Response...30
Figure 5: MAIT Cell TNF-α Acute Exercise Response...31
Figure 6: MAIT Cell IFN-γ Acute Exercise Response...32
Figure 7: T-cell Acute Exercise Response...33
Figure 8: Lymphocyte Mobilization and Egress...35
Figure 9: MAIT Cell Mobilization and Egress...36
Figure 10: MAIT Cell TNF-α Mobilization and Egress...37
LIST OF SYMBOLS
† P<0.05 vs. Base (Time Main Effect)
‡ P<0.01 vs. Base (Time Main Effect) * P<0.05 vs. HC (Group Main Effect) ** P<0.01 vs. HC (Group Main Effect)
LIST OF ABBREVIATIONS
BC- Breast Cancer
% BF- Percentage Body Fat BW- Body Weight-Mass
CBC- Complete Blood Cell Count CD – Cluster of Differentiation
CPET- Cardio-Pulmonary Exercise Testing DMSO- Dimethyl sulfoxide
DXA – Dual Energy X-Ray Absorptiometry EORL-Exercise Oncology Research Laboratory
FBS- Fetal Bovine Serum FM-Fat Tissue Mass Gr – Granzyme
HC- Healthy Control (in this study) HCa- Healthy Control (in literature) HR- Heart Rate
IFN – Interferon
IL – Interleukin
LBM- Lean Body Mass
MAC- Mucosal Associated Cancer
MAIT Cells- Mucosal Associate Invariant T-Cells
MHC-Major Histocompatibility Complex MR1 – MHC Related Protein-1
NK Cells- Natural Killer Cells
PBMCs- Peripheral blood mononuclear cells PRE- Pre-Exercise Training
PMA – Phorbol 12-Myristate 13-Acetate POST- Post-Exercise Training
RPE- Rating of Perceived Exertion RPMI- Cell Culture Media
TCR- T Cell Receptor
CHAPTER I: INTRODUCTION
Breast cancer (BC) is the most commonly diagnosed cancer in women world-wide (Tao et al., 2015). Currently, nearly 90% of early stage BC patients survive 5 years post-diagnosis, meaning more women are surviving BC than ever before (Weiss et al., 2018). However, current BC treatment cause both psychological and physical side effects such as fatigue, lymphedema, peripheral neuropathy, decreased quality of life, depression and chronic inflammation (Kuol, Stojanovska, Apostolopoulos, & Nurgali, 2018; Partridge, Burstein, & Winer, 2001; Shapiro, Charles and Recht, 2001). One side effect of anti-cancer treatments that pertains to both recurrence and secondary disease prevention is immune system dysfunction. Immune function recovery to pre-treatment baseline is delayed 12-months post treatments (Duck et al., 2010).Furthermore, BC patients have lower baseline immune function compared to healthy controls (HCa), and the lapse in immune function recovery to baseline has a significant impact on survivorship (Caras et al., 2004; Verronèse et al., 2016).Thus, immune system dysfunction is a major side effect of concern from anti-cancer treatments (Gardner, 1999; Standish et al., 2008).
(Pedersen & Hoffman-Goetz, 2000; Schmidt et al., 2017), reduce susceptibility to cancer (Ashcraft, Warner, Jones, & Dewhirst, 2019; Koelwyn, Wennerberg, Demaria, & Jones, 2015), and enhance immune system function (Ashcraft et al., 2019; Koelwyn et al., 2015). Thus, examining the effects of moderate intensity exercise training on the immune system is paramount (Ashcraft et al., 2016; Hoffman-Goetz & Husted, 1994; Jones et al., 2017; Nieto et al., 2004).
Some relatively small and specialized populations of immune cells can possess both innate and adaptive characteristics. Among these, mucosal-associated invariant T (MAIT) cells are an unconventional T-cell that help bridge innate and adaptive immunity, making them vital components to the development and maintenance of immunity (Chiba, Murayama, & Miyake, 2018).MAIT cells are identified with a semi-invariant Vα7.2-Jα33/12/20 T-cell receptor (TCR). The TCR recognizes antigens presented on the major histocompatibility complex (MHC) class I-related (MR1) molecule of antigen presenting cells ( Gold et al., 2014; Tilloy et al., 1999). MAIT cell counts and functions are affected by many diseases, including cancer (Won et al., 2016). MAIT cells play an important role in the immune defense response to bacteria and yeast by rapidly producing Th1/Th17 cytokines, such as TNFα, IFN-γ and IL-17 (Dusseaux et al., 2011). MAIT cells also have similarities to NK cells, and CD8+ effector cytotoxic T-cells, which suggests they may act as effectors of tumor-infiltrating lymphocyte subsets (Sundström et al., 2019). MAIT cells may also augment anti-tumor responses based on their characteristics producing TNFα and IFN-γ (Won et al., 2016). The secretion of these pro-inflammatory cytokines suggests that MAIT cells may have the potential to act as a versatile immune cell therapy tool (Won et al., 2016) via their anti-neoplastic and anti-microbial functions (Chang et al., 2007; Schroder et al., 2004).
2016). They may also be considered a cytotoxic cell as MAIT cells express perforin and Granzyme B, which can be bolstered to reduce tumor load (Sundström et al., 2019; Zumwalde, Haag, Gould, & Gumperz, 2018). Further investigation into the role of MAIT cells within BC survivors, and the effects of chronic exercise on MAIT cell counts, percentages, and functions is needed to determine if exercise may protect against secondary disease/recurrence by strengthening immunity. (Grimaldi et al., 2014; Leeansyah et al., 2013; Meierovics, Yankelevich, & Cowley, 2013; Serriari et al., 2014).
To our knowledge, the only studies currently examining the MAIT cell response to exercise exclusively look at the acute response of a single bout of maximal or submaximal aerobic exercise in healthy young men (Hanson et al., 2019, 2017). These studies show increases in MAIT cell counts and percentages post exercise, before returning to baseline. Stimulated MAIT cells also increase TNFα and IFN-γ expression, which suggests greater responsiveness to mitogenic stimulation after acute exercise (Hanson et al., 2019). This enhanced response would potentially help to mitigate recurrence and secondary diseases associated with cancer survivorship. However, there is limited immune function data in the literature in response to acute and chronic exercise in BC, especially in unconventional T-cell subsets.
programs (Dethlefsen, Pedersen, & Hojman, 2017; Khosravi et al., 2019). The combination of acute and chronic response to exercise would give critical insight into how the immune system adapts to physical stress before and after training programs, which may be different than resting values.
Since MAIT cells are known to persist through BC treatment (Dusseaux et al., 2010; Le Bourhis et al., 2010; Won et al., 2016) and suggests anti-cancer function (Won et al., 2016), establishing the potential benefits of exercise training to enhance MAIT cell counts and function would potentially give BC survivors additional protection. The extensive burden BC survivors face from cancer treatment includes many side effects able to be mitigated by regular exercise. Immunosuppression is a side effect that still is understudied regarding specific cell response, such as T-cell subsets, and their function. Moderate intensity exercise may potentially be used to increase immune function in BC survivors, suggesting that exercise may be an effective immunotherapy treatment for BC.
Purpose
The purpose of this study was to determine the acute response to intermittent exercise for MAIT cell counts, percentages, and function in BC and HC before and after a 16-week exercise intervention (aerobic and resistance training, 3 days per week, 60 minutes per session, moderate intensity).
Study Aims
2. Compare the chronic response of exercise training (change in acute response from pre to post intervention) on MAIT cells (counts, percentages, and function) in BC survivors vs. HC.
Research Questions
1. Do MAIT cell counts and percentages in peripheral circulation change immediately and 1 hour after a 45-minute bout of intermittent exercise at 60% VO2peak on a cycle ergometer in both BC and HC?
2. Do MAIT cell counts, percentages, and function change over 16-weeks of moderate intensity exercise (3 days per week, 1 hour per session, aerobic and resistance training) in both BC and HC?
Research Hypothesis
1. Acute intermittent exercise will not increase MAIT cell counts and percentages in peripheral circulation in BC or HC. Acute intermittent exercise will not increase cytokine production following exercise.
2. There will be no change in MAIT cell counts, percentages, function, or cytokine production after 16-weeks of exercise training in either BC or HC.
There will be no difference in MAIT cell count, percentage, or functional response after 16-weeks of exercise training between BC and HC.
Assumptions
1. Participants followed pre-assessment guidelines.
2. All participants answered the medical history questionnaire and physical activity readiness questionnaire truthfully.
Delimitations
1. The sample contained only women, age-matched between BC and HC (at least 35 years old).
2. All BC survivors were at least 30 days but less than 1-year post treatment. 3. All participants had no contraindications for exercise testing.
4. All participants were non-smokers.
Limitations
1. Not all participants adhered to all prescribed exercise training days (i.e. attend 3x per week for all 16 weeks).
2. Not all participants complied with prescribed intensity during exercise training at all exercise training days (i.e. complete all exercise at prescribed time/reps and intensity). 3. In pre-menopausal participants, menstrual cycle was not controlled.
Significance of Study
CHAPTER II: LITERATURE REVIEW
This review is divided into four sections: 1) The effects of exercise on the immune system of BC: lymphocyte response; 2) An overview of MAIT cells, development, and cytokine response; 3) The relationship of MAIT cells and cancer; and 4) MAIT cell response to exercise.
Section 1: The Effects of Exercise on the Immune System of Breast Cancer Survivors: Lymphocyte Response
(MAIT cell) will help to develop our understanding of exercise as a potential therapy for reducing chronic inflammation for BC survivors in order to promote immune function.
Many studies have shown that women with BC have increased circulating pro-inflammatory cytokine levels compared to women without BC. This dysregulation can persist for several years post diagnosis (Salgado et al., 2003; Seruga, Zhang, Bernstein, & Tannock, 2008). Thus, identifying the factors that decrease chronic inflammation and establishing interventions that promote anti-inflammatory environments are critical avenues of research. In a systematic review, it was reported that exercise possesses the ability to not only increase the robustness of an anti-tumor immune response, but also the ability to modulate the anti-tumor microenvironment (Koelwyn et al., 2015). Furthermore, recent preclinical studies have reported the exercise mediated immune response experienced by BC are sufficient in reducing tumor incidence, progression, and metastasis when administered as a monotherapy (Kathleen & Ashcraft, 2018).
functional capacity, and physical fitness outcomes, but also may be able to mediate biological changes to body composition, systemic inflammation, and immune system function.
Generally, following acute exercise the total number of leukocytes in circulation increases proportionally to the intensity/duration of exercise (McCarthy & Dale, 1988). During recovery from acute exercise, monocytes and lymphocytes decline in circulation to below baseline levels (Koelwyn et al., 2015; Nieman, 1997). Neutrophils however continue to increase in circulation until they peak typically hours after exercise is completed (Fry, Morton, Crawford, & Keast, 1992; McCarthy & Dale, 1988). Some studies have explored the effect that exercise training has on the immune system of BC. NK cell activity, leucocyte sub-population composition, and T-helper lymphocytes (CD4+) all have been found to significantly increase with aerobic training (using a cycle ergometer) in BC populations (Fairey AS, Courneya KS, Field CJ, Bell GJ, Jones LW, 2005; Peters C, Lötzerich H, Niemeir B, Schüle K, 1995). More studies investigating the exercise training response in BC survivors on different immune subsets is needed to better understand the potential benefits exercise may have for this population.
Hadden, 2003). Early immune recovery of both lymphocyte count and proliferation predict survival and lower recurrence of BC (Nieto et al., 2004).
A systematic review suggests that physical activity reduces BC specific mortality and all-cause mortality possibly through improvements in circulating levels of inflammation and immunity (Ballard-barbash et al., 2012). Furthermore, BC survivors have higher levels of circulating pro-inflammatory cytokines than healthy controls (Jones et al., 2013) and tumors contain an extensive network of pro and anti-inflammatory cytokines in their own microenvironment (Seruga et al., 2008). Pro-inflammatory cytokines cause negative systemic effects such as fatigue or depression (Seruga et al., 2008), however exercise may be able to modify cytokine levels systemically decreasing symptom burden, and possibly improving prognosis (Seruga et al., 2008).
Table 1: Immune Response to Exercise Post Treatment in Breast Cancer Survivors
Author Exercise Immune Component Findings
(Peters, et al., 1995) N=24
Supervised cycle ergometer for 5 weeks, 5 ×/week @ 60–86% HR max, 30–40 min post‐treatment. Then self‐reported cycling for 6 months, 2–3 ×/week @ moderate intensity
Peripheral blood
lymphocytes (CD56+)
↔ # or % CD56+
↑ NKCA (% lysis) at 29 weeks compared to baseline and 5 weeks ↔ # leukocytes, ↑ % granulocytes at 29 weeks compared to baseline and 5 weeks, ↓ %, # lymphocytes at 29 weeks compared to 5 weeks, ↓ % monocytes at 29 weeks compared to baseline and 5 weeks
(Nieman et al., 1995) N=12
Supervised walking for 8 weeks, 3 ×/week @ 75% HR max, 60 min combined with supervised resistance training for 8 weeks, 2 sets of 12 repetitions of 7 exercises
Peripheral blood leukocytes, lymphocytes (CD3+, CD3– CD16+CD56+), neutrophils
↔ # of leukocytes, CD3+, CD3– CD16+CD56+, neutrophils
(Bonner et al., 2015) N=28
Supervised, moderate-intensity aerobic exercise three times per week at the exercise facility and two unsupervised sessions per week at home for 12 weeks
Serum was isolated from venous blood. Plex assay was run.
No significant change in serum cytokines (IFN- γ)
(Hutnick et al., 2005) N=49 total N=28 exercise N=21 no exercise
Supervised resistance training and aerobic activity at 60-75% functional capacity three times a week for 6 months
Activation was determined by the presence of CD4(+)
CD69(+) T-helper
lymphocytes,
mitogen-induced proliferation, and levels of cytokines produced
by mitogen-stimulated
lymphocytes and in the patients' plasma
The exercise group had greater percentage of CD4(+) CD69(+) cells. Similar levels of IFN- γ
(Fairey et al., 2005)
N= 52 total N= 24 exercise N=28 no exercise
Supervised cycle ergometers three times per week for 15 wk at
70–75% of peak oxygen
consumption. Exercise duration
began at 15 min for weeks 1–3
and then systematically increased by 5 min every 3 wk thereafter to
35 min for weeks 13–15.
Isolated peripheral blood mononuclear cells. Standard
hematological variables,
whole blood neutrophil function, the phenotypes of isolated mononuclear cells, estimations of unstimulated
and
phytohemagglutinin-stimulated mononuclear cell
function (rate of [3H]
thymidine uptake), and the
production of
proinflammatory
[inter-leukin (IL)-1, tumor
necrosis factor, IL-6] and anti-inflammatory cytokines (IL-4, IL-10, transforming growth factor)
Exercise training increased natural
killer cell cytotoxic activity
(unstimulated [3H] thymidine uptake
by peripheral blood lymphocytes in
postmenopausal breast cancer
survivors)
(Evans et al., 2015)
N=18 total N=9 BC N=9 HCa
1 bout of intermittent exercise consisting of 10 three-minute intervals of aerobic exercise on the cycle ergometer at 60% of VO2peak (peak oxygen uptake)
Whole blood samples were
taken pre-exercise,
immediately post exercise, and at 2 hours and 24 hours post exercise
NK cell counts significantly increased immediately post exercise compared
with pre-exercise (P = .004-.008) and
returned to near pre-exercise levels
during recovery (P = .129-.547) in
Section 2: Overview of MAIT cells, Development, and Cytokine Response
MAIT cells are innate-like T-cells that function at the juncture of adaptive and innate immunity. In humans, MAIT cells are the most profuse T cell subset able to detect and kill bacterial infected cells and are associated with pathogen-specific antibody responses (Le Bourhis et al., 2013; Winters-Stone et al., 2012). MAIT cells express a semi-invariant T-cell receptor (TCR) Vα7.2-Jα33/12/20 on the cell membrane in humans (Wakao, Sugimoto, Kimura, & Wakao, 2017). They typically make up 1-10% of the T cells found in circulating human blood, and even more enriched in mucosal tissue (Wong & Ndung, 2017). MAIT cells are also identified via their development dependence on the major histocompatibility complex (MHC) class 1b molecule MHC class I-related protein (MR1) (Tilloy et al., 1999).
The MR1 and MAIT cells perform critical functions in the immune system (Dias, Leeansyah, & Sandberg, 2017). The semi-invariant T-cell receptor (TCR) of MAIT cells (Vα7.2-Jα33) was first discovered during human TCR repertoire analysis of CD4-CD8- T cells (Porceui, Yockey, Brenner, & Balk, 1993) and can recognize antigens in complex with the MR1 protein. MAIT cells are activated independently by cytokines such as IL-7,IL-12, IL-18, IL-15, IFN α/ β (Suliman et al., 2019) or dependently via MR1-TCR activation (MAIT cell’s TCR binds to MR1 protein presenting antigen) (Dias et al., 2017) . Most CD4+ and CD8+ T cells recognize lipid or peptide-based antigens (associated with MHC or CD1). MAIT cells however can recognize microbial vitamin B2 metabolite antigens via the MR1 complex (Voillet et al., 2018), instead of the antigen peptides that CD4 and CD8 T-cells recognize (Kjer-Nielsen et al., 2012).
undergo positive selection and lineage commitment. This happens from an interaction with MR1-expressing CD4+CD8+ double-positive thymocytes (Seach et al., 2013). Stage I MAIT cells have been defined as CD27-CD161-. This is because they are exclusive to the thymus and have minimal function (Koay et al., 2016). Stage II of MAIT cell development also occurs within the thymus. As the cells further develop, they display a naïve phenotype (CD45+, CD27+). At this stage MAIT cells are also present in cord blood. This population of MAIT cells decline with age (Koay et al., 2016; Martin et al., 2009). In the thymus CD161 expression is low but in human cord blood the expression of CD161 is comparable to that of adult blood MAIT cells perhaps suggesting that MAIT cells acquire CD161 expression prior to exiting the thymus and remain naïve until birth (Martin et al., 2009). After thymic egress MAIT cells accumulate in the periphery from an interaction with B cells (Martin et al., 2009; Østergren et al., 2016).
In most humans, the major population of MAIT cells are CD8+, with a smaller subset of CD4-CD8- double negative, and some CD4+ (Dias et al., 2018). MAIT cells produce many cytokines such as TNFα, IFN-γ and IL-17 (Dusseaux et al., 2010; Tang et al., 2013; Ussher et al., 2014). MAIT cells secrete cytotoxic chemicals and Th1/Th17 cytokines. They express CD161 (NK cell associated receptor), and in response to MR1-dependent activation will produce TNFα, IFN-γ and IL-17 (Bennett, Trivedi, Iyer, Hale, & Leung, 2017). After stimulation with phorbol 12-myristate 13-acetate (PMA)/ionomycin (a chemical commonly used to induce cytokine production) MAIT cells release many cytokines. PMA/ionomycin stimulation to MAIT cells have produced high levels of IFNγ, IL-2 (both Th1 cytokines), TNFα and GrB in amounts similar to memory CD8+ T cells, as well as IL-17 (a T
released IL-17 after PMA/ionomycin stimulation compared to CD4+ T cells. MAIT cells functions are likely related to their capacity to secrete TNFα, IFN-γ and IL-17 (Le Bourhis et al., 2013), but their precise role remains unclear (Wakao et al., 2017).
In the peripheral blood MAIT cell counts, as well as functions, are altered by many chronic diseases such as asthma, diabetes, obesity, and tumors. In healthy individuals circulating MAIT cells account for 0.2-7.6% of the circulating CD3+ T-cells (Magalhaes et al., 2015), but in Asthmatic’s there are significantly lower circulating MAIT cells correlated with severity of disease (Hinks et al., 2015). In both obese and non-obese type II diabetic’s circulating MAIT cell counts are also significantly lower: 0.27% non-obese type II diabetics, 0.10% obese type II diabetics, and 0.05% obese non-type II diabetics. Circulating MAIT will counts are negatively associated with BMI (Magalhaes et al., 2015). Cytokine production is also altered by diabetes/obesity whereas significantly higher levels of IL-2, IL-17, GrB, TNFα, and IFN-γ were produced in diseased individuals compared to healthy controls after PMA/ionomycin stimulation (Magalhaes et al., 2015).
individuals (Magalhaes et al., 2015). This change to MAIT cell counts and functions suggests an inflammation related component to cytokine production.
Section 3: The Relationship of MAIT cells and Cancer
Innate immunity is a vital component of tumor surveillance, and adaptive immunity is crucial in protecting cancer patients and survivors against secondary diseases. MAIT cells respond to a variety of conditions such as acute infections, chronic infections, autoimmune disorders, and cancer. Some studies of diseased populations have shown a decrease in MAIT cell frequency in the blood, but it is unclear if the cause is a systemic decline in MAIT cells or if there is a migration of MAIT cells into the tissue causing a decrease in the periphery (Kronenberg & Gapin, 2002; Magalhaes et al., 2015). Less is known however about the role of MAIT cells and cancer (Won et al., 2016).
One way to access the functionality of MAIT cells is to consider the production of cytokines following stimulation. IL-17, TNFα, and IFN-γ are all known to have anti-cancer function (Jiang et al., 2018; Ling et al., 2016a). IFN-γ is a critical regulator of innate and adaptive immunity. It is cytotoxic to some malignant cells, and it regulates anti-tumor activity through other cytokines (Lee et al., 2014). TNFα is a vital regulator of inflammation, and dysregulation is implicated in cancer (Gaudet et al., 2007). IL-17 plays a role in the tumor microenvironment, and in some murine models have been shown to promote tumor vascularization (Lee et al., 2014). Another important mechanistic question to consider applies to the clinically relevant ability of MAIT cells to persist throughout chemotherapy treatments.
In a recent study, BCa patients undergoing 6 cycles of chemotherapy (Anthracyclines) appeared to have a stable, if not increasing, amount of MAIT cells 1 month after the 6th cycle (Dusseaux et al., 2011). All of the other conventional memory CD8 T cells measured significantly decreased in count by the 6th cycle, and then slightly recovered (but remained significantly below baseline) 1-month later after chemotherapy (Dusseaux et al., 2011). CD4 and CD8 T cells also remained significantly decreased after treatment (Dusseaux et al., 2011). Dusseaux suggested the mechanistic explanation of MAIT cell survival after anthracycline treatments was due to the high expression of ABCB1 (multidrug efflux protein) (Dusseaux et al., 2011).
Section 4: MAIT cell Response to Acute Exercise
2.2-fold post maximal exercise (Hanson et al., 2017). MAIT cells showed preferential mobilization within T cells, but the response was not correlated with fitness level, body composition, or exercise duration (length of maximal exercise test). These results may indicate that acute aerobic exercise could be used to counterpoise MAIT cell deficiencies which are present in some pathologies.
CHAPTER III: METHODOLOGY
Subjects
Subjects for this study included BC survivors and HC’s. Twenty-four BC survivors (at least 30 days but no more than 1 year since final treatment received) and fifteen HC completed testing. Thirteen BC survivors and thirteen HC were age-matched and included in the study. The BC survivors were all between 45-75 years old and had stage I-III BC. The HC were at least 42 years old with no history of cancer. The HC were sedentary prior to enrolling in the study, as defined by not exercising more than 30 minutes or more at a moderate intensity twice a week. The study was approved by the University of North Carolina at Chapel Hill’s Institutional Review Board. Additionally, participants signed informed consent prior to participating in the study.
Study Procedure
There were three testing visits at the beginning of the study. Then 16-weeks of aerobic and resistance training three
times per week for 1 hour per visit at the Get Real and Heel training facility (located at UNC Chapel Hill) under the supervision of trained exercise
specialist followed by three testing visits at the
end of the 16-week exercise intervention. During the first visit, subjects completed a Medical History form, a Physical Activity Readiness Questionnaire, and a 12-lead electrocardiogram (ECG; which was sent to a study team physician for approval) prior to beginning of physical activity evaluations.
General vital signs were recorded using appropriate, standardized equipment and techniques in the Exercise Oncology Research Laboratory (EORL) at the University of North Carolina at Chapel Hill. Height (cm) and weight (kg) were recorded using the Health-o-Meter 402KL (Rye, NY) stadiometer and physicians scale, respectively. Blood pressure (mmHG) was recorded manually using standard sphygmomanometers and stethoscopes at the beginning of every visit. Heart rate (bpm) was recorded continuously throughout testing using a Polar (Polar Electro Inc., Lake Success, NY) chest strap and watch telemetry system during every visit.
Subjects completed a familiarization session on an electronically braked cycle ergometer. Familiarization included being appropriately adjusted in the cycle ergometer and also fitted for a mask to be used for indirect calorimetry assessment of peak oxygen uptake (VO2peak) during the cardiopulmonary exercise test (CPET). After the subject was sized to the cycle ergometer, the distance from the knob under the bike seat to the middle of the pedal was measured in centimeters with a tape measure and recorded so the same set up was used during post intervention testing.
three minutes while research team collected resting metabolic data. The first stage of the CPET began with a two-minute warm up (unloaded at 0 watts), followed by a three-minute loaded warm-up phase (20 watts). After the two warm-warm-up stages the workload (wattage) continuously increased 15 watts per minute until the termination of the test. HR and RPE (6-20) was continually monitored and recorded throughout the testing. Termination of the test was determined by subject reaching volitional exhaustion and signaling to stop the test. Other parameters to terminate the test included: VO2 plateau (VO2 decrease with an increase in exercise intensity) or an abnormal subject response to the test.
The third day of pre-training/post-training exercise testing occurred 1-7 days after day two of testing. It included a 45-minute moderate intensity exercise bout on the cycle ergometer at 60% of the peak wattage from the subject’s exercise test on day two. During the third day, the subjects was overnight fasted and was instructed to follow pre-assessment guidelines. Upon arrival to the lab subjects laid quietly for 10 minutes resting, and then a peripheral venous catheter indwelling venous catheter (BD Bioscience, Franklin Lanes, NJ, USA) was inserted into the antecubital vein of the forearm for repeat blood sampling using sterile technique by trained personnel (non-effected side for BC survivors). Approximately 50 mL of blood was drawn into blood collection tubes (inverted several times) containing EDTA (BD Bioscience, Franklin Lanes, NJ, USA), Sodium Heparin (BD Bioscience, Franklin Lanes, NJ, USA), and Serum (BD Bioscience, Franklin Lanes, NJ, USA) throughout the duration of the test day.
exercise session), and at 1-hour (1h) after exercise (after 1-hour of seated rest). From the blood samples, 1) plasma and serum were isolated and stored at -80 until the end of the study for inflammatory biomarkers, and 2) peripheral blood mononuclear cells (PBMC) were isolated using density gradient centrifugation via SepMateTM-50 (Stemcell, Vancouver, BC Canada) as specified by the manufacturer and then cryopreserved with fetal bovine serum (FBS) and Dimethyl
sulfoxide (DMSO).
To stimulate the immune system, a standardized intermittent exercise protocol was used. The exercise test began with a 2-minute warm-up (1-minute unloaded (0 watts) and 1-min 30% of peak wattage obtained during CPET). Participants then completed 10 rounds of 3 minutes of cycling (at 60% of peak wattage obtained during the CPET) followed by 1.5 minutes of rest. In total it amounted to 30 minutes of cycling at 60% of peak wattage obtained during the CPET. Subjects were instructed that they could stand on the bike during the rest stages. Access to water, a fan, and music of choice was allowed. This exercise session has been previously shown to be well-tolerated by both breast (Evans et al., 2015) and prostate (Hanson et al., 2018) cancer survivors and induces an immune response. At the end of the 45-minute exercise session the 0-hour blood draw occurred with the participant seated on the cycle ergometer. Once blood pressure and heart rate return to baseline the participant was transferred to a chair and was given ad libitum access to water but no additional food or drink. The indwelling venous catheter was flushed with saline after the 0-hour draw and half-way through the rest time. After resting for 1-hour the final blood draw occurred.
Body Composition
body mass (LBM), fat tissue mass (FM), and percentage body fat (% BF) were examined. The BW was measured using a high-grade analytical balance-scale (accuracy ± 10 grams).
Calculation of Plasma Volume
Hematocrit and hemoglobin values were used to calculate exercise induced plasma volume shifts by the equation developed by Dill and Costill (1974). Values were obtained from the complete blood count data pre-training and post-training (baseline to 0h shift and baseline to 1h shift). Plasma volume shifts were reported to estimate exercise induced fluid shifts (leukocyte concentration effect).
Blood Analysis
Frozen PBMCs were thawed in a 37°C warm water bath. Then 1mL of room temperature RPMI Complete Media (10% FBS, 1% Penicillin-Streptomycin in RPMI) was added in dropwise manner to the PBMCs. Cells were counted using a TC20 automated cell counted (verified via hemocytometer). Cell viability was verified using Trypan Blue (Bio Rad, CA, USA). Then PBMCs were allowed to rest for 2 hours at 37C and 5% CO2 (confirmed by pilot work). Cell viability was again assessed and then cells were stimulated with 2 ng/mL Phorbol 12-myristate 13-acetate
(PMA) and 1 ng/mL Ionomycin for 4h at 37C and 5% CO2. Cells were phenotyped using immunofluorescence labeling of cell surfaces with mouse anti-human monoclonal antibodies. The following antibodies were used: CD3 (APC-Cy7), CD4 (Amycan), CD8 (AF700), TCR Vα7.2 (PE), CD161 (QDot605). All antibodies were ordered from Biolegend. PBMCs were also intracellularly stained using mouse anti-human monoclonal antibodies in fixation and permeabilization buffer (BD Biosciences, NC USA) to quantify cytokine production [IFN-l
suspended in 300 µL of cell staining buffer for flow cytometry analysis. Cells were analyzed using flow cytometry (LSRII with Diva Software) (BD Biosciences, CA USA) and FlowJo CE software.
Figure 2. Representative Image of MAIT Cell Gaiting Strategy. A. Singlet cells. B. Lymphocytes. C. CD3+ T Cells. D. CD4/CD8 T Cells. E. MAIT Cells.
Experimental Standard
Samples were analyzed in two batches and a standard control was used to ensure stimulation for TNF-α and IFN-γ (Figure 3).
Figure 3: Standard Control for Cytokine Response. A. represents stimulated conditions for IFN-γ. B. represents the unstimulated comparison for IFN-IFN-γ. C. represents stimulated conditions for
TNF-α. D. represents the unstimulated comparison for TNF-α.
Get Real and Heel Exercise Training
training modality were self-selected, and options included: cycling, walking, jogging, elliptical, rowing, or seated stepper. For the first 2-weeks of participation exercise volume and intensities started at 10-15 minutes of low intensity exercise (50-60% of the participants heart rate reserve (HRR) and 8-11 on the Borg Rating of Perceived Exertion scale (RPE)). Exercise duration was reduced by 5-10 minutes for severely deconditioned participants. By the 8th week of the study, the goal was for participants to be exercising for 30 minutes at a moderate intensity (65-75% of the HRR and RPE of 12-14).
Resistance exercise training included six resistance exercises per session, combined with the aerobic exercises previously described. The resistance training targeted large muscle groups: upper body, lower body, and core. The exercises were instructed in a circuit style with each session lastly 30 minutes. Two sets of every exercise were performed for 10-15 repetitions. The intensity progressed from light in week 1-5 (RPE 7-13) to moderate after 5 (RPE 14-15). After week-5 every exercise was performed in 2 sets for 10 repetitions. Modifications were made for orthopedic considerations.
Statistical Analysis
Data was collected and analyzed with SPSS Statistics version 25.0 (SPSS, IN., Durham, NC, USA) and with Jamovi Statistics Version 0.9 (Jamovi Project Computer Software, 2020). Figures were created in GraphPad Prism version 8 (La Jolla, CA, USA). The α level was set a priori for all statistical procedures at α=0.05. Descriptive statistics were used to summarize subject characteristics and values were reported as mean ± SD. Group and time differences for participant characteristics were assessed using a 2 x 3 (group x time) ANOVA with Bonferroni post-hoc analysis. For acute exercise testing, all immune analyses were examined using a linear mixed model. The fixed factors were group and time with subjects as a random effect. Group x time interactions were resolved using simple effects to examine group responses at each time point. Data are presented as mean ± SD with model estimates expressed relative to baseline (time effects) or HC (group effects) and included 95% confidence intervals. Percent change was calculated as 100 × [(final – original)/(original)] where baseline or HC were the original for comparison purposes.
CHAPTER IV: RESULTS
Subjects
Thirteen BC survivors and 13 thirteen HC participants completed the study. The two groups were matched at baseline for age (p=.658) and there were no differences in body composition (total mass, p=.083, lean mass, p=.680, body fat %, p=.949, Table 2) at Pre. Prior to training, self-reported physical activity levels were higher in BC survivors (all p<0.05, Table 2). BC survivors reported 139 minutes of light activity, 113 minutes of moderate activity, and 31 minutes of vigorous activity more than HC.
Subject characteristics were mostly unchanged with exercise training. A significant group x time interaction was present for lean mass % (p=.030), where BC survivors increased lean mass % (1.8% change) while HC lost lean mass % (1.1% change). A similar trend for body fat % was present as well (p=.053), with a decrease body fat % for BC survivors and increase for HC.
Table 2. Subject Characteristics
BC Pre (n=13)
BC Post (n=13)
HC Pre (n=13)
HC Post (n=13)
G X T p value
G p value
T p value
Age (years) 57 (9) 58 (7) .658
Height (cm) 164.5 (9.0) 162.7 (5.5) .724
Total Body Mass (kg) 69.8 (8.6) 70.0 (8.3) 72.3 (19.5) 72.7 (20.8) .737 .751 .549 Lean Mass (kg) 38.7 (3.7) 40.0 (3.0) 41.2 (9.4) 40.7 (10.6) .083 .680 .388 Body Fat (%) 40.9 (7.2) 39.2 (6.4) 39.2 (4.4) 40.4 (5.2) .053 .949 .546 Lean Mass (%) 55.9 (6.8) 57.7 (6.0) 57.6 (3.9) 56.5 (4.7) .030 .947 .625 Physical Activity
Light (min/wk) 155 (188) 16 (37) .004
Moderate (min/wk) 129 (195) 16 (36) .012
Vigorous (min/wk) 35 (49) 4 (13) .013
(pre-All BC survivors were stage I, II, or III (N=5 stage I, N=6 stage II, N=2 stage III), and underwent surgery prior to initiating secondary treatments (radiation, chemotherapy, or both). On average, they were just under 3 months since the completion of final treatment received at the time of enrollment (Table 3). Sixty-two percent of the BC group were post-menopausal while fifty-three percent of the HC group were post-menopausal at the beginning of the study. There were no differences in baseline measures between pre and post-menopausal women in either groups.
Exercise Testing
The physiological responses to CPET and the acute intermittent exercise trial are displayed in Table 4. Average HR and RPE during the acute exercise trial demonstrated no differences between groups or with training. During acute exercise, BC survivors exercised at 85% of their peak HR at both Pre and Post testing while HC was at 86% of peak HR at Pre and 92% of peak HR at Post, despite the same relative intensity (60% of VO2 Peak Wattage).
Table 3. Clinical characteristics of BC Survivors
BC (n=13) Time from last treatment (d) 82 (90) Time from surgery (d) 224 (115) Time from radiation (d) 62 (78) Time from chemotherapy (d) 152 (100) Stage
I (#) 5
II (#) 6
III (#) 2
ER/PR/HER2 Status
ER Positive (#) 12
PR Positive (#) 12
HER2 Positive (#) 4
ER/PR/HER2 Negative (#) 1
Pre-Menopausal (#) 5
Post-Menopausal (#) 8
Abbreviations: BC, Breast Cancer Survivor; d, days; #, number of participants; ER, Estrogen-Receptor; PR, Progesterone-Receptor; HER2, Human Epidermal Growth Factor Receptor 2.
Acute Exercise
Acute Hematological Response
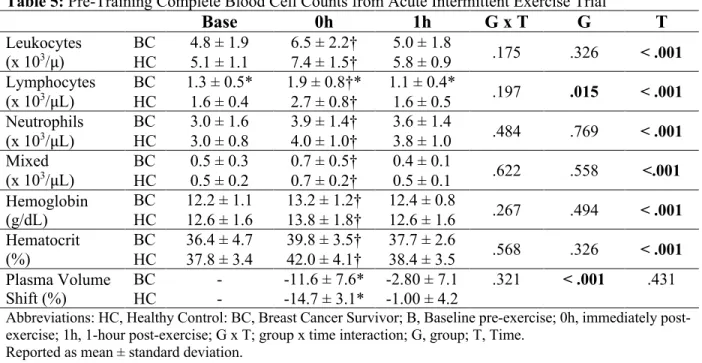
In the first part of this study, the acute response to exercise was assessed prior to the exercise intervention. Leukocyte counts increased by 42 ± 23 % from baseline to immediately post-exercise (0h, p < 0.001), and then decreased by 28% ± 37% from 0h to 1h (p< 0.001) and approached baseline values (Table 5) for both BC survivors and HC groups with no group differences. Exercise and recovery patterns of lymphocyte counts and proportions over time were largely similar to leukocytes, but there was a group difference. HC had 41 ± 0 % higher lymphocytes counts (p= .015) and 26 ± 14% higher frequencies (p= .018) than the BC survivors. Monocytes and neutrophils responded to exercise, but at 1h the neutrophils remain in circulation where monocytes egress back down to baseline with no group differences or interactions present.
Table 4. Physiological responses to VO2 Peak Test and Acute Intermittent Exercise Trial BC Pre (n=13) BC Post (n=13) HC Pre (n=13) HC Post (n=13)
G X T p value
G p value
T p value VO2 Peak
(mL/kg/min) 21.4 (6.6) 22.3 (5.6) 22.5 (2.8) 23.6 (4.5) .860 .523 .164 Peak HR
(bpm) 160 (18) 160 (17) 157 (10) 158 (12) .830 .709 .910 Peak Wattage
(Watt.) 119 (34) 137 (40) 129 (21) 136 (24) .050 .713 <.001 VO2 Peak Test
Duration (min:sec)
9:56
(2:07) (2:22) 11:09 (1:25) 10:17 (2:34) 10:47 .236 .928 .006 Exercise Trial
Wattage 74 (20) 83 (24) 77 (16) 82 (82) .194 .848 <.001 Exercise Trial
RPE 14 (4) 13 (1) 13 (1) 14 (1) .482 .017 .013
Exercise Trial HR
(bpm) 136 (8) 136 (7) 135 (8) 145 (9) .139 .166 .149
Abbreviations: BC, Breast Cancer Survivor; HC, Healthy Control; Pre, Pre-Training; Post, Post-Training; Kg., Kilogram; Wk., Week; G X T, group (BC vs. HC) x time (pre-training vs. post-training); G, group; T, time. Exercise Trial Wattage: 60% of Peak Watt.
Table 5: Pre-Training Complete Blood Cell Counts from Acute Intermittent Exercise Trial
Base 0h 1h G x T G T
Leukocytes
(x 103/µ) BCHC 4.8 ± 1.9 5.1 ± 1.1 6.5 ± 2.2† 7.4 ± 1.5† 5.0 ± 1.8 5.8 ± 0.9 .175 .326 < .001
Lymphocytes
(x 103/µL) BCHC 1.3 ± 0.5* 1.6 ± 0.4 1.9 ± 0.8†* 2.7 ± 0.8† 1.1 ± 0.4* 1.6 ± 0.5 .197 .015 < .001
Neutrophils (x 103/µL)
BC 3.0 ± 1.6 3.9 ± 1.4† 3.6 ± 1.4
.484 .769 < .001
HC 3.0 ± 0.8 4.0 ± 1.0† 3.8 ± 1.0 Mixed
(x 103/µL) BCHC 0.5 ± 0.3 0.5 ± 0.2 0.7 ± 0.5† 0.7 ± 0.2† 0.4 ± 0.1 0.5 ± 0.1 .622 .558 <.001
Hemoglobin (g/dL)
BC 12.2 ± 1.1 13.2 ± 1.2† 12.4 ± 0.8
.267 .494 < .001
HC 12.6 ± 1.6 13.8 ± 1.8† 12.6 ± 1.6 Hematocrit
(%)
BC 36.4 ± 4.7 39.8 ± 3.5† 37.7 ± 2.6 .568 .326 < .001
HC 37.8 ± 3.4 42.0 ± 4.1† 38.4 ± 3.5 Plasma Volume
Shift (%)
BC - -11.6 ± 7.6* -2.80 ± 7.1 .321 < .001 .431
HC - -14.7 ± 3.1* -1.00 ± 4.2
Abbreviations: HC, Healthy Control: BC, Breast Cancer Survivor; B, Baseline pre-exercise; 0h, immediately post-exercise; 1h, 1-hour post-post-exercise; G x T; group x time interaction; G, group; T, Time.
Reported as mean ± standard deviation. † P<0.05 vs. Base
* P<0.05 vs. HC
Pre-Training Acute Response: MAIT Cell Frequencies and Counts
A significant group x time interaction (p<.001, Figure 4A) was observed for MAIT cell counts. At 0h, HC
increased by 137% (72 cells/µL, 95% CI 55, 89; p<.001) and BC survivors increased by 46% (15 cells/µL, 95% CI -2, 33; p=.086), with the change from baseline to 0h being greater in HC than BC
Figure 4. MAIT cell acute exercise response Base (baseline), 0h (immediately following exercise), 1h (1 hour after exercise for A) cell counts and B) cell proportions. Abbreviations: Base, baseline; 0h immediately following exercise; 1h: 1 hour after exercise; BC, breast cancer survivor; HC, healthy control.
†
P<0.05 and‡
P<0.01 vs. Base *P<0.05 and ** P<0.01 vs. HCBase 0h 1h
0 50 100 150 200 V α 7.2 +CD161 +
Cell Count (cells/
µ
L)
A
**,‡
*
Base 0h 1h
0 2 4 6 8 10 BC **,‡ ‡ † V α 7.2 + CD161 + %
(Gated on CD3
+
)
B
survivors (57 cells/µL, 95% CI 33, 81; p<.001). At baseline, BC survivors trended towards having lowered (-37%, p=.057) MAIT cell counts whereby 0h there was a 61% deficit (p<.001), and by 1h, a 42% deficit (p=.021).
A group x time interaction (p<.001, Figure 4B) was also present for MAIT cell percentages. At 0h, HC (1.73%, 95% CI 1.11, 2.35; p<.001) proportions increased but BC survivors’ proportions did not (0.13%, 95% CI -0.49, 0.75; p=.0684) such that the BC group was 2.5% lower in MAIT cell percentages then the HC group (p=.005). At 1h, both groups proportions increased, HC (1.054%, 95% CI .434, 1.674; p<.001) and BC survivors (.806%, 95% CI .186, 1.426; p=.012). There were no group differences in MAIT cell percentages present at baseline (p=.122) or 1h (p=.131).
Pre-Training Acute Response: Cytokine Frequencies and Counts
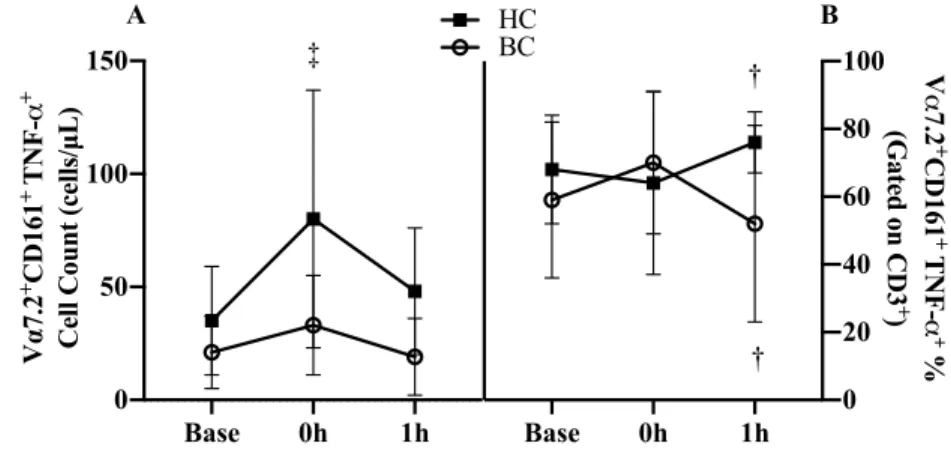
A group x time interaction (p=.017, Figure 5A) was present in MAIT cell TNF-α counts. At 0h, HC increased by 128% (45 cells/µL, 95% CI 29, 60; p<.001) where BC survivors was unchanged (p=.115)
with both groups returning to baseline by 1h. A group x time interaction (p=.019,
Figure 5B) was
present in MAIT cell TNF-α expression percentage. There
were no differences in
Figure 5. MAIT cell TNF-α expression acute exercise response Base (baseline), 0h (immediately following exercise), 1h (1 hour after exercise for A) cell counts and B) cell proportions. Abbreviations: Base, baseline; 0h immediately following exercise; 1h: 1 hour after exercise; BC, breast cancer survivor; HC, healthy control.
†
P<0.05 and‡
P<0.01 vs. Base *P<0.05 and ** P<0.01 vs. HCBase 0h 1h
0 50 100 150 V α 7.2 +CD161 + T
N
F
-α
+
Cell Count (cells/µL)
A
‡
Base 0h 1h
0 20 40 60 80 100 HC BC V α 7.2 + CD161 + T N F -α + %
(Gated on CD3
+
)
B
†
the change from baseline to 0h (p=.136), however, from 0h to 1h, the response diverged with a
decrease in BC survivors while HC increased the percentage of MAIT cells expressing TNF-α (-30.1%, 95% CI -50.17, -10.03; p=.005).
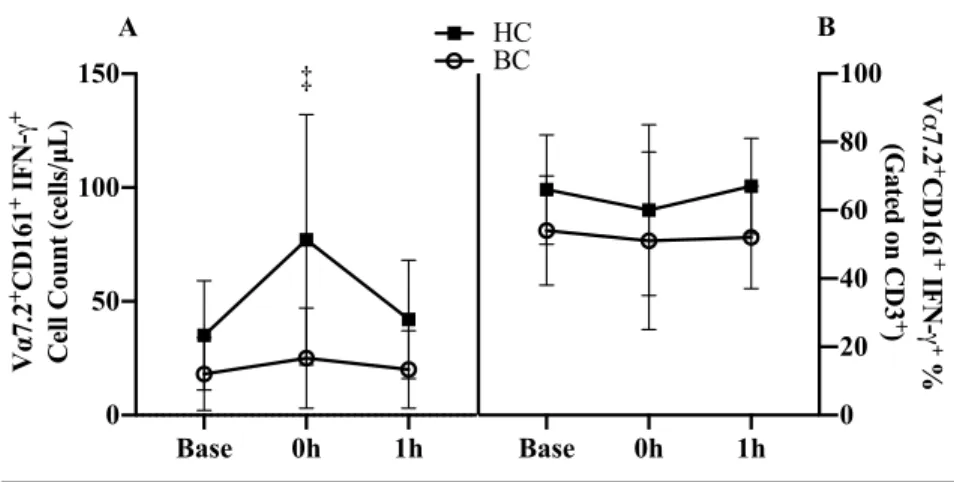
A group x time interaction was present in IFN-γ expressing MAIT cell counts (p=.002, Figure 6A). At 0h, HC increased by 119% (42 cells/µL, 95% CI 28, 56; p<.001) where BC survivors was unchanged (p=.321) with both groups returning to baseline by 1h (Figure 6A). There was a trend of BC survivors tended to have lower IFN-γ expression percentage (-11.9%, 95% CI -.65, 24.4; p=.055, Figure 6B). There was no group x time interaction (p=.801) or time effect (p=.432).
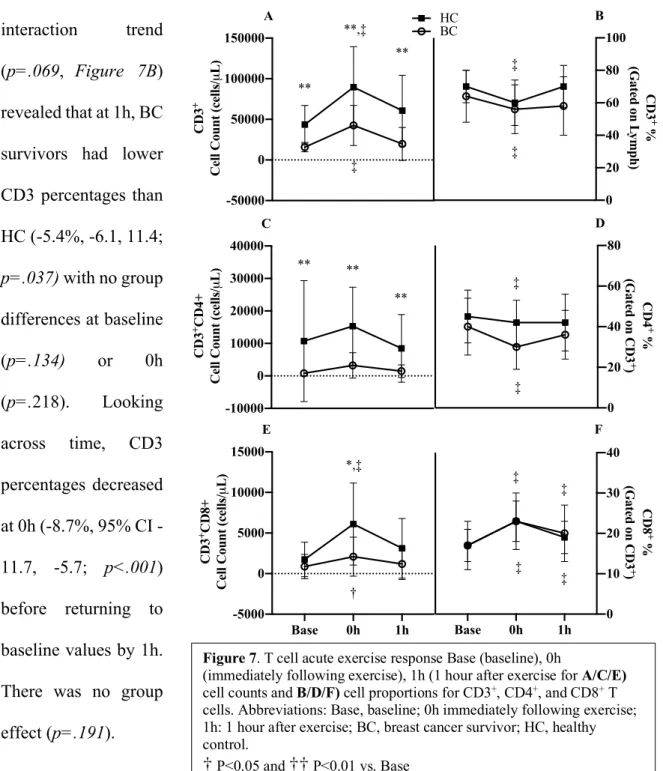
Pre-Training Acute Response:CD3+ T-Cell Frequencies and Counts CD3 cell
counts increased by 123% (36,409 cells/µL, 95% CI 20,650, 52,168; p<.001, Figure 7A) at 0h before returning to baseline at 1h. BC survivors had 60% lower CD3
counts (38,613 cells/µL, 95% CI 22,509, 54,716; p<.001) compared to HC. There was no interaction (p=.479).
Figure 6. MAIT cell IFN-γ expression acute exercise response Base (baseline), 0h (immediately following exercise), 1h (1 hour after exercise for A) cell counts and B) cell proportions. Abbreviations: Base, baseline; 0h immediately following exercise; 1h: 1 hour after exercise; BC, breast cancer survivor; HC, healthy control.
†
P<0.05 and‡
P<0.01 vs. Base *P<0.05 and ** P<0.01 vs. HCBase 0h 1h
0 50 100 150 V α 7.2 +CD161 +
IFN-γ
+
Cell Count (cells/µL)
A
‡
Base 0h 1h
0 20 40 60 80 100 HC BC V α 7.2 + CD161 + IFN-γ+ %
(Gated on CD3
+
)
A group x time interaction trend
(p=.069, Figure 7B)
revealed that at 1h, BC survivors had lower CD3 percentages than HC (-5.4%, -6.1, 11.4;
p=.037) with no group
differences at baseline
(p=.134) or 0h
(p=.218). Looking across time, CD3 percentages decreased at 0h (8.7%, 95% CI -11.7, -5.7; p<.001) before returning to baseline values by 1h. There was no group
effect (p=.191).
Figure 7. T cell acute exercise response Base (baseline), 0h
(immediately following exercise), 1h (1 hour after exercise for A/C/E)
cell counts and B/D/F) cell proportions for CD3+, CD4+, and CD8+ T cells. Abbreviations: Base, baseline; 0h immediately following exercise; 1h: 1 hour after exercise; BC, breast cancer survivor; HC, healthy control.
†
P<0.05 and††
P<0.01 vs. Base *P<0.5 and ** P<0.01 vs. HC-50000 0 50000 100000 150000 CD3 +
Cell Count (cells/
µ L) A **,‡ ‡ ** ** -10000 0 10000 20000 30000 40000 CD3 +CD4+
Cell Count (cells/
µ L) C ** ** **
Base 0h 1h -5000 0 5000 10000 15000 CD3 +CD8+
Cell Count (cells/
µ L) E *,‡ † 0 20 40 60 80 100 HC BC CD3 + %
(Gated on L
ymph) B ‡ ‡ 0 20 40 60 80 CD4 + %
(Gated on CD3
+
)
D
‡
‡
Base 0h 1h 0 10 20 30 40 CD8 + %
(Gated on CD3
Pre-Training Acute Response:CD4+T-Cell Frequencies and Counts
BC survivors had 84% lower CD4 counts (9,665 cells/µL, 95% CI 3,553, 15,778; p=.005,
Figure 7C) compared to HC. There was no interaction (p=.502) or changes over time (p=.113).
CD4 percentages decreased at 0h (-6.5%, 95% CI -10.1, -2.8; p<.001, Figure 7D) before returning to baseline by 1h. BC survivors had a trend toward lower CD4 percentages (7.6%, 95% CI -1.5, 16.3; p=.098). There was no interaction (p=.248).
Pre-Training Acute Response:CD8+ T-Cell Frequencies and Counts
A group x time interaction (p<.001, Figure 7E) was present for CD8 counts. At 0h, HC increased by 47% (4,368 cells/µL, 95% CI 3,234, 5501; p<.001) and BC survivors by 141% (1,222 cells/µL, 95% CI 89, 2,356; p=.035). At 0h, the BC group had 66% less CD8 counts (p=.007) compared to HC. The trend of a group difference persisted by the BC group having 62 % less CD8 cell counts at 1h (p=.052).
CD8 percentages increased from baseline to 0h (5.81%, 95% CI 4.78, 6.84; p<.001) and remained elevated above baseline at 1h (2.50% 95% CI 1.47, 3.53; p<.001). There was no interaction (p=.495) or group effect (p=.953) present (Figure 7F).
Exercise Training
The second part of this study assessed the immune response to acute exercise following a 16-week exercise intervention. The post-training CPET demonstrated 10% greater VO2 peak wattage (p<.001) and 8.5% longer test duration (p=.006) while VO2 peak (p=.164) or peak HR
(p=.910) did not change (Table 4). The absolute wattage for the acute exercise trial increased by
9% (p<.001, Table 4). There was a group x time interaction present for peak wattage. BC survivors
Exercise Adherence and Compliance Of the 48 prescribed
training days, BC survivors completed 72% ± 19% and HC completed 69 ± 19% with no group differences in adherence
(p=.241, Table 6). HC
demonstrated greater compliance to both aerobic (p=.027) and strength training (p=.019). Hematological Response
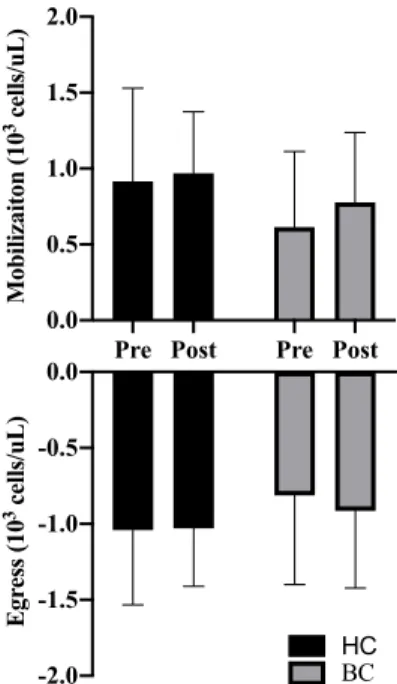
For all immune parameters, mobilization was defined as the change from baseline to 0h and egress was defined
as the change 0h to 1h and are shown as change scores before (Pre) and after (Post) training for both groups. There were no group or training main effects for either mobilization (G: p=.172, T: p=.236) or egress (G: p=.326, T: p=.653) for lymphocyte counts (Figure 8). There was a no group x time interaction (p=.549).
MAIT Cell Mobilization and Egress: Cell Counts
There was a trend for a group x training interaction
(p=0.095, Figure 9A) where BC survivors demonstrated more
than a 2-fold increase in MAIT cell count mobilization from Pre to Post (33 cells/μL, 95% CI 27, 61; p=0.021, d=1.08)
while HC was unchanged (8 cells/μL, 95% CI -13, 29; p=.967, d=0.15). Overall, mobilization Table 6. Adherence and Compliance Data
BC (n=13) HC (n=13) p-value
Adherence (days) 35 (9) 33 (9) .241 Aerobic Compliance (days) 26 (10) 32 (9) .027
Strength Compliance (days) 14 (5) 18 (3) .019
Abbreviations: BC, breast cancer survivor; HC, healthy control Reported in mean (standard deviation)
Pre Post Pre Post 0.0 0.5 1.0 1.5 2.0 Mobilizaiton (10
3 cells/uL)
-2.0 -1.5 -1.0 -0.5 0.0 Egr ess (10
3 cells/uL)
BC HC
Figure 8: Lymphocyte mobilization and egress before and after exercise training. Abbreviations: Pre, Pre-training; Post: Post-Pre-training; CON, Healthy Control, BCS, Breast Cancer Survivor.
increased with training, with a 46% increase at Post (20 cells/μL, 95% CI 6, 35; p=0.009). BC survivor’s mobilization was also 58.4% lower than HC (45 cells/μL, 95% CI 15,74; p=.007, d=1.04). There was a trend for a 34% greater egress (-13 cells/μL, 95% CI -26, 0; p=.056, d=0.368, Figure 9B) at Post. MAIT cell egress was 65% less in BC survivors relative to HC (42 cells/μL, 95% CI -67, -18; p=.002, d=1.18).
MAIT Cell Mobilization and Egress: Frequencies
There was an interaction trend (p=.089) in the mobilization of MAIT cell percentages (-1.1%, 95% CI -2.3,
0.1; p=.089, Figure
9C). There was an
increase in
mobilization (0.87%, 95% CI .04, 2.3;
p=.011, d=.629) from
Pre to Post. There were also group differences with BC survivor mobilization being lower than HC
(-1.0%, 95% CI 0.2, 1.9; p=.028, d=.758). There was increased egress (-0.6%, 95% CI -0.1, -.01; p=0.05, d=.566) (Figure 9D) from Pre to Post and with group differences in egress (-1.1%, 95% CI -1.7, -0.6; p<.001, d=1.12).
Pre Post Pre Post 0 50 100 150 V α 7.2 +CD161 + Cell
Mobilization (cells/ µ L) ## ** A ## -150 -100 -50 0 V α 7.2 +CD161 + Cell
Egr ess (cells/ µ L) BC HC ** B
Pre Post Pre Post 0 1 2 3 4 5 V α 7.2 +CD161 + Fr
equency Mobilization (%) C * # # -3 -2 -1 0 1 2 3 V α 7.2 +CD161 + Fr
equency Egr ess (%) # # ** D
Figure 9. MAIT cell mobilization and egress before (Pre) and after (Post) exercise training for A) cell counts and B) cell proportions. Abbreviations: Pre, pre-training; post, post-training; BCS, breast cancer survivor, CON, healthy control.
MAIT Cell Mobilization and Egress: Cytokine Frequencies and Counts
A group x training interaction trend for MAIT cell TNF-α cell count mobilization was present where BC survivors increased by 75% (28 cells/μL, 95% CI -58, 3; p=.094, Figure 10A) at Post while HC was unchanged. There was a main effect of training, with 83% greater
mobilization (23 cells/μL, 95% CI 7, 38; p=.007) at Post. For egress, there was nearly a 2-fold improvement at Post (41 cells/μL, 95% CI 19, 63; p<.001, Figure 10B) with no group (p=.206) or interaction (p=.890) effects.
A training effect trend was present for MAIT cell TNF-α expression (%) mobilization (12%, 95% CI .15,
24.4; p=.053, Figure
10C). There was no
group (p=.790) or
interaction effect
(p=.661). There were
no group (p=.188),
training (p=.625), or
interaction effects
(p=.717) present for
MAIT cells TNF-α expression (%) egress
(Figure 10D).
Figure 10. MAIT cell TNF-α mobilization and egress before (Pre) and after (Post) exercise training for A/B) cell counts and C/D) cell proportions. Abbreviations: Pre, pre-training; post, post-training; BCS, breast cancer survivor, CON, healthy control.
# P<0.05 and ## P<0.01 vs. Pre (time main effect) *P<0.5 and ** P<0.01 vs. HC (group main effect)
Pre Post Pre Post 0 50 100 150 V α 7.2 +CD161 + TNF-α +
Cell Mobilizaiton (cells/
µ L) A # # -100 -75 -50 -25 0 V α 7.2 +CD161 + TNF-α + Cell Egr ess (cells/uL) B ## ##
Pre Post Pre Post 0 10 20 30 40 50 V α 7.2 +CD161 + TNF-α + Fr
equency Mobilization (%)
For MAIT
cell IFN-γ cell count
mobilization, there
was an 88% increase
(21 cells/μL, 95% CI 10, 32; p<.001,
Figure 11A) at Post.
Additionally, BC
survivors had 65%
less (33 cells/μL, 95% CI 7, 59;
p=.020) cellular
mobilization. For
cellular egress, BC
survivors had 70% less (-29 cells/μL, 95% CI -47, -11; p=.005, Figure 11B) than HC. Egress following training revealed only a trend to increase by 65% (-14 cells/μL, 95% CI -27, -1; p=.060) at Post with no group x training interaction (p=.948).
There were no group (p=.435), training (p=.120), or interactions (p=.816) for MAIT cell
IFN-γ expression (%) mobilization (Figure 11C). There were also no group (p=.928), training
(p=.540), or interactions (p=.967) present for MAIT cell IFN-γ expression (%) egress (Figure
11D).
Figure 11. MAIT cell IFN-γ mobilization and egress before (Pre) and after (Post) exercise training for A/B) cell counts and C/D) cell proportions. Abbreviations: Pre, pre-training; post, post-training; BCS, breast cancer survivor, CON, healthy control.
# P<0.05 and ## P<0.01 vs. Pre *P<0.5 and ** P<0.01 vs. HC
Pre Post Pre Post
0 50 100 150 V α 7.2 +CD161 + INF-γ +
Cell Mobilization (cells/
µ L) A # # * -100 -75 -50 -25 0 V α 7.2 +CD161 + INF-γ + Cell Egr ess (cells/ µ L) B * p=0.06
Pre Post Pre Post
0 10 20 30 40 50 V α 7.2 +CD161 + INF-γ + Fr
equnecy Mobilization (%)
CHAPTER V: DISCUSSION
More women are surviving BC than ever before, but a greater life expectancy now means that these patients must live longer with the adverse effects associated with BC treatment. Exercise training is an established therapy to reduce many of the side effects of anti-cancer treatments, although less is known on how the immune system (and MAIT cells in particular) of BC survivors responds to exercise. The current study, for the first time, examines MAIT cell counts, percentages, and function in BC survivors relative to non-cancer controls (HC) by examining the acute exercise and chronic exercise responses. Prior to the 16-week training program, BC survivors had lower MAIT cell counts and percentages and a differing cytokine response to exercise compared to HC. BC survivors MAIT cells expressing TNF-α percentages were increased above HC at 0h, but then by 1h HC increased to above baseline values were BC survivors dipped below
baseline values. In all other measures of cytokine counts and frequencies BC survivors
demonstrated an attenuated response, likely due to less cells. Following 16-weeks of exercise training, MAIT cell mobilization improved suggesting moderate intensity exercise may be a potential therapy for resolving anti-cancer treatment induced immune dysfunction.
other supervised exercise interventions used with BC (Courneya et al., 2008; Winters-Stone et al., 2012). Moreover, compliance was higher in HC and may have contributed to differences in the responses between groups at Post, although training generally improved the BC survivor’s response such that it was closer to HC, arguing against this possibility. Additionally, time since treatment is a confounding factor in our analysis, as we did not have a non-exercising BC group. To minimize this effect, we recruited only BC survivors within <1 year of treatment and the average time since treatment was 3 months, with no correlation between days since final treatment and MAIT cell counts/percentages at baseline (data not shown). Finally, BC survivors reported more physical activity then HC at PRE, however there was no correlation in self-reported physical activity and MAIT cell response (data not shown). Furthermore, BC survivors MAIT cells displayed an attenuated response to exercise suggesting that if BC survivors are active, they may have other physiological limitations affecting their cellular response to exercise that were not assessed in the current study.