DO AS I SAY; NOT AS I DO:
A COHORT STUDY OF COMMERCIALLY INSURED FAMILIES AND THE RELATIONSHIP BETWEEN PRIOR PARENTAL ADHERENCE AND FUTURE CHILD
ADHERENCE AND PERSISTENCE TO TREATMENT ACROSS FIVE CHRONIC CONDITIONS
David James Nimke
A dissertation submitted to the faculty of the University of North Carolina at Chapel Hill in partial fulfilment of the requirements for the degree of Doctor of Public Health in the Department of Health Policy and Management in the Gillings School of Global Public Health.
Chapel Hill 2018
iii
ABSTRACT
David James Nimke: Do as I say; not as I do: A cohort study of commercially insured families and the relationship between prior parental adherence and future child adherence and persistence
to treatment across five chronic conditions (Under the direction of Stacie Dusetzina)
Numerous factors that influence medication adherence and persistence (MAP) have been identified, and MAP is viewed as a multifactorial process. Children are particularly vulnerable, since their treatment needs are dependent upon a parent or caregiver. This work characterizes MAP in children beginning treatment for attention deficit hyperactivity disorder (ADHD), epilepsy, depression, asthma, and type II diabetes (T2DM) and investigates the potential benefits of incorporating parental and family factors in predictive models for child adherence and
persistence to treatment of these conditions.
iv
Adherence at 180 days was highest in epilepsy and lowest in asthma: epilepsy (62.78%), depression (43.89%), ADHD (34.72%), T2DM (27.43%), and asthma (9.62%). Persistence at 180 days allowing for a 60-day gap in treatment had a similar ranking order: epilepsy (74.38%), depression (57.78%), ADHD (56.57%), T2DM (45.11%), and asthma (19.02%). Younger patient age groups, oral formulation (asthma), and patient, parent, and family prior adherence to chronic medications were consistently associated with better MAP across conditions. The “best”
predictive models across conditions and outcome had c-statistics that ranged from 0.622 to 0.676. Model 4, which contained patient- and parent-level variables, patient’s prior adherence, and parent’s prior adherence, performed the best in 25 out of 30
conditions-outcome-performance measurement scenarios.
v
ACKNOWLEDGEMENTS
This DrPH program is unique in so many ways. I was surrounded by professionals tackling pressing public health issues in a variety of settings: government, foundations, and healthcare systems, to name a few. Every week was a beautiful reminder that public health is a big tent filled with dedicated and talented people working to improve the lives of others. In an age of increasing specialization, I cannot think of an equivalent learning environment where the methods, contributions, and concerns of so many disciplines and their interconnectedness are brought to light. I am also thankful that my classmates and teachers saw beyond “industry” or “big pharma” stereotypes and considered me one of their own. Cohort 10, thank you for all I learned from you and your friendship. Thank you to Pam and my professors for fostering this program.
While pursuing this degree, I was employed by Astellas. Astellas supported me in a number of ways including, but not limited to, tuition assistance and flexibility to attend class and work on this dissertation. While I worked on my first dissertation topic on drug screening for drug safety (childhood adherence and persistence was my second topic), Astellas management approved my proposal for a pilot that was going to be the basis for a dissertation on
vi
I had the good fortune of planning and conducting research with amazing people comprising two dissertation committees. Stacie, Jamie, Chris, Patrick, Sandra, Arlene, and Asheley, thank you for your consideration, guidance, and support of my dissertation. Virginia, thank you for your statistical programming support. Stacie, you were Committee Chair for both of my committees, troubleshot and refined various research ideas, demystified the process, provided advice, and listened. You sustained this effort over the course of a job change for me, a second dissertation topic, emergent home repair(s), and then a job change for you (just to name a few of the topsy-turvy obstacles navigated during this time together). This could have ended differently. Thank you for everything.
Thank you to the Craig family for kindly hosting me on my trips to Chapel Hill for class. We reminisced about our time at Tulane, and we got to catch up on the present. You made your home feel like my home away from home. I miss these trips.
Thank you to my family and friends for their belief in me. I have not been as engaged as I should have been over the past four years, and I am sorry.
Thank you, Mom and Dad. You always provided me with the freedom to pursue my interests. You instilled in me the confidence to apply to and complete this great program. Love you.
vii
viii
TABLE OF CONTENTS
LIST OF TABLES ... xiii
LIST OF FIGURES ... xvi
LIST OF ABBREVIATIONS ... xvii
CHAPTER 1: OVERVIEW ... 1
Problem Statement ... 1
Study Aims ... 3
CHAPTER 2: REVIEW OF PRIOR PUBLISHED RESEARCH ... 5
Background ... 5
The importance of medication adherence and persistence ... 5
Adherence and persistence with chronic medication in children (Aim 1) ... 6
Risk factors for poor adherence or persistence with chronic medication in children (Aims 2 and 3) ... 11
ix
Study Rationale ... 15
Significance... 15
Innovation ... 15
CHAPTER 3: METHODS ... 17
Conceptual Framework for Healthcare Utilization ... 17
Methods for Aim 1 ... 19
Methods for Aims 2 and 3 ... 23
CHAPTER 4: RESULTS ... 26
Results for Aim 1 ... 26
Cohort characteristics... 26
Adherence results by cohort... 33
Adherence results by cohort and patient-level characteristics ... 34
Adherence results by cohort and parent-level characteristics ... 38
Adherence results by cohort and family-level characteristics ... 41
Persistence results by cohort ... 43
x
Persistence results by cohort and parent-level characteristics ... 48
Persistence results by cohort and family-level characteristics ... 52
Results for Aim 2 ... 54
Adherence model performance based on NRI ... 54
Adherence model performance based on c-statistic ... 55
Adherence model performance based on AIC ... 56
Characteristics of variable behavior across conditions in Adherence Model 4 ... 57
Results for Aim 3 ... 60
Persistence model performance based on NRI ... 61
Persistence model performance based on c-statistic ... 62
Persistence model performance based on AIC ... 62
Characteristics of variable behavior across conditions in Persistence Model 4 ... 63
CHAPTER 5: DISCUSSION ... 67
CHAPTER 6: PLAN FOR CHANGE ... 77
Context ... 77
xi
Prioritizing populations for intervention ... 81
Continued research in patient treatment monitoring ... 81
Leverage family health status, behaviors, and habits in future healthcare utilization ... 82
APPENDIX 1: STUDY TREATMENTS AND DIAGNOSES CONSIDERED FOR
INCLUSION IN COHORT ... 84
APPENDIX 2: VARIABLE DEFINITIONS... 86
APPENDIX 3: SUPPLEMENTAL RESULTS ... 89
Mean PDC at 180 days among children initiating treatment for ADHD, Asthma,
Depression, T2DM, and Epilepsy by baseline characteristic. ... 89
Mean PDC at 365 days among children initiating treatment for ADHD, Asthma,
Depression, T2DM, and Epilepsy by baseline characteristic. ... 94
Model coefficients for variables included in adherence at 180 days (PDC ≥ 0.80) models for ADHD. ... 98
Model coefficients for variables included in adherence at 180 days (PDC ≥ 0.80) models for Asthma. ... 101
Model coefficients for variables included in adherence at 180 days (PDC ≥ 0.80) models for Depression. ... 103
Model coefficients for variables included in adherence at 180 days (PDC ≥ 0.80) models for T2DM. ... 106
xii
Model coefficients for variables included in persistence at 180 days models for ADHD. ... 112
Model coefficients for variables included in persistence at 180 days models for Asthma. .... 115
Model coefficients for variables included in persistence at 180 days models for Depression.118
Model coefficients for variables included in persistence at 180 days models for T2DM. ... 121
Model coefficients for variables included in persistence at 180 days models for Epilepsy.... 124
xiii
LIST OF TABLES
Table 1: Methods for estimating adherence. ... 7
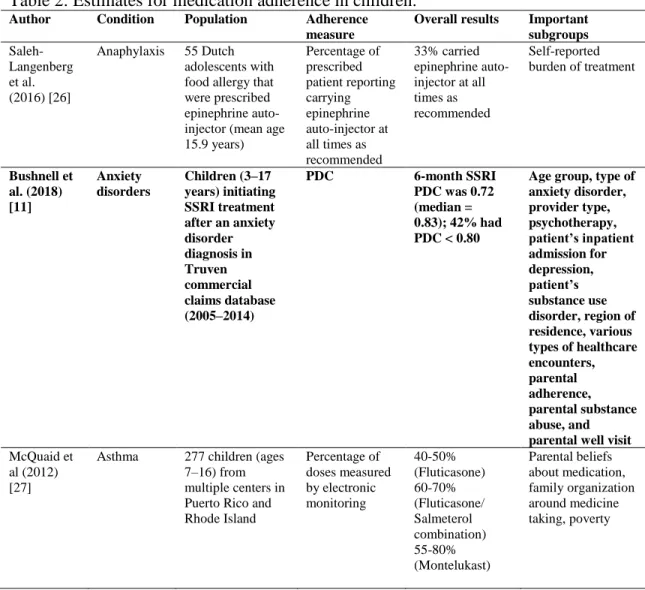
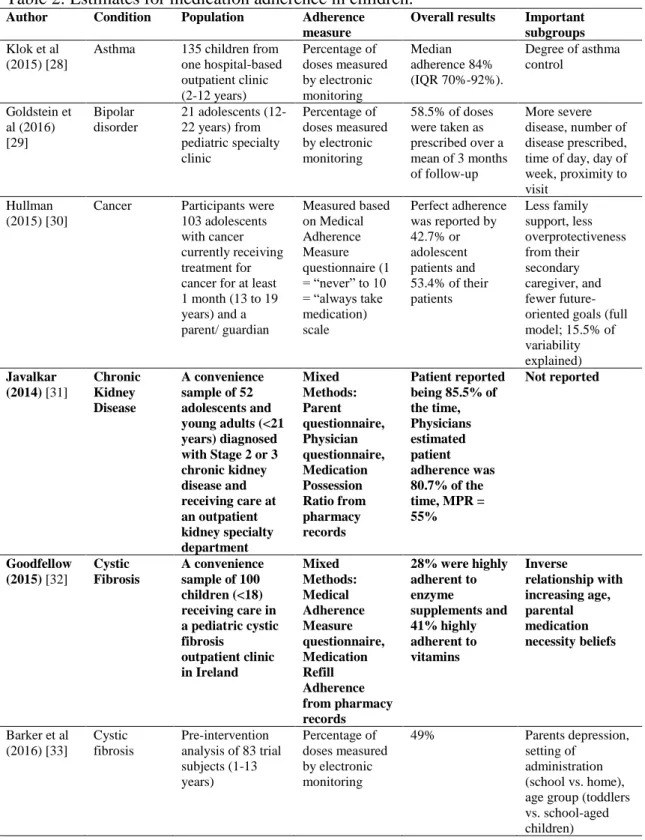
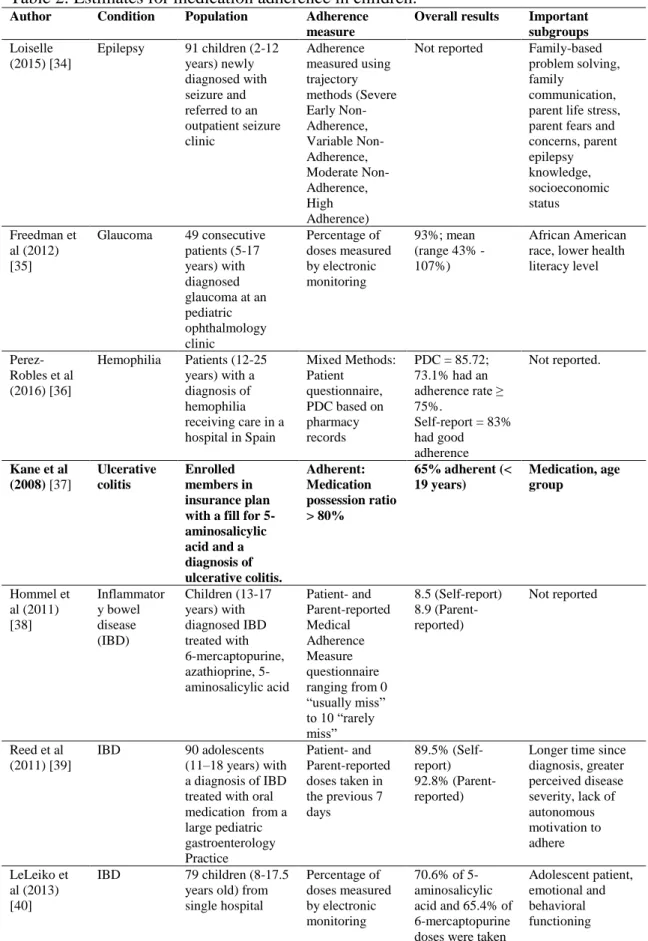
Table 2: Estimates for medication adherence in children. ... 8
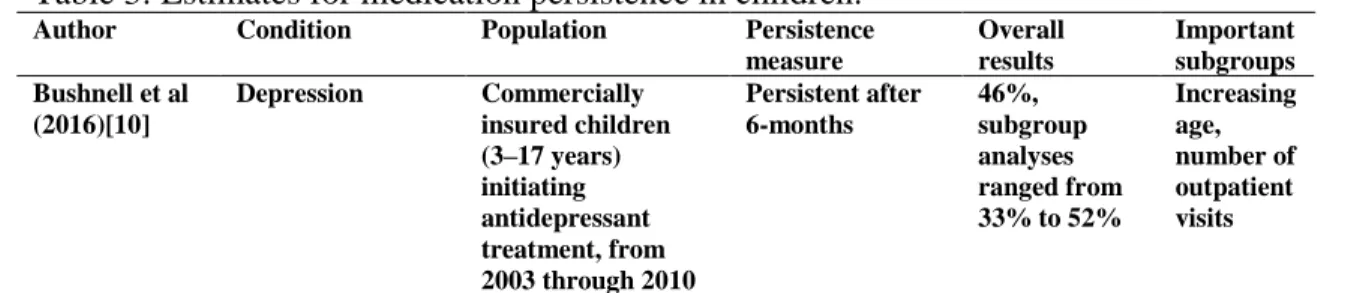
Table 3: Estimates for medication persistence in children. ... 11
Table 4: Variables included in predictive models for child’s MAP. ... 25
Table 5: Population attrition based on study inclusion criteria... 26
Table 6: Baseline patient-level characteristics among children initiating treatment for ADHD, asthma, depression, T2DM, and epilepsy. ... 28
Table 7: Baseline parent-level characteristics among children initiating treatment for ADHD, asthma, depression, T2DM, and epilepsy. ... 30
Table 8: Baseline family-level characteristics among children initiating treatment for ADHD, asthma, depression, T2DM, and epilepsy. ... 32
Table 9: Median PDC, interquartile range (IQR), and proportion with PDC ≥ 0.80 among children initiating treatment for ADHD, asthma, depression, T2DM, and epilepsy. ... 33
Table 10: Unadjusted ORs for adherence at 180 days based on PDC ≥ 80 (PDC ≥ 50 for asthma) among children initiating treatment for ADHD, asthma, depression, T2DM, and epilepsy by patient-level characteristic. ... 36
xiv
Table 12: Unadjusted ORs for adherence at 180 days based on PDC ≥ 80 (PDC ≥ 50 for asthma) among children initiating treatment for ADHD, asthma, depression, T2DM, and epilepsy by family-level characteristic... 42
Table 13: Proportion of children initiating treatment for ADHD, asthma, depression, T2DM, and epilepsy and persisting 180 days and 365 days with allowed treatment gaps of 30 and 60 days. ... 43
Table 14: Unadjusted odds ratios for persistence at 180 days among children initiating treatment for ADHD, asthma, depression, T2DM, and epilepsy by
patient-level characteristic. ... 46
Table 15: Unadjusted ORs for persistence at 180 days among children initiating treatment for ADHD, asthma, depression, T2DM, and epilepsy by parent-level characteristic. . 50
Table 16: Unadjusted ORs for persistence at 180 days among children initiating
treatment for ADHD, asthma, depression, T2DM, and epilepsy by family-level characteristic. . 53
Table 17: Net reclassification measures for six models predicting patient
adherence using patient-, parent-, and family-level variables. ... 55
Table 18: Summary of model performance based on c-statistic for six models predicting patient adherence using patient-, parent-, and family-level variables. ... 56
Table 19: Model performance based on AIC for six models predicting patient
adherence using patient-, parent-, and family-level variables. ... 56
Table 20: Model performance based on AIC, c-statistic, and NRI for six models predicting patient persistence using patient-, parent-, and family-level variables. ... 57
xv
Table 22: Net reclassification measures for six models predicting patient
persistence using patient-, parent-, and family-level variables. ... 61
Table 23: Summary of model performance based on c-statistic for six models
predicting patient persistence using patient-, parent-, and family-level variables. ... 62
Table 24: Model performance based on AIC for six models predicting patient
persistence using patient-, parent-, and family-level variables. ... 63
Table 25: Model performance based on AIC, c-statistic, and NRI for six models
predicting patient persistence using patient-, parent-, and family-level variables. ... 64
xvi
LIST OF FIGURES
Figure 1: The Andersen Healthcare Utilization Model... 18
Figure 2: Mapping of study variables and outcomes to the Andersen
Healthcare Utilization Model. ... 19
Figure 3: Time to discontinuation of children initiating treatment for ADHD, asthma, depression, T2DM, and epilepsy with allowed treatment gaps of 30 and 60 days. ... 44
xvii
LIST OF ABBREVIATIONS
ADHD Attention deficit hyperactivity disorder AIC Akaike information criterion
IBD Inflammatory bowel disease
ICD-9 International Classification of Disease, Ninth Revision MAP Medication adherence and persistence
MPR Medication Possession Ratio NRI Net reclassification index NRIe Event net reclassification index NRIne Nonevent net reclassification index
OR Odds ratio
PDC Proportion of Days Covered
Ref Referent
RMHC Random Mutation Hill Climbing
RR Relative risk
SSRI Selective serotonin reuptake inhibitor T2DM Type 2 diabetes mellitus
1
CHAPTER 1: OVERVIEW
Problem Statement
Nearly half of all Americans have at least one chronic disease; among children the prevalence is nearly one in three [1]. While medications are available to treat many of these conditions, a gap exists between their anticipated and realized benefits. Poor medication
adherence and persistence (MAP) is one reason for this gap, and poor MAP has been associated with increased downstream healthcare utilization and increased mortality [2, 3]. Adherence refers to the extent to which the patient’s behavior matches agreed recommendations from the prescriber [4], while persistence is defined as the duration of time from initiation to
discontinuation of therapy [5].
Numerous factors that influence MAP have been identified, and MAP is viewed as a multifactorial process. In its 2003 seminal report on medication adherence, the World Health Organization (WHO) described five dimensions that influence medication adherence, including social and economic-, therapy-, patient-, condition-, and healthcare team and system-related factors [6]. Despite efforts to improve MAP, poor MAP has proven to be a modifiable but recalcitrant risk factor [2, 3].
Most research in MAP has focused on adults to date. However, the changing
2
notion, highlighting both active and unintentional actions parents take in determining their child’s medical adherence [9]. These qualitative studies have provided insight into how or why poor medication adherence occurred. In contrast, quantitative research approaches can describe the size and magnitude of a problem and potentially identify and predict at-risk groups through modeling. To date, quantitative studies measuring MAP in children have largely focused on single diseases or conditions. Due to inconsistent measures, data sources, and methods, it is difficult to understand heterogeneity in MAP across treatments and conditions. Two cohort studies, one for antidepressant persistence in depression and another for selective serotonin reuptake inhibitor (SSRI) adherence in anxiety disorders, utilized secondary insurance claims data to develop predictive models for MAP in children [10, 11]. Both models had modest predictive performance.
While the previously mentioned study of antidepressant persistence in children considered only patient-level variables in their model [10], the study that attempted to predict SSRI adherence in pediatric anxiety disorders included patient- and parent-level variables [11]. Interestingly, the Bushnell et al. study included parental adherence to several chronic
medications as a potential predictor of poor adherence and found a consistent positive relationship between a child’s adherence to SSRI treatment for anxiety disorder and parental adherence to SSRI, antihypertensive, and statin treatments [11].
3
of one’s disease and the importance of treatment. Given many conditions are familial, parents may have a particularly strong understanding of their child’s condition because the parent might have that condition themselves and have experience with treatment. From a predictive proxy standpoint, concomitant medication burden is higher in adults than children, increasing the opportunity to consider prior adherence to treatments within the family for many more children than considering prior child-level adherence alone. Considered together, parent’s MAP might influence their child’s MAP through multiple means and pathways that may be captured in healthcare utilization data.
Study Aims
Using healthcare utilization data collected in an employer-based insurance claims
database in the United States, this study characterized MAP in children using consistent methods across therapeutic classes and investigated additional parent- and family-level risk factors
present in claims data that hypothetically could improve the identification of children at-risk of poor MAP. The aims of this cohort study were to:
1. Characterize medication adherence and persistence in children initiating chronic medication for attention deficit hyperactivity disorder (ADHD), epilepsy, depression, asthma, and type II diabetes (T2DM);
2. Investigate and characterize the benefits of incorporating parental and family factors (e.g. parent’s MAP, family size, parental chronic disease status, healthcare resource
4
5
CHAPTER 2: REVIEW OF PRIOR PUBLISHED RESEARCH
Background
The importance of medication adherence and persistence
Nearly half of all Americans have at least one chronic disease; among children, the prevalence is one in three [1]. The ability to treat many of these conditions with medication that improve and prolong life is a great achievement. However, a gap exists between the anticipated and realized benefits of medications. There are many reasons for this achievement gap, and in 1985, C. Everett Koop, the U.S. Surgeon General, highlighted drug adherence as one such cause, simply stating; “Drugs don’t work in patients who don’t take them [14].” Decades of research investigating MAP has consistently demonstrated as much [15].
The downstream effects of MAP on patient health largely depend on the disease being treated [2], but poor MAP has been associated with increased downstream healthcare utilization and mortality [2, 3]. In 2010, direct healthcare expenses related to non-adherence for just diabetes, hypertension, and dyslipidemia totaled $105.8 billion in the U.S. [16], representing a large societal burden. MAP has taken on increased importance as the country’s population has aged and healthcare expenses have increased as a percentage of gross domestic product. Meanwhile, the changing epidemiology of many diseases in younger populations [7] has
increased the use of some chronic medications [8, 17] and expenses related to chronic disease [7, 18], meaning that MAP in children is becoming a more important issue.
6
migraines, teeth and jaw disorders, ADHD, diabetes, and depression [1, 7]. In an analysis of healthcare costs from a Michigan health plan, pediatric patients with asthma, ADHD, depression, and diabetes accounted for 30% of the health plan’s total pediatric outpatient costs [7]. While recent trends indicate that the use of many prescriptions drugs in children declined from 2002 to 2010 (systemic antibiotics decreased 14%, allergies decreased 61%, pain decreased 14%,
depression decreased 5%, and cough/cold without expectorant decreased 42%), other
prescriptions drug classes characterized by chronic use increased (asthma increased 14%, ADHD treatment 46%, and contraceptive increased 93%) [17]. Among children and adolescents in the U.S., about 14% were treated chronically with medication based on National Health and Nutrition Examination Survey data collected during 2013–2014. The percentage of the
population chronically treated with medication increased with age: 6.4% of children 0–5 years of age, 16.5% of children 6–12 years of age, and 17.6% of children 13–19 years of age [19].
Adherence and persistence with chronic medication in children (Aim 1)
7 Table 1: Methods for estimating adherence.
Methods Strengths Weaknesses
Indirect measurements
Patient/caregiver questionnaires and interviews
Simple and inexpensive Self-reporting may be biased due to recall or desire to be viewed as compliant
Pill count Simple, objective, quantifiable Easily altered by the patient
Prescription filling patterns Objective; easy to obtain data Prescription filling is not necessarily equivalent to drug usage
Patient clinical response Simple; generally easy to perform
Potentially biased by other factors that influence clinical response
Electronic monitoring Precise; results are easily
quantified;
tracks patterns of taking medication
Expensive; requires return visits or data transfers from medication
Vials
Physiologic markers Often easy to perform Individual variability can lead to
misclassification of adherence
Patient diaries Help to correct for poor recall Subject to self-reporting biases and record alteration
Direct measurements
Directly observed therapy Most accurate Impractical
Measurement of drug/metabolite levels in the body
Objective, quantifiable Relatively intrusive, potentially expensive, individual variability can lead to
misclassification of adherence
Measurement of biomarkers in the body Objective, quantifiable Relatively intrusive, potentially expensive, individual variability can lead to
misclassification of adherence Source: Osterberg et al. [12]
The two most common measures used to estimate medication adherence based on prescription filling patterns are Proportion of Days Covered (PDC) and Medication Possession Ratio (MPR). Due to confusion and inconsistency in the manner in which these calculations have been performed, described, and labeled, Raebel and colleagues recently published a review and unifying framework for the terminologies and definitions used for MAP [20]. Both PDC and MPR are based on dispensed days supply during a specified period. Within Raebel’s framework, PDC ranges from 0 to 100 percent, reflecting the percentage of days where the patient had a day’s supply on hand during the period; MPR is not bounded at 100 percent and “over adherence” stemming from early fills is allowed [20].
8
and patient populations (Tables 2 and 3, respectively; studies utilizing secondary prescription data are bolded). Taken together, these studies suggest that MAP in children is often low. However, it is difficult to draw conclusions across conditions and populations due to non-standard research approaches and analyses of singular medical conditions or therapies (the exception in children being a study by Fischer et al. [21]). This pales in comparison to the existing evidence for MAP in adults where multiple studies have assessed MAP across therapeutic areas and conditions and characterized variability [21-25].
Table 2: Estimates for medication adherence in children. Author Condition Population Adherence
measure
Overall results Important subgroups
Saleh-Langenberg et al. (2016) [26]
Anaphylaxis 55 Dutch adolescents with food allergy that were prescribed epinephrine auto-injector (mean age 15.9 years) Percentage of prescribed patient reporting carrying epinephrine auto-injector at all times as recommended
33% carried epinephrine auto-injector at all times as recommended
Self-reported burden of treatment
Bushnell et al. (2018) [11] Anxiety disorders Children (3–17 years) initiating SSRI treatment after an anxiety disorder diagnosis in Truven commercial claims database (2005–2014)
PDC 6-month SSRI PDC was 0.72 (median = 0.83); 42% had PDC < 0.80
Age group, type of anxiety disorder, provider type, psychotherapy, patient’s inpatient admission for depression, patient’s substance use disorder, region of residence, various types of healthcare encounters, parental adherence, parental substance abuse, and parental well visit
McQuaid et al (2012) [27]
9
Table 2: Estimates for medication adherence in children. Author Condition Population Adherence
measure
Overall results Important subgroups
Klok et al (2015) [28]
Asthma 135 children from one hospital-based outpatient clinic (2-12 years) Percentage of doses measured by electronic monitoring Median adherence 84% (IQR 70%-92%).
Degree of asthma control Goldstein et al (2016) [29] Bipolar disorder
21 adolescents (12-22 years) from pediatric specialty clinic Percentage of doses measured by electronic monitoring
58.5% of doses were taken as prescribed over a mean of 3 months of follow-up
More severe disease, number of disease prescribed, time of day, day of week, proximity to visit
Hullman (2015) [30]
Cancer Participants were 103 adolescents with cancer currently receiving treatment for cancer for at least 1 month (13 to 19 years) and a parent/ guardian Measured based on Medical Adherence Measure questionnaire (1 = “never” to 10 = “always take medication) scale
Perfect adherence was reported by 42.7% or adolescent patients and 53.4% of their patients Less family support, less overprotectiveness from their secondary caregiver, and fewer future-oriented goals (full model; 15.5% of variability explained)
Javalkar (2014) [31]
Chronic Kidney Disease
A convenience sample of 52 adolescents and young adults (<21 years) diagnosed with Stage 2 or 3 chronic kidney disease and receiving care at an outpatient kidney specialty department Mixed Methods: Parent questionnaire, Physician questionnaire, Medication Possession Ratio from pharmacy records Patient reported being 85.5% of the time, Physicians estimated patient adherence was 80.7% of the time, MPR = 55%
Not reported
Goodfellow (2015) [32]
Cystic Fibrosis
A convenience sample of 100 children (<18) receiving care in a pediatric cystic fibrosis outpatient clinic in Ireland Mixed Methods: Medical Adherence Measure questionnaire, Medication Refill Adherence from pharmacy records
28% were highly adherent to enzyme supplements and 41% highly adherent to vitamins Inverse relationship with increasing age, parental medication necessity beliefs
Barker et al (2016) [33]
Cystic fibrosis
Pre-intervention analysis of 83 trial subjects (1-13 years) Percentage of doses measured by electronic monitoring
49% Parents depression,
10
Table 2: Estimates for medication adherence in children. Author Condition Population Adherence
measure
Overall results Important subgroups
Loiselle (2015) [34]
Epilepsy 91 children (2-12 years) newly diagnosed with seizure and referred to an outpatient seizure clinic Adherence measured using trajectory methods (Severe Early Non-Adherence, Variable Non-Adherence, Moderate Non-Adherence, High Adherence)
Not reported Family-based problem solving, family
communication, parent life stress, parent fears and concerns, parent epilepsy knowledge, socioeconomic status Freedman et al (2012) [35]
Glaucoma 49 consecutive patients (5-17 years) with diagnosed glaucoma at an pediatric ophthalmology clinic Percentage of doses measured by electronic monitoring 93%; mean (range 43% - 107%)
African American race, lower health literacy level
Perez-Robles et al (2016) [36]
Hemophilia Patients (12-25 years) with a diagnosis of hemophilia receiving care in a hospital in Spain
Mixed Methods: Patient
questionnaire, PDC based on pharmacy records
PDC = 85.72; 73.1% had an adherence rate ≥ 75%.
Self-report = 83% had good adherence
Not reported.
Kane et al (2008) [37]
Ulcerative colitis
Enrolled members in insurance plan with a fill for 5-aminosalicylic acid and a diagnosis of ulcerative colitis. Adherent: Medication possession ratio > 80%
65% adherent (< 19 years) Medication, age group Hommel et al (2011) [38] Inflammator y bowel disease (IBD) Children (13-17 years) with diagnosed IBD treated with 6-mercaptopurine, azathioprine, 5-aminosalicylic acid Patient- and Parent-reported Medical Adherence Measure questionnaire ranging from 0 “usually miss” to 10 “rarely miss”
8.5 (Self-report) 8.9 (Parent-reported)
Not reported
Reed et al (2011) [39]
IBD 90 adolescents
(11–18 years) with a diagnosis of IBD treated with oral medication from a large pediatric gastroenterology Practice
Patient- and Parent-reported doses taken in the previous 7 days
89.5% (Self-report) 92.8% (Parent-reported)
Longer time since diagnosis, greater perceived disease severity, lack of autonomous motivation to adhere LeLeiko et al (2013) [40]
IBD 79 children (8-17.5
years old) from single hospital
Percentage of doses measured by electronic monitoring
70.6% of 5-aminosalicylic acid and 65.4% of 6-mercaptopurine doses were taken
11
Table 2: Estimates for medication adherence in children. Author Condition Population Adherence
measure
Overall results Important subgroups Fischer et al
(2010) [21]
Various 75,589 patients (9,417 under 19 years) treated by 1,217 prescribers in a community-based e-prescribing initiative Percentage of prescriptions filled divided by the total number of prescriptions written
85.5% (under 19 years) 94.4% (antimicrobial) 79.1% (neuropsychiatri c) 88.7% (asthma) 81.9% (dermatologic) Medication class
IBD: inflammatory bowel disease; SSRI Selective serotonin reuptake inhibitor
Table 3: Estimates for medication persistence in children. Author Condition Population Persistence
measure
Overall results
Important subgroups Bushnell et al
(2016)[10]
Depression Commercially insured children (3–17 years) initiating antidepressant treatment, from 2003 through 2010
Persistent after 6-months 46%, subgroup analyses ranged from 33% to 52%
Increasing age, number of outpatient visits
Risk factors for poor adherence or persistence with chronic medication in children (Aims 2
and 3)
MAP has proven to be a modifiable but recalcitrant risk factor [2, 3] due to its multifactorial origins. In a 2003 report, WHO described five dimensions that influence medication adherence, including social and economic-, therapy-, patient-, condition-, and
healthcare team and system-related factors [6]. Non-adherence should not be viewed as a patient problem, but a “fundamental limitation in the delivery of healthcare” that may be due to factors beyond a patient’s control [4].
12
are entirely dependent on their caregivers for remembering to, deciding to, and correctly
administering their medications. The caregiver must meanwhile act accordingly even when faced with an uncooperative child. Once a child is school-aged, medication administration may occur during school requiring additional coordination between caregivers and school nurses [12]. Eventually, most children reach a transitional period where they are expected to take
responsibility for more of their self-care [12].
In a systematic review of qualitative studies that investigated parents’ and caregivers’ accounts for reasons of medication non-adherence in their children across multiple conditions, researchers identified six themes in the published literature. Findings included: (1) caregiver beliefs about the condition or treatment; (2) difficulty of treatment regimen; (3) child resistance; (4) relationships within families; (5) preserving “normal life;” and (6) input from healthcare professionals [41]. These themes manifest themselves in a variety of ways. For instance, research from Ahmed [42] and Barnard-Brak [43] describe parents actively managing drug therapy for ADHD in order to mitigate side effects, reduce anxiety related to concerns over long-term use, and lessen disease-associated stigmas related to parenting and reliance on pharmacotherapy. Interestingly, the use of treatment “holidays” or “vacations” differed by parenting role (Father/Mother) and sex of child (Son/Daughter) [43].
Prior statistical modeling of adherence or persistence with chronic medication in children
in secondary data (Aims 2 and 3)
13
and patient [37] and physician characteristics [21] (for 5-aminosalycylic acid and multiple therapy classes, respectively). Neither study modeled potential factors influencing drug adherence in children.
Bushnell et al. [10] conducted a study to identify predictors of six-month persistence on antidepressants based on data collected in administrative claims. Their study separately assessed commercially insured children (3–17 years) and adults (18–64 years) with major depressive disorder who initiated antidepressant treatment during January 1, 2003 through February 28, 2010. Persistence was treated as a dichotomous endpoint; a patient was characterized as non-persistent if treatment was discontinued prior to 180 days after the index antidepressant’s dispensing date. Treatment discontinuation occurred if a patient’s prescription fill did not occur within 30 days of the last day supplied of their previous fill. Persistence among children on antidepressant treatment for 6 months was low (46%), with little variability across the subgroups analyzed. Modest increases in risk of non-persistence were seen among older children (56%), children with a history of diagnosed anxiety (49%), substance use (66%), or recurrent major depressive disorder (55%), children with initial non-low doses of antidepressant medication (55%), and children with greater than nine outpatient visits. Bushnell et al. attempted to use these variables as well as other baseline data from insurance claims to predict 6-month persistence. Other potential predictors of persistence measured in the year prior to initiation included age group, sex, selected co-morbidities, healthcare utilization, antidepressant class (SSRI, serotonin and norepinephrine reuptake inhibitors), prior suicide attempt, prescription opiate usage,
14
It is important to note that the previously described antidepressant persistence study by Bushnell et al. considered only patient-level variables in the model; no parent- or
family-associated variables were included [10]. Secondary data sources, like insurance claims databases, can contain parent- and family- level data by utilizing family identifiers and indicators for family membership. In a study of SSRI adherence in pediatric anxiety disorders, Bushnell et al. included patient-level variables and parent-level variables and identified potential parent-level factors worthy of additional research[11].
Using administrative data from Truven MarketScan Commercial Claims and Encounters, Bushnell et al. analyzed 70,797 children with pediatric anxiety disorder initiating SSRI
15
Study Rationale
Significance
While qualitative studies have produced rich insights into the reasons for low MAP in children, they are poorly suited for identifying children at risk of poor MAP. In the absence of this basic understanding of MAP in children, we are left operating under an assumption that the findings for adults are generalizable. This is likely inadequate, because some factors associated with MAP in adults may not be present in children (e.g., a child’s prior medication adherence for chronic medication use) and the chronic diseases that afflict adults and children differ. The potential need for considering MAP in children is underscored by the fact that Bushnell et al. [10] ultimately modeled antidepressant treatment non-adherence separately for children and adults. Their results suggest that the mechanisms of non-adherence may differ in important risk factors, or these factors may contribute to differing degrees of magnitude [10].
One of the better predictors of adherence is a patient’s prior adherence to medication [10, 44]. Prior adherence also requires a history of success or failure with a medication regimen. In the case of non-adherence, the absence of adequate indicators represents missed opportunities to improve care. This indicator may be unavailable in many children, because they may be
receiving a diagnosis and treatment for their first chronic disease and have not had any
experiences with disease management. Among U.S. children, approximately 7% have more than one chronic condition [1].
Innovation
Because young children are reliant upon caregivers to administer treatments, it is
16
child’s MAP. Comorbid burden is higher in adults than children, so the opportunity to consider prior adherence within the family exists for many children. Additionally, multiple risk factors for non-adherence are shared at the family level (e.g., insurance status and socioeconomic status) [12]. Individual factors that influence a parent’s adherence, like knowledge of the disease or psychological problems (e.g., depression) [12], may influence their child’s situation as well [13]. Another strong predictor of adherence is knowledge and awareness of one’s disease and the importance of treatment. Given many conditions are familial, parents may have a particularly close understanding of their child’s condition, because the parent might themselves have that condition and may have experience with treatment. Considered together, a parent’s adherence with medication might influence their child’s adherence with medication through multiple means and pathways.
17
CHAPTER 3: METHODS
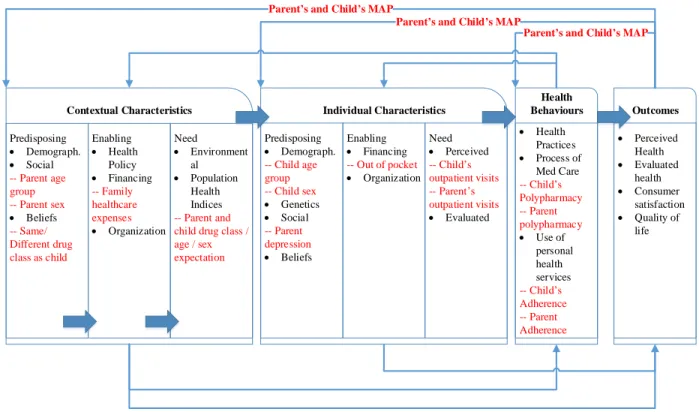
Conceptual Framework for Healthcare Utilization
This study utilized a conceptual framework proposed by Andersen et al. that was developed to explain individual access to medical care [45]. The framework is composed of contextual and individual characteristics, health behaviors, and outcomes [45]. Contextual and individual characteristics may predispose individuals to use or avoid receiving care
(predisposing), enable individuals through facilitation or hindrance (enabling or hindering), or be widely recognized by laypersons and/or healthcare providers as requiring care (need). Contextual characteristics are aggregate-level characteristics (e.g., elderly population, education level, crime rate, health policy, water quality), while individual characteristics pertain to the patient accessing care (e.g., patient age, family support, financial wherewithal, perceived need for care). Health behaviors include personal health practices (e.g., diet, adherence to medical regimens), process of medical care (e.g., patient counseling, professional guidelines), and use of personal health services. These factors (contextual and individual characteristics and health behaviors) influence perceived health status of the patient, health status evaluated by the healthcare provider,
18
Contextual Characteristics Individual Characteristics Health
Behaviours Outcomes
Need • Environment
al • Population
Health Indices
• Personal Health Practices • Process of
Medical Care • Use of
personal health services Enabling
• Health Policy • Financing • Organization Predisposing
• Demograph. • Social • Beliefs
Need • Perceived • Evaluated Enabling
• Financing • Organization Predisposing
• Demograph. • Genetics • Social • Beliefs
• Perceived Health • Evaluated
health • Consumer
satisfaction • Quality of
life
Figure 1: The Andersen Healthcare Utilization Model [44].
With regard to this study, this framework in combination with a literature review was used to identify candidate predictors for poor MAP. Additionally, the Andersen framework [45] provided theoretical grounds for understanding how these factors may relate to one another and to MAP. The methods of each aim include a mapping of study variables to framework
19 Outcomes Health Behaviours Individual Characteristics Contextual Characteristics Need • Environment
al • Population
Health Indices -- Parent and child drug class / age / sex expectation
• Health Practices • Process of
Med Care -- Child s Polypharmacy -- Parent polypharmacy • Use of
personal health services -- Child s Adherence -- Parent Adherence Enabling
• Health Policy • Financing -- Family healthcare expenses • Organization Predisposing
• Demograph. • Social -- Parent age group -- Parent sex • Beliefs -- Same/ Different drug class as child
Need • Perceived -- Child s outpatient visits -- Parent s outpatient visits • Evaluated Enabling
• Financing -- Out of pocket • Organization Predisposing
• Demograph. -- Child age group -- Child sex • Genetics • Social -- Parent depression • Beliefs
• Perceived Health • Evaluated
health • Consumer
satisfaction • Quality of
life Parent s and Child s MAP
Parent s and Child s MAP
Parent s and Child s MAP
Figure 2: Mapping of study variables and outcomes to the Andersen Healthcare Utilization Model.
Methods for Aim 1
20
required to have at least one claimed diagnosis for the condition being treated (Appendix 1) during the 365 days prior to index date for inclusion in the analysis. Patient families required sufficient data quality for inclusion in the study. These criteria for the family at index date were that the family had only one employee listed in the enrollment file, had no more than one spouse listed in the enrollment file, had employee (and spouse if listed) ≥18 years of age, and had dependents (if listed) less than 26 years of age.
In addition to the eligibility criteria described above, patients were required to have at least one claim for a study drug of sufficient quality for inclusion in the analysis. Returns and adjustments in pharmacy data were accounted for by summing days supply and cost variables on pharmacy claims by patient identifier, date of drug dispensing, and National Drug Code number. This approach is often used to account for pharmacy returns. Those claims where total cost and days supply were less than or equal to zero after accounting for adjustments and returns were treated as claims where no drug was dispensed. Where days supply was less than or equal to zero and total cost was greater than zero, indicating that the claim was paid, days supply was imputed using the median days supply for that patient for that drug during the study period.
21
Parent-level variables were based on aggregated claims and enrollment information for the employee (and spouse if present). For simplicity in terminology, employees and spouses were considered parents with full acknowledgment that these benefit arrangements may differ from family/societal roles and terms. Parent-level variables defined at index included the
presence of a female parent, presence of a male parent, and parent age group. The lead-in period was analyzed to determine whether a parent had been dispensed the same drug as the child’s treatment drug, identify prior diagnosis for depression, count outpatient visits for each parent, and identify prior inpatient visits. For parent age group at index, average age for the parent(s) was calculated and grouped. For outpatient visits, the sum of outpatient visits was divided by the number of parents in the family yielding an outpatient visits per parent.
Family-level variables were based on aggregated claims and enrollment information for the employee, spouse (if present), patient, and other dependents (if present). These variables included the number of dependents other than the patient, the number of medications per family member taken at index, the number of outpatient visits per family member during the lead-in period, the presence of an inpatient visit during the lead-in period, and all-cause medical expenses per family member during the lead-in period.
22
Persistence was defined as continuing treatment through 180 days and 365 days after index. Two definitions for discontinuation were tested: discontinuation was defined as the absence of a prescription fill (1) within 30-days following the end of available therapy (calculated from fill dates and days of supply); and (2) within 60-days following the end of available therapy.
A measure of prior adherence was developed based on previous work by Bushnell et al. [11]. The Thompson Reuters Red Book is a drug dictionary that contains a field indicating whether the drug is typically used for “primarily acute,” for “acute or chronic,” or for “primarily chronic” purposes. Outpatient prescription claims for fixed dose oral prescription drugs (e.g., tablets and capsules) used for primarily chronic purposes were identified for each family member (including the patient) during the 7 to 12 months prior to the patient’s index date. This
represented the chronic medications taken by each family member in the study. For each family member, PDC was estimated for each of their chronic medications during the 6-month period prior to index date. Consequently, PDC could range from 0.00 to 1.00. An average PDC was then calculated across prior chronic medications for the patient, among their parent(s), and among the family (including the patient). Average PDC for the patient, parents, and family was categorized as ≥ 0.80, < 0.80, or “no chronic medications dispensed.”
23
persistent patients were reported along with characteristics of the distribution for PDC (e.g., means, median, standard deviation, and interquartile range).
Methods for Aims 2 and 3
The patients analyzed in Aim 1 were analyzed for Aims 2 and 3 as well. Multivariate analyses of the relationship between a child’s 180-day risk of being adherent/persistent was estimated using a modified Poisson regression approach described by Zou et al. [43, 44]. The benefit of this approach is direct estimation of the relative risk when the anticipated study outcomes (i.e., adherence and persistence at 180 days post-initiation) is not likely to be rare.
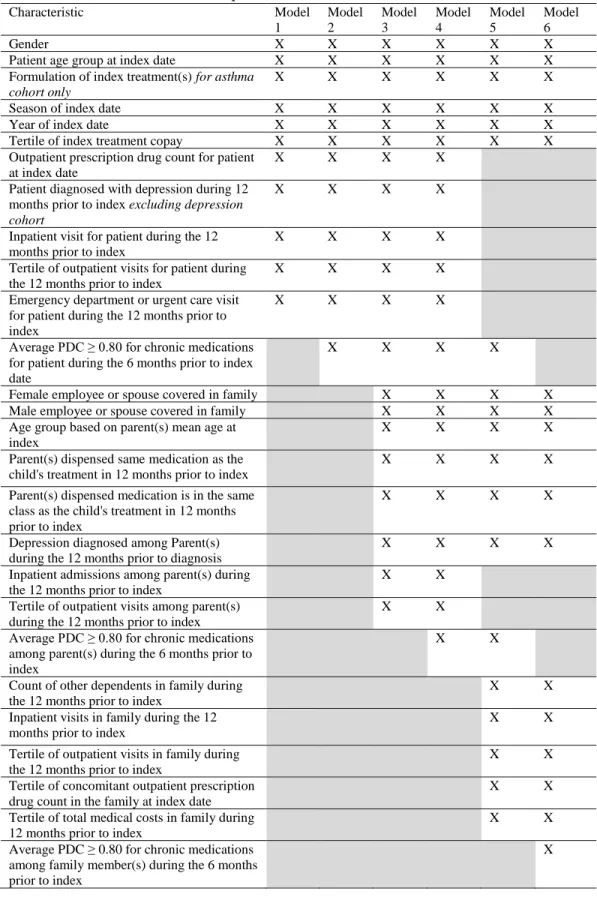
Variables included in each of the prediction models for treatment adherence and
persistence are presented in Table 4. Model 1 contained patient-level variables. In Model 2, the patient’s (child’s) prior adherence to chronic medication was added as a covariate. Model 3 included parent-level variables and the variables included in Model 2. Model 4 added parental prior adherence to chronic medication as a covariate. Model 5 was a departure from this general trend in some ways, since it explored the performance of family-level variables as proxies for patient- and parent-level variables. Model 6 added family-level prior adherence to chronic medication as a covariate and removed patient and parent prior adherence.
Predictive performance of the models was described based on Akaike Information Criterion (AIC), the concordance c-statistic, and net reclassification improvement (NRI).
24
NRI is a relatively new measure of incremental improvement from the addition of a new variable to a model represented by the equation [50]:
𝑁𝑅𝐼 = 𝑃(𝑢𝑝|𝑒𝑣𝑒𝑛𝑡) − 𝑃(𝑑𝑜𝑤𝑛|𝑒𝑣𝑒𝑛𝑡) + 𝑃(𝑑𝑜𝑤𝑛|𝑛𝑜𝑛𝑒𝑣𝑒𝑛𝑡) − 𝑃(𝑢𝑝|𝑛𝑜𝑛𝑒𝑣𝑒𝑛𝑡)
Where P represents a proportion of patients given whether or not they had the event (event versus nonevent) and the new risk score calculated from the model increased (up) or decreased (down) relative to a referent base model. NRI is essentially composed of “event NRI” (NRIe) and “nonevent NRI” (NRIne) [50, 51]:
𝑁𝑅𝐼𝑒 = 𝑃(𝑢𝑝|𝑒𝑣𝑒𝑛𝑡) − 𝑃(𝑑𝑜𝑤𝑛|𝑒𝑣𝑒𝑛𝑡)
𝑁𝑅𝐼𝑛𝑒 = 𝑃(𝑑𝑜𝑤𝑛|𝑛𝑜𝑛𝑒𝑣𝑒𝑛𝑡) − 𝑃(𝑢𝑝|𝑛𝑜𝑛𝑒𝑣𝑒𝑛𝑡)
NRI was used to summarize any improvement in the distribution of children correctly classified as non-adherent/adherent and not persistent/persistent when additional variable(s) were
considered [10, 46, 50, 51].
Because prediction performance can increase by increasing the number of variables included in a model, AIC was considered as a third measure of model performance. AIC is a negative log-likelihood measure that includes a penalty term for the number of parameters or variables included in the model:
𝐴𝐼𝐶 = −2(𝑙𝑜𝑔 − 𝑙𝑖𝑘𝑒𝑙𝑖ℎ𝑜𝑜𝑑) + 2𝐾
25
Table 4: Variables included in predictive models for child’s MAP.
Characteristic Model
1 Model 2 Model 3 Model 4 Model 5 Model 6
Gender X X X X X X
Patient age group at index date X X X X X X
Formulation of index treatment(s) for asthma cohort only
X X X X X X
Season of index date X X X X X X
Year of index date X X X X X X
Tertile of index treatment copay X X X X X X
Outpatient prescription drug count for patient at index date
X X X X
Patient diagnosed with depression during 12 months prior to index excluding depression cohort
X X X X
Inpatient visit for patient during the 12 months prior to index
X X X X
Tertile of outpatient visits for patient during the 12 months prior to index
X X X X
Emergency department or urgent care visit for patient during the 12 months prior to index
X X X X
Average PDC ≥ 0.80 for chronic medications for patient during the 6 months prior to index date
X X X X
Female employee or spouse covered in family X X X X
Male employee or spouse covered in family X X X X
Age group based on parent(s) mean age at index
X X X X
Parent(s) dispensed same medication as the child's treatment in 12 months prior to index
X X X X
Parent(s) dispensed medication is in the same class as the child's treatment in 12 months prior to index
X X X X
Depression diagnosed among Parent(s) during the 12 months prior to diagnosis
X X X X
Inpatient admissions among parent(s) during the 12 months prior to index
X X
Tertile of outpatient visits among parent(s) during the 12 months prior to index
X X
Average PDC ≥ 0.80 for chronic medications among parent(s) during the 6 months prior to index
X X
Count of other dependents in family during the 12 months prior to index
X X
Inpatient visits in family during the 12 months prior to index
X X
Tertile of outpatient visits in family during the 12 months prior to index
X X
Tertile of concomitant outpatient prescription drug count in the family at index date
X X
Tertile of total medical costs in family during 12 months prior to index
X X
Average PDC ≥ 0.80 for chronic medications among family member(s) during the 6 months prior to index
26
CHAPTER 4: RESULTS
Results for Aim 1
Cohort characteristics
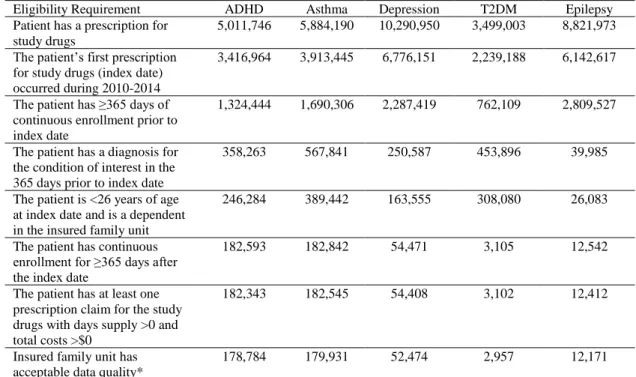
Patients meeting inclusion and exclusion criteria for the study totaled 178,784 for the ADHD cohort, 179,931 for the asthma cohort, 52,474 for the depression cohort, 2,957 for the T2DM cohort, and 12,171 for the epilepsy cohort. Attrition based on applied inclusion/exclusion criteria is presented for each cohort in Table 5. Baseline characteristics of patients included in the study are presented as patient-level (Table 6), parent-level (Table 7), and family-level variables (Table 8). As expected, important differences were observed between the cohorts.
Table 5: Population attrition based on study inclusion criteria.
Eligibility Requirement ADHD Asthma Depression T2DM Epilepsy
Patient has a prescription for study drugs
5,011,746 5,884,190 10,290,950 3,499,003 8,821,973
The patient’s first prescription for study drugs (index date) occurred during 2010-2014
3,416,964 3,913,445 6,776,151 2,239,188 6,142,617
The patient has ≥365 days of continuous enrollment prior to index date
1,324,444 1,690,306 2,287,419 762,109 2,809,527
The patient has a diagnosis for the condition of interest in the 365 days prior to index date
358,263 567,841 250,587 453,896 39,985
The patient is <26 years of age at index date and is a dependent in the insured family unit
246,284 389,442 163,555 308,080 26,083
The patient has continuous enrollment for ≥365 days after the index date
182,593 182,842 54,471 3,105 12,542
The patient has at least one prescription claim for the study drugs with days supply >0 and total costs >$0
182,343 182,545 54,408 3,102 12,412
Insured family unit has acceptable data quality*
178,784 179,931 52,474 2,957 12,171
Abbreviations: ADHD Attention Deficit Hyperactivity Disorder. T2DM Type 2 diabetes mellitus
27
At the patient level, ADHD and asthma treatment initiators were typically male, while a preponderance of females was observed in depression and T2DM. Low frequencies for the youngest age group (0–4 years of age) were observed in ADHD, depression, and T2DM. T2DM and depression had the highest proportion of teen and young adult treatment initiators. Potential seasonality was observed in ADHD, asthma, and depression, where initiation of treatment occurred in a small proportion of parents in the summer (18.67%, 17.31%, and 20.61%, respectively). Comorbid depression was most common among ADHD (4.02%) and T2DM (6.02%) treatment initiators (Table 6).
Baseline healthcare utilization also differed across cohorts. Concomitant prescription drug use at index was higher relative to other conditions for patients with asthma and T2DM. In both of these conditions, more than half of patients were taking three or more prescription drugs (including index treatment(s)) at initiation. High percentages of patients in the depression (27.12%), T2DM (16.64%), and epilepsy cohorts (28.43%) had at least one prior inpatient visit during the previous year. Over half of epilepsy treatment initiators (58.45%) had an emergency department or urgent care visit during the 12 months prior to index date. ADHD had the lowest frequency; still, 1 in 5 ADHD treatment initiators had an emergency department or urgent care visit in the year prior to the index date (Table 6).
Sufficient chronic medication history was available to estimate prior adherence in 14.49% of ADHD patients, 9.72% of asthma patients, 23.01% of depression patients, 36.46% of T2DM patients, and 15.99% of epilepsy patients. Among patients with sufficient chronic
28
Table 6: Baseline patient-level characteristics among children initiating treatment for ADHD, asthma, depression, T2DM, and epilepsy.
Characteristic Group ADHD N=178,784 Asthma N=179,931 Depression N=52,474 T2DM N=2,957 Epilepsy N=12,171
Gender Male 65.02% 54.43% 38.5% 37.67% 52.44%
Female 34.98% 45.57% 61.5% 62.33% 47.56%
Patient age group at index date
0-4 0.67% 22.21% 0.01% 0% 12.97%
5-12 49.73% 41.6% 4.64% 6.8% 37.1%
13-18 28.82% 23.58% 53.55% 35.04% 28.29%
19-25 20.78% 12.61% 41.81% 58.17% 21.64%
Formulation of index treatment(s) Included inhalers
0% 70.07% 0% 0% 0%
Oral only
100% 29.93% 100% 100% 100%
Season of index date
Winter 27.58% 26.7% 26.13% 24.18% 25.81%
Spring 26.25% 29.52% 27.82% 24.52% 25.13%
Summer 18.67% 17.31% 20.61% 25.6% 24.78%
Fall 27.5% 26.47% 25.44% 25.7% 24.28%
Year of index date
2010 19.44% 24.29% 16.14% 16.77% 19.48%
2011 24.66% 23.3% 21.36% 20.76% 23.07%
2012 19.91% 19.44% 20.73% 21.31% 21.01%
2013 18.57% 17.29% 21.32% 19.41% 18.74%
2014 17.42% 15.67% 20.45% 21.75% 17.7%
Tertile of index treatment copay
Low 35.71% 33.49% 33.05% 32.97% 47.41%
Middle 31.78% 34.42% 33.78% 37.4% 29.78%
High 32.51% 32.09% 33.17% 29.62% 22.81%
Outpatient prescription drug count for patient at index date
1 63.22% 16.69% 43.35% 20.73% 54.82%
2 22.51% 31.31% 30.66% 20.19% 24.62%
≥3 14.27% 52.0% 25.99% 59.08% 20.56%
Patient diagnosed with depression during 12 months prior to index
No 95.98% 98.72% 0% 93.98% 96.84%
Yes 4.02% 1.28% 100% 6.02% 3.16%
Inpatient visit for patient during the 12 months prior to index
No 96.84% 93.64% 72.88% 83.36% 71.57%
Yes 3.16% 6.36% 27.12% 16.64% 28.43%
Tertile of outpatient visits for patient during the 12 months prior to index
Low 40.76% 36.81% 33.32% 36.56% 39.97%
Middle 26.17% 31.98% 33.98% 29.93% 28.39%
High 33.07% 31.2% 32.71% 33.51% 31.64%
29
Table 6: Baseline patient-level characteristics among children initiating treatment for ADHD, asthma, depression, T2DM, and epilepsy.
Characteristic Group ADHD N=178,784
Asthma N=179,931
Depression N=52,474
T2DM N=2,957
Epilepsy N=12,171 Emergency
department or urgent care visit for patient during the 12 months prior to index
Yes 21.96% 33.72% 33.54% 37.91% 58.45%
Average PDC ≥ 0.80 for chronic medications for patient during the 6 months prior to index date
No 9.91% 6.20% 15.12% 22.49% 10.56%
Yes 4.58% 3.52% 8.19% 13.97% 5.43%
No chronic drugs dispense d
85.51% 90.28% 76.69% 63.54% 84.01%
Abbreviations: ADHD Attention deficit hyperactivity disorder. PDC proportion of days covered. T2DM Type 2 diabetes mellitus
Tertile of index treatment copay (33%,66%): ADHD ($5.00, $60.00), Asthma ($8.00, $60.00), Depression ($0.00, $25.00), T2DM ($0.76, $18.99), Epilepsy ($5.00, $40.00)
Tertile of outpatient visits per patient (33%,66%): ADHD (5, 31), Asthma (5, 28), Depression (3, 39), T2DM (5, 37), Epilepsy (7, 50)
30
Table 7: Baseline parent-level characteristics among children initiating treatment for ADHD, asthma, depression, T2DM, and epilepsy.
Characteristic Group
ADHD N=178,784 Asthma N=179,931 Depression N=52,474 T2DM N=2,957 Epilepsy N=12,171 Female employee or spouse covered in family
No 10.56% 9.75% 11.58% 11.16% 10.31%
Yes 89.44% 90.25% 88.42% 88.84% 89.69%
Male employee or spouse covered in family
No 15.04% 14.5% 17.86% 22.39% 14.10%
Yes 84.96% 85.5% 82.14% 77.61% 85.9%
Age group based on parent(s) mean age at index
< 26 0.18% 0.71% 0.01% 0.00% 0.49%
26-29 1.99% 4.01% 0.12% 0.20% 2.80%
30-34 9.14% 14.86% 2.21% 2.00% 11.26%
35-39 17.8% 22.77% 9.15% 8.52% 19.24%
40-44 23.42% 23.5% 18.49% 19.58% 23.35%
45-49 22.11% 17.94% 27.19% 27.66% 20.38%
50-54 16.70% 10.82% 26.27% 23.74% 14.5%
55-59 7.10% 4.37% 13.48% 14.37% 6.51%
60+ 1.58% 1.02% 3.08% 3.92% 1.46%
Parent(s) dispensed same medication as the child's treatment in 12 months prior to index
No 88.79% 89.89% 86.43% 74.43% 97.31%
Yes 11.21% 10.11% 13.57% 25.57% 2.69%
Parent(s) dispensed medication is in the same class as the child's treatment in 12 months prior to index
No 86.36% 88.14% 67.07% 70.88% 83.15%
Yes 13.64% 11.86% 32.93% 29.12% 16.85%
Depression diagnosed among Parent(s) during the 12 months prior to diagnosis
No 93.28% 95.38% 88.44% 95.06% 95.1%
Yes 6.72% 4.62% 11.56% 4.94% 4.90%
Inpatient admission among parent(s) during the 12 months prior to index
No 92.14% 91.48% 91.61% 89.62% 91.67%
Yes 7.86% 8.52% 8.39% 10.38% 8.33%
Tertile of outpatient
Low 35.59% 36.18% 33.04% 35.88% 33.19%
31
Table 7: Baseline parent-level characteristics among children initiating treatment for ADHD, asthma, depression, T2DM, and epilepsy.
Characteristic Group
ADHD N=178,784
Asthma N=179,931
Depression N=52,474
T2DM N=2,957
Epilepsy N=12,171 visits among
parent(s) during the 12 months prior to index
High 32.27% 32.49% 32.56% 33.85% 33.87%
Average PDC ≥ 0.80 for chronic medications among parent(s% during the 6 months prior to index
No 36.48% 34.22% 37.85% 48.29% 34.51%
Yes 21.84% 18.97% 24.94% 23.94% 19.89%
No chronic drugs dispensed
41.68% 46.81% 37.22% 27.76% 45.6%
Abbreviations: ADHD Attention deficit hyperactivity disorder. PDC proportion of days covered. T2DM Type 2 diabetes mellitus
Tertile of outpatient visits per parent (33%, 66%): ADHD (4.5, 32), Asthma (5, 32.5), Depression (3.5, 27), T2DM (4.5, 29), Epilepsy (4, 26.5)
For all disease cohorts, the most common occurring dependent environment was one where the patient was in a family that included one other dependent. Families analyzed in the diabetes cohort were the most likely to have the patient as the only dependent (30.09% of patients) (Table 8).
Some family-level healthcare resource utilization measures varied across conditions. Similar to patient-level patterns, high percentages of families had prior inpatient visits in the depression (35.05%), T2DM (27.76%), and epilepsy cohorts (35.98%). The distributions of outpatient visits per family member were similar across conditions with medians ranging from 9 to 11 visits per family member, while the distributions of outpatient prescription medications at index tended to be higher for families in the T2DM cohort than others (median = 2.33 drugs per member). All cause healthcare costs per family member varied widely across cohorts, with medians ranging from $3,536.33 in asthma to $6,362.04 in epilepsy (Table 8).
32
medications (PDC ≥ 0.80) for family members with sufficient medication history to estimate prior adherence ranged from 28.60% in T2DM cohorts to 32.80% in the depression cohort (Table 8).
Table 8: Baseline family-level characteristics among children initiating treatment for ADHD, asthma, depression, T2DM, and epilepsy.
Characteristic
Group ADHD
N=178,784 Asthma N=179,931 Depression N=52,474 T2DM N=2,957 Epilepsy N=12,171 Count of other
dependents in family during the 12 months prior to index
Zero 18.29% 21.23% 21.38% 30.91% 20.66%
One 45.32% 45.08% 43.44% 38.82% 43.30%
More than one
36.39% 33.69% 35.19% 30.27% 36.04%
Inpatient visits in family during the 12 months prior to index
No 86.79% 83.54% 64.95% 72.24% 64.02%
Yes 13.21% 16.46% 35.05% 27.76% 35.98%
Tertile of outpatient visits per family member during the 12 months prior to index
Low 33.35% 33.86% 34.09% 33.55% 33.21%
Medium 32.28% 32.93% 32.19% 33.31% 34.11%
High 34.37% 33.21% 33.72% 33.14% 32.68%
Tertile of concomitant outpatient prescription drug count in the family at index date
Low 33.31% 33.31% 34.54% 34.97% 35.03%
Medium 34.44% 36.89% 33.55% 28.75% 32.32%
High 32.25% 29.8% 31.91% 36.29% 32.65%
Tertile of total medical costs in family during 12 months prior to index
Low 33.00% 33.00% 33.00% 33.01% 33.00%
Medium 33.00% 33.00% 33.00% 33.01% 33.00%
High 34.00% 34.00% 34.00% 33.99% 34.00%
Average PDC ≥ 0.80 for chronic medications among family member(s) during the 6 months prior to index
No 46.38% 42.58% 50.14% 59.76% 43.93%
Yes 21.48% 18.75% 24.47% 23.94% 20.31%
No chronic drugs dispensed
32.14% 38.67% 25.39% 16.30% 35.76%
Abbreviations: ADHD Attention deficit hyperactivity disorder; PDC Proportion of Days Covered. T2DM Type 2 diabetes mellitus
Tertile of medications at index per family member (33%, 66%): ADHD (0.6, 3), Asthma (0.8, 3), Depression (0.75, 3), T2DM (1.25, 5), Epilepsy (0.5, 3)
Tertile of outpatient visits per family member (33%, 66%): ADHD (5.2, 22.5), Asthma (5, 21), Depression (6, 25.7), T2DM (5.5, 26.25), Epilepsy (5.25, 26.5)
33
Adherence results by cohort
Mean PDC significantly differed across disease cohorts. Due to the large sample sizes of each cohort, Table 9 provides median PDC and interquartile ranges instead of mean PDC and 95% confidence intervals. Median PDC at 180 days ranged from 0.17 in asthma to 0.91 in epilepsy. At 365 days, PDC across conditions ranged from 0.16 in asthma to 0.82 in epilepsy. Decreases in median PDC from 180 days to 365 days were largest for T2DM (0.50 to 0.33), ADHD (0.66 to 0.49), and depression (0.67 to 0.44). Continuous PDC measures (mean and 95% CI) by subgroup are presented in full in Appendix 3.
Similarly, the highest proportion of observed adherence at 180 days based on a PDC ≥ 0.80 was in epilepsy, while asthma had the lowest proportion of patients with a PDC ≥ 0.80 (PDC epilepsy = 62.78%; PDC depression = 43.89%; PDC ADHD = 34.72%; PDC T2DM = 27.43%; PDC asthma = 9.62%) (Table 9). A similar ranking order was observed for adherence at 365 days, with
a slight majority of epilepsy patients remaining adherent (52.56%). Because the median PDC and the proportion of patients at 180 days were low in asthma, the adherence definition at 180 days was relaxed from ≥ 0.80 to ≥ 0.50, consistent with a previously published study [53], resulting in approximately one quarter of asthma patients meeting the adherence definition (Table 9).
Table 9: Median PDC, interquartile range (IQR), and proportion with PDC ≥ 0.80 among children initiating treatment for ADHD, asthma, depression, T2DM, and epilepsy.
ADHD Asthma Depression T2DM Epilepsy
Continuous Median PDC
(IQR)
Median PDC (IQR)
Median PDC (IQR)
Median PDC (IQR)
Median PDC (IQR) At 180 days 0.66
(0.33, 0.87)
0.17 (0.17, 0.50)
0.67 (0.33, 0.95)
0.50 (0.25, 0.83)
0.91 (0.54, 1.00) At 365 days 0.49
(0.16, 0.74)
0.16 (0.08, 0.33)
0.44 (0.16, 0.79)
0.33 (0.16, 0.66)
0.82 (0.41, 0.98)
Categorical PDC ≥ .80 PDC ≥ .80 PDC ≥ .80 PDC ≥ .80 PDC ≥ .80
At 180 days 34.72% 9.62% 43.89% 27.43% 62.78%
At 365 days 22.03% 4.50% 24.55% 16.88% 52.56%
PDC ≥ .50
At 180 days 26.76%
34
Adherence results by cohort and patient-level characteristics
Unadjusted odds ratios (ORs) revealed that few patient, parent, and family characteristics at baseline had consistent relationships with adherence at 180 days across cohorts. Asthma patients initiating treatment with oral medication(s) were only about 20% more likely to be adherent at 180 days than those initiating treatment that included inhaled medication
formulations (OR = 1.19, 95% CI: 1.18–1.19) (Table 10). Adherence at 180 days tended to be lower among initiators in older age groups relative to younger age groups across conditions (Table 10). The magnitude of the OR for patient age groups varied across conditions, with the lowest ORs for adherent patients observed among epilepsy (OR19-25 = 0.80, 95% CI: 0.78–0.82),
ADHD (OR19-25 = 0.81, 95% CI: 0.81–0.81), and depression (OR19-25 = 0.80, 95% CI: 0.82–
0.85). For asthma and T2DM, age group at index showed similar patterns with much smaller effect sizes (OR19-25 = 0.95 and OR19-25 = 0.96, respectively). Incidence of adherence among
patients that were adherent to prior chronic medication was 3% higher in ADHD and epilepsy to 17% higher in T2DM (Table 10).
35