Journal of Breath Research
PAPER • OPEN ACCESS
Standardization of the collection of exhaled breath
condensate and exhaled breath aerosol using a
feedback regulated sampling device
To cite this article: Brett R Winters et al 2017 J. Breath Res. 11 047107
View the article online for updates and enhancements.
Related content
Topical Review
Petra Reinhold and Henri Knobloch
-Temperature changes in EBC collection devices affect observed acetone concentrations
Bryan R Loyola, Abhinav Bhushan, Michael Schivo et al.
-Methodological aspects of exhaled breath condensate collection and analysis
Philippe Rosias
-Recent citations
F. Priego-Capote and Maria Dolores Luque de Castro
-Inflammatory mediators in exhaled breath condensate and peripheral blood of healthy donors and stable COPD patients
Wendong Hao et al
-Samantha J. Snow and Urmila P. Kodavanti
Human Exposure and Atmospheric Sciences Division, NERL/ORD, US EPA, Research Triangle Park, NC, United States of America
3 National Center for Environmental Assessment, ORD, US EPA, Research Triangle Park, NC, United States of America 4 Division of Occupational Hygiene and Safety, Duke University Medical Center, Durham, NC, United States of America 5 Bloomberg School of Public Health, Johns Hopkins University, Baltimore, MD, United States of America
6 Environmental Public Health Division, NHEERL/ORD, US EPA, Research Triangle Park, NC,United States of America
E-mail:[email protected]
Keywords:tidal volume, mouth breathing, hydrogen ion concentration, lung, breathing frequency
Abstract
Exhaled breath condensate
(EBC)
and associated exhaled breath aerosols
(EBA)
are valuable
non-invasive biological media used for the quanti
fi
cation of biomarkers. EBC contains exhaled
water vapor, soluble gas-phase
(polar)
organic compounds, ionic species, plus other species
including semi- and non-volatile organic compounds, proteins, cell fragments, DNA, dissolved
inorganic compounds, ions, and microbiota
(bacteria and viruses)
dissolved in the co-collected
EBA. EBC is collected from subjects who breathe
‘
normally
’
through a chilled tube assembly for
approximately 10 min and is then harvested into small vials for analysis. Aerosol
fi
lters without the
chilled tube assembly are also used to separately collect EBA. Unlike typical gas-phase breath
samples used for environmental and clinical applications, the constituents of EBC and EBA are not
easily characterized by total volume or carbon dioxide
(CO
2)
concentration, because the gas-phase
is vented. Furthermore, EBC and associated EBA are greatly affected by breathing protocol, more
speci
fi
cally, depth of inhalation and expelled breath velocity. We have tested a new instrument
developed by Loccioni Gruppa Humancare
(Ancona, Italy)
for implementation of EBC collection
from human subjects to assess EBC collection parameters. The instrument is the
fi
rst EBC collection
device that provides instantaneous visual feedback to the subjects to control breathing patterns. In
this report we describe the operation of the instrument, and present an overview of performance
and analytical applications.
1. Introduction
There has been significant interest in the ability of breath analysis to identify target compounds and trends in the constituents of exhaled breath as a tool for diagnosing and monitoring medical conditions, and for discovering a growing number of biomarkers that might indicate recent environmental exposures or preclinical disease state[1–3]. In fact, there is ongoing research regarding the mixtures of exogenous, endo-genous, and microbiome contributions to breath samples, and for volatiles emissions in other biological media, for deducing specific retrospective or prospec-tive effects[4–7].
Exhaled breath contains measurable levels of vola-tile organic compounds(VOCs), semi-volatile organic compounds (SVOCs), proteins, lipids, DNA and microbiota such as bacteria and viruses. The central goal of exhaled breath analysis is to non-invasively gain insight into previous occupational or environ-mental exposures and/or the presence or status of a medical condition or infectious state[6,8,9]. Exhaled breath analysis is less invasive, more easily repeatable and less expensive than alternative invasive tests[10]. There are various methods for collecting and analyz-ing exhaled breath, dependanalyz-ing on the constituent of interest. If the target of interest is a protein, lipid, SVOC, or microbiota, collection of exhaled breath 12 September 2017
PUBLISHED
1 November 2017
Original content from this work may be used under the terms of theCreative Commons Attribution 3.0 licence.
Any further distribution of this work must maintain attribution to the author(s)and the title of the work, journal citation and DOI.
condensate (EBC) is considered the ideal approach [11–14]. While there is significant interest in the col-lection and analysis of biomarkers in EBC for disease detection and monitoring, there are currently sub-stantial issues with the collection and analysis of breath, in general, and in EBC specifically with respect to inter-subject and intra-subject variability and a lack of standardization [15,16]until very recent recom-mendations[28]. Concentration of biomarkers as well as total sample volume in EBC can vary significantly depending on subject’s health, profession, diet, geno-type, age, gender, and recent exposure to exogenous chemicals[10]. In addition, a subject’s respiratory rate, exhaled breath velocity, and volume of each exhaled breath has been shown to significantly affect EBC volume[17–19]. Currently there is minimal standar-dization of methods or techniques to collect EBC, resulting in substantial difficulty comparing results within and across studies[15]. Given that the applica-tions of examining EBC biomarkers are extremely broad, the complete standardization of EBC collection protocols is unrealistic[12,15]. However, an instru-ment that assists in the control of a subject’s breathing rate and exhalation volume may be useful in reducing inter-subject and intra-subject variability within a spe-cific study and for certain biomarkers.
Herein, we report the efficacy of one such device, the Loccioni instrument, which was adapted from a prototype clinical instrument used previously for gas-phase health studies[20]. This instrument provides real-time feedback and breath cues to the subject to regulate breathing frequency and tidal volume. In this study, we compare consistency of EBC volume and pH of samples collected by controlled‘paced’ breath-ing usbreath-ing a new instrument with verbal and audio prompts to samples collected by uncontrolled free breathing.‘Paced’breathing, with the goal of produ-cing a fairly reproducible tidal volume and frequency, typically involves audio, visual, and/or vibratory prompts for the subject; we use this interchangeable
with controlled breathing for the purposes of this report. This work is in two parts; thefirst is based on a collection of various samples drawn from exploratory sample collections from research into environmental exposures, and the second part is a detailed long-itudinal comparison of specific parameters between groups. The primary goal is to assess if the controlled breathing technique presents any advantage to EBC sample standardization, such as decreased variability. We utilized two collection durations—a short(6 min) collection when a minimal amount of time to provide a relatively small EBC volume is required, and a longer
(10 min) one for potential studies needing a larger amount of EBC volume.
2. Methods
2.1. Instrument
The instrument, provided by Loccioni Gruppa HumanCare(Ancona Italy), instantaneously measures CO2 concentration, volume of each breath and total
volume exhaled during sampling. While CO2
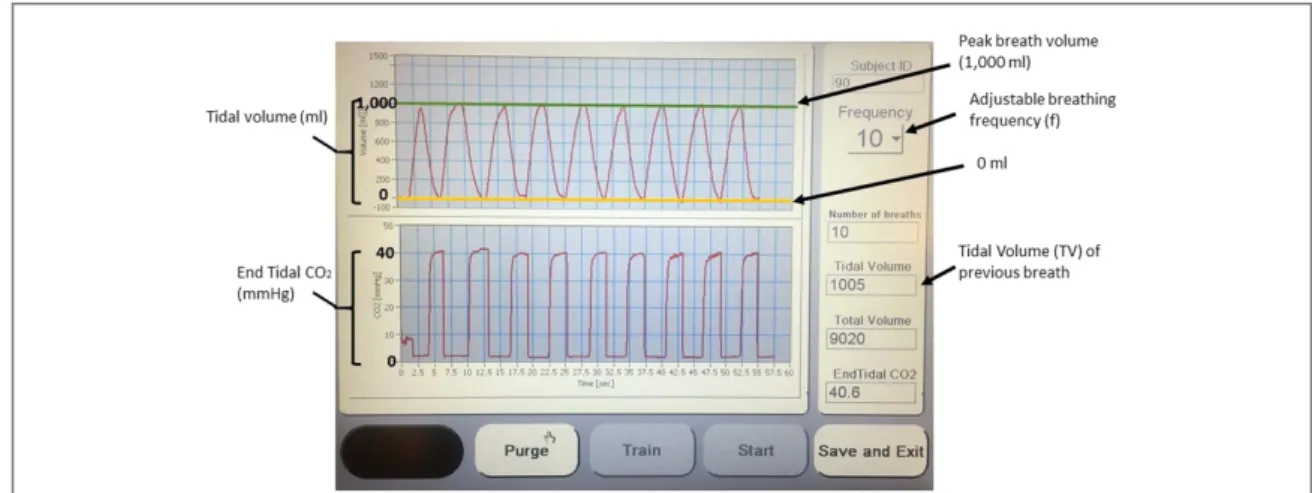
concen-tration was not directly recorded for our research, it may be useful for determining where in the lung the exhaled breath originated or to confirm complete exhalation[21,22]. In addition, the Loccioni instru-ment also has an interactive screen that visually guides the subject’s volume of air inhaled and exhaled and also acts as a audio metronome in order to prompt a subject when to reverse direction of breathing
(figure1). The respiratory rate for controlled breathing can be programmed from 6 to 16 breaths min−1, and individual breath volume programmed from 100 to 1500 ml/breath, which may allow for targeting of air from a specific region within the lung or breathing pattern. Total exhaled volume is also provided. There is no valve to allow collection of specific exhaled breath fractions.
Figure 1.Loccioni instrument interactive screen. The interactive screen guides the subject’s breathing pattern with instantaneous tidal volume measurements and an auditory metronome. The interactive screen allows the researcher to adjust breathing frequency and also provides the researcher with an instantaneous endtidal CO2measurement and total volume exhaled.
2
2.2. Human subjects
EBC biological specimens were collected from four adult volunteers during the methods development phase of studies conducted under the Institutional Review Board(IRB)auspices of IRB Study#: 09-1344 and IRB Study#99-283, University of North Carolina, Chapel Hill NC. Additional longitudinal evaluations were conducted ad hoc under an exemption to the common rule for biological specimens.
2.3. EBC collection method
EBC samples were collected using R-tubes( Respira-tory Research Inc. Austin, TX, USA). The R-tube was placed inside an aluminum sleeve, which was sur-rounded by dry ice within an 8 cm diameter co-axial container (‘condensation chamber’). A Respirguard 303filter(Vital Signs, San Diego, CA)was placed at the intake of the R-tube in order to prevent the introduc-tion of microbes into the Loccioni Instrument
(figure2). A plasticfitting containing the CO2and air
volume sensor was installed between the Respirguard 303 filter and the R-tube(figure2). The sensor was installed on both the spontaneous and controlled sampling methods for consistency and to measure the
final total air volume exhaled. The metronome and individual breath volume feedback mechanisms were not used for the spontaneous breathing samples.
Subjects remained seated while breathing through thefilter without nose clips. Upon completion of sam-ple collection, the R-tube was capped and condensate thawed at room temperature. Once thawed, the con-densate was consolidated using the internal O-ring squeegee in collaboration with the R-tube plunger. The volume of each sample was measured and samples transferred to a 2 ml polypropylene centrifuge tube for storage in−20°C freezer until pH analysis.
For this initial study, we collected 114 samples. 102 of the 114 samples were collected in sets of three. Between samples within the same set, an approximately
7 min gap was necessary to prepare for the following sample. Of the 114 samples, 57 samples had a 6 min lection time, while the remaining 57 samples were col-lected over a 10 min sample time. Sixty-three of the 114 samples were collected using the Loccioni instrument to control breathing rate at 10 breaths per minute and a breath volume of 1000 ml of air per breath. This was defined as controlled breathing. Of the 63 controlled samples, 30 were collected for 6 min, while the remain-ing 33 samples were collected over a 10 min samplremain-ing period. The remaining 51 samples did not use the Loc-cioni instrument to control breathing rate and volume. Instead, the subject was instructed to breathe at a reg-ular frequency and tidal volume. Of the 51 spontaneous samples, 27 were collected for 6 min, while the remain-ing 24 were collected over a 10 min samplremain-ing period.
2.4. pH analysis
pH was measured for all EBC samples with sufficient volume. A minimum of approximately 1.3 ml of EBC was required to accurately cover the pH meter electrode bulb. Few individual EBC samples had a volume of 1.3 ml or more, so EBC samples from each triplicate set
(collected within 45 min) were blended together to provide sufficient volume for a single pH measurement. pH was analyzed using a Thermo Scientific Ross Ultra pH Electrode, connected to Thermo Scientific Orion Star A211 pH meter(Waltham, MA). Thermo Scientific Orion Pure Water Low Ionic Strength pH buffers were selected for pH meter calibration. Argon was bubbled into each pH sample for 10 min, then the pH electrode was immediately placed into the sample. pH was recorded once the value stabilized.
2.5. Statistical analysis
Statistical analyses and tests were performed using Prism 7 software(GraphPad Software, Sn Diego CA). Figure 2.EBC collection system. The principal components of the collection system include the R-tube, the condensation chamber, the Respirguard 303filter and the CO2and air volume sensor. The condensation chamber isfilled with dry ice, which cools the R-tube
to−78°C. A Respirguard 303filter is in place to prevent accumulation of microbes within the Loccioni instrument. The CO2and air
3. Results
3.1. EBC volume
Reducing variability in EBC sample volume and biomarker concentration is a key goal for the standar-dization of breath analysis. To determine the efficacy of the Loccioni instrument in reducing variability, the EBC sample volume collected over 6 and 10 min using the Loccioni instrument was compared to the 6 and 10 min samples that were collected through sponta-neous breathing. The variability of EBC volume using the Loccioni instrument was notably reduced in comparison to the spontaneous breathing EBC sam-ples, regardless of collection time (figure 3). For samples collected for 6 min using the spontaneous breathing method, the mean value was 0.91 ml, with a range of 0.72–1.13 ml and a coefficient of variation of 0.124. In contrast, for samples collected using the controlled breathing method, the mean value was 0.71 ml, with a range of 0.52–0.82 ml and a coefficient of variation of 0.100. For samples collected for 10 min using the spontaneous breathing method, the mean value was 1.62 ml, with a range of 1.10–2.19 ml, and a coefficient of variation of 0.159, compared to the mean value being 1.20 ml, with a range of 1.01–1.63 ml, and a coefficient of variation of 0.103 using the controlled breathing method. The larger volume with the sponta-neous breathing pattern likely derives from larger and more frequent breaths especially hyperventilation at the initiation of collection.
Intra-subject variability in EBC volume and bio-marker concentration is inherent in EBC samples col-lected on different days. Therefore, to compare intra-subject variability between spontaneous and con-trolled breathing in samples collected in rapid succes-sion, the majority of EBC samples were collected in
sets of three using an identical sampling method and collection time. To determine whether the Loccioni instrument reduced same-day variability, EBC volume from each sample was graphed by sample set. The variability between 10 min samples collected in rapid succession using the Loccioni instrument was notably smaller in comparison to the 10 min samples collected in rapid succession using the spontaneous breathing method (figure 4). The largest volume difference between samples collected in rapid succession from the same subject for spontaneous breathing and con-trolled breathing is approximately 0.6 ml and 0.2 ml, respectively. In addition, variability in sample sets collected on different days was also markedly reduced in samples collected using the controlled breathing method.
3.2. pH analysis
pH of EBC samples is an easily measured biomarker to monitor respiratory acidification, which is associated with numerous respiratory illnesses[23]. Most of the EBC samples(31 of 37)had a pH value considered within the range of normal healthy individuals
(7.08±0.69) [24] (figures 5(A) and (B)). For the 10 min EBC samples, one sample from a subject was slightly below the pH range found in nominally healthy individuals (pH=6.12), and two samples collected from the same subject, approximately 20 min apart, had pH values of 4–5, far below the range of healthy individuals. No asthma-related symptoms were reported on the day of sample collection but the subject reported aStaphylococcus aureusinfection and had just begun treatment using antibiotics the day before. Previous studies have linked bacterial infec-tions with increased levels of nitric oxide, which may Figure 3.Comparison of EBC volume by collection time and method with mean and 95% confidence interval displayed. A reduction in variability between the spontaneous and controlled sampling methods is evident.(A)A comparison of volume of 6 min spontaneous(N=26)samples collected from a single subject, and controlled(N=29)samples collected from two subjects.(B)A comparison of volume of 10 min spontaneous(N=24)samples collected from three subjects, and controlled(N=33)samples collected from four subjects.(Each shape reflects a data point from a specific subject.)*There was a statistically significant difference between controlled and spontaneous breathing patterns at each collection time;p<0.01(one way ANOVA with Sidak Multiple Comparison Test).
4
be associated with decreased EBC pH, thus potentially explaining anomalous pH readings in the two sets of samples [25, 26]. A Grubbs’ outlier test identified pH values of 4.9 and 6.12 as a significant outlier in the 6 and 10 min collections with spontaneous breathing, respectively. With the outlier removed, the mean pH of the samples using the spontaneous breathing method for 6 min was 8.29, with a range of 7.8–8.62. With the outlier removed, the mean pH of sample sets using the spontaneous breathing method for 10 min was 8.39, with a range of 7.93–8.66.
4. Discussion
We have illustrated the implementation of a novel method of controlled cued breathing using a Loccioni instrument for standardization of EBC. Results from this instrument evaluation indicated a reduction of both intra-day and inter-day variability of EBC volume with the instrument use. EBC pH results were fairly consistent across samples from same subjects, regard-less of collection method and time, which is important
for the application of the R-tube for assaying asthma status. Additionally, EBC recovery volume and varia-bility over multiple time points were quantified and compared, allowing for determination of ideal collec-tion time for subsequent EBC studies. To determine an optimal collection time, it is necessary to determine the ideal collection volume, which is partially depen-dent on the number and assay types chosen. If planning to measure cytokine concentrations and pH, while reserving a sufficient volume for replicate or follow-up assays, we estimated a sample volume of at least 0.8 ml would be necessary. The majority(27/29) samples collected for 6 min using the controlled method had afinal volume of 0.8 ml or less but only 4 of 26 measured samples using the spontaneous method had afinal volume of 0.8 ml. However, due to the reduced variability using the controlled method, the 6 min spontaneous sampling technique was con-sidered inferior to both the 6 and 10 min controlled collection method if low volume reproducibility is the criterion or less volume is needed. Thesefindings with controlled breathing were obtained without knowl-edge of the variability in TV and freq for each Figure 4.Variability of EBC volume by sample set. Variability within sample sets using controlled EBC collection method is
collection, though the total volume was near the target
(100 l), which could be improved with software reprogramming.
A potential benefit of the 10 min collection time is the decrease in variability in volume or biomarker levels relative to spontaneous breathing due to hyper-ventilation by the subject, which typically can occur when the subjectfirst expires into the R-tube mouth-piece and Respirguard 303filter. It is not clear what role hyperventilation plays in the recovery of EBC or concentration of cytokines. While hyperventilation reduces the pH of blood, previous studies have found no link between hyperventilation and changes in EBC pH[27].
Our results indicated that there is less range of EBC volume in the 6 min samples than in corresponding 10 min samples, regardless of method of collection, but that the variability expressed as COV were similar for both the 6 and 10 min collections. This is reason-able, since there is less time for the sample volume to diverge. However a smaller EBC volume is collected over the 6 min. While there was less variability of EBC volume when using the controlled method, this differ-ence may be more pronounced if the sample subject size is expanded further. Additionally, early in the study, the subjects’spontaneous respiratory rate was markedly different than the programmed controlled respiratory rate of 10 breaths per minute. In later sam-ple collections, the subjects’spontaneous respiratory rate was noted to be considerably closer to the con-trolled breathing rate of 10 breaths per minute, possi-bly attributable to acclimation to the controlled breathing rate. Further examination of what different breathing patterns, e.g. panting, breath holding,
would have on the measured endpoints is needed. Additional subjects would allow testing of how gen-eralizable thefindings described herein are to the gen-eral population. Because the gengen-eral population has a wider range of lung volumes, the utility of using con-trolled breathing patterns of similar frequency and volumes may not be optimal to minimize variability. Adjustment to a more appropriate volume based on, e.g. lung volume capacity, may prove to be a better method to collect samples with minimal variability. Within the whole population, consideration of the fre-quency and volume of the controlled breathing pat-tern should be given to individuals with lung disease as well, possibly to document changes towards normal values due to therapies. While not examined in this report, the total exhaled volume is reported on the Loccioni instrument so that volume of EBC can be compared with the breath volume, as per recent recommendations by a European Respiratory task-force on exhaled breath collection[28].
5. Conclusions
A controlled breathing pattern using visual and audio clues to set inhalation and exhalation volumes and frequency was shown to have decreased variability in EBC volume compared to spontaneous breathing by an individual. This decrease in variability using the controlled breathing was observed with EBC collected for both 6 and 10 min.
With the controlled breathing pattern, a smaller EBC volume was collected at both collection durations Figure 5.Comparison of pH of EBC by collection time and method with mean and standard error displayed. No variability in
pH between sampling collection method and collection time was observed.(A)A comparison of pH of 6 min spontaneous(N=9) samples collected from a single subject, and controlled(N=5)samples collected from two subjects. All pH values are derived from triplicate pooled EBC samples. The pH of three samples are noticeably lower than the mean pH of their respective sample group.(B)A comparison of pH of 10 min spontaneous(N=10)samples collected from three subjects and controlled breathing(N=13)samples collected from four subjects. For the spontaneous values, seven were pooled from triplicate samples, and three were individual samples with an adequate volume to measure the pH; for the controlled breathing pH values, nine were pooled from triplicate samples, three were individual samples, and one was pooled from duplicates. The pH of two sets of samples from the same subject are noticeably lower than the mean of the pH of their respective sample collection method.(Each shape reflects a data point from a specific subject.) Two-way ANOVA performed comparing sampling method and collection duration.
6
BRW was supported by a pre-doctoral traineeship
(National Research Service Award T32 ES007126) from the National Institute of Environmental Health Sciences, National Institutes of Health and by addi-tional funding provided by the School of Medicine at UNC-Chapel Hill.
Disclaimer
The research described in this article has been reviewed by the US EPA National Health and Environ-mental Effects Research Laboratory and approved for publication. Approval does not signify that the con-tents necessarily reflect the views and policies of the Agency, nor does the mention of trade names of commercial products constitute endorsement or recommendation for use.
References
[1]Cao W and Duan Y 2006 Breath analysis: potential for clinical diagnosis and exposure assessmentClin. Chem.52800–11 [2]Pleil J D 2008 Role of exhaled breath biomarkers in
environmental health scienceJ. Toxicol. Environ. HealthB11 613–29
[3]Pleil J D and Stiegel M A 2013 The evolution of environmental exposure science: using breath-borne biomarkers for
‘discovery’of the human exposomeAnal. Chem.859984–90 [4]Amann A, Miekisch W, Schubert J, Buszewski B, Ligor T,
Jezierski T, Pleil J D and Risby T H 2014 Analysis of exhaled breath for disease detectionAnn. Rev. Anal. Chem.7455–82 [5]Pleil J D, Stiegel M A and Risby T H 2013 Clinical breath
analysis: discriminating between human endogenous compounds and exogenous(environmental)chemical confoundersJ. Breath Res.7017107
[6]Pleil J D, Miekisch W, Stiegel M A and Beauchamp J D 2014 Extending breath analysis to the cellular level: current thoughts on the human microbiome and the expression of organic compounds in the human exposomeJ. Breath Res.8029001 [7]de Lacy Costello B, Amann A, Al-Kateb H, Flynn C, Filipiak W,
Khalid T, Osborne D and Ratcliffe N M 2014 A review of the volatiles from the healthy human bodyJ. Breath Res.8014001
respiratory medicine: methodological aspects and potential clinical applicationsTher. Adv. Respir. Dis.15–23 [14]Moritz F, Janicka M, Zygler A, Forcisi S, Kot-Wasik A, Kot J,
Gebefugi I, Namiesnik J and Schmitt-Kopplin P 2015 The compositional space of exhaled breath condensate and its link to the human breath volatilomeJ. Breath Res.9027105 [15]Herbig J and Beauchamp J D 2014 Towards standardization in
the analysis of breath gas volatilesJ. Breath Res.8037101 [16]Beauchamp J D and Pleil J D 2013 Simply
breathtaking?Developing a strategy for consistent breath samplingJ. Breath Res.7042001
[17]McCafferty J B, Bradshaw T A, Tate S, Greening A P and Innes J A 2004 Effects of breathing pattern and inspired air conditions on breath condensate volume, pH, nitrite, and protein concentrationsThorax59694–8
[18]Liu J and Thomas P S 2006 Relationship between exhaled breath condensate volume and measurements of lung volumes Respiration74142–5
[19]Bloemen K, Lissens G, Desager K and Schoeters G 2007 Determinants of variability of protein content, volume and pH of exhaled breath condensateRespir. Med.1011331–7 [20]Solga S F, Mudalel M, Spacek L A, Lewicki R, Tittel F,
Loccioni C, Russo A and Risby T H 2013 Factors influencing breath ammonia determinationJ. Breath Res.7037101 [21]Lindberg L and Grubb D 2012 Simultaneously recorded
single-exhalation profiles of ethanol, water vapour and CO2in
humans: impact of pharmacokinetic phases on ethanol airway exchangeJ. Breath Res.6036001
[22]Cope K A, Watson M T, Foster W M, Sehnert S S and Risby T H 2004 Effects of ventilation on the collection of exhaled breath in humansJ. Appl. Physiol.961371–9
[23]Paget-Brown A O, Ngamtrakulpanit L, Smith A, Bunyan D, Hom S, Nguyen A and Hunt J F 2006 Normative data for pH of exhaled breath condensateChest129426–30
[24]Shoemark A and Wilson R 2011 Exhaled breath condensate pH as a non-invasive measure of inflammation in non-CF bronchiectasisISRN Pulmonology20111–6
[25]Ojoo J C, Mulrennan S A, Kastelik J A, Morice A H and Redington A E 2005 Exhaled breath condensate pH and exhaled nitric oxide in allergic asthma and in cysticfibrosis Thorax6022–6
[26]Kharitonov S A and Barnes P J 2000 Clinical aspects of exhaled nitric oxideEur. Respir. J.16781–92
[27]Davis M and Hunt J 2012 Exhaled breath condensate pH assays Immunol. Allergy Clin. North Am.32377–86