NEURAL CIRCUIT DYNAMICS AND FUNCTION OF COMPLEX BEHAVIORAL STATES
Joshua Holden Jennings
A dissertation submitted to the faculty at the University of North Carolina at Chapel Hill in partial fulfillment of the requirements for the degree of Doctor of Philosophy in the Graduate School
(Neurobiology Curriculum).
Chapel Hill 2014
© 2014 Joshua Holden Jennings
ABSTRACT
Joshua H. Jennings: Neural circuit dynamics and function of complex behavioral states (Under the direction of Garret Stuber)
To my little brother, Johnathon Gregory Taylor (1996 – 2014), I dedicate all my work and effort to you. I will always miss you and will never forget the times we shared together. You will
PREFACE
The human brain contains billions of neurons that are wired together in redundant and reciprocal patterns. Complicating matters further, numerous subpopulations of neurons possess functionally, genetically, and anatomically distinct features that make them separate entities or nodes within the collective system. To translate this complexity into a tangible thought, imagine if you had to deactivate an explosive device by locating a single unidentified wire that was tangled amongst a billion of other intermingled wires. This complexity has solidified the brain as one of the most mystical components of the human body. Aristotle, also known as “The Philosopher,” made vital contributions to biology during the fifth century and was considered to be the first anatomist, embryologist, taxonomist, and animal behaviorist.
However, the concept of perception and cognition confused Aristotle to the point where he falsely attributed the brain’s function to the heart. In response, Alcmaeon, a famous Greek scientist, was the first to hypothesize the brain as the controller of these complex cognitive functions. Nevertheless, the brain still remains a mystery, but the rapid advances in neuroscience may bring us closer to the truth:
This brief historical perspective demonstrates our persistent curiosity for understanding the brain. Will we ever completely understand why we feel or react the way we do? If we reach this goal, then does that make us no longer complex relative to other organisms? Keep in mind, the brain is the only tissue that categorizes or names itself. All together, these unsolved
ACKNOWLEDGEMENTS
I would like to thank the Stuber laboratory and the UNC community for all their support. In particular, I would like to thank Alice Stamatakis for always being there for me. You are the best teammate, scientist, and person that I have ever worked with. Thank you Garret for all your guidance. Your mentorship was vital to my success as a graduate student and I truly appreciate everything you have done for me. I will continue to value these vital lessons as I move forward in my career. Some of my best memories of graduate school involve the times where we just sat and talked science even if the ideas were never materialized into a project. In my opinion, moments like those helped tremendously by teaching me how to think as a
scientist. Thank you Mom, Dad, Greg, Caroline, John, Jordyn, and the rest of my family for your support, care, and guidance. Each of you significantly contributed to my growth and
TABLE OF CONTENTS
LIST OF FIGURES……….………....x
LIST OF ABBREVATIONS……….…………...xii
CHAPTER 1: GENERAL INTRODUCTION...……….………...1
Motivated behaviors...………...1
Maladaptive behavioral states....………...2
Neural candidates for these comorbid disease states...3
VTA activity dynamics and function...6
Molecular and anatomical heterogeneity of the VTA...8
Function and cellular composition of the LH...9
Neuromodulator tools for ascribing circuit function to behavior...12
Providing a neural circuit wiring diagram...14
Neurophysiological dynamics of distinct neural circuit elements...16
Dissertation...19
CHAPTER 2: DISTINCT EXTENDED AMYGDALA CIRCUITS FOR DIVERGENT MOTIVATIONAL STATES………...21
Introduction...………...21
Results...32
Discussion...38
CHAPTER 3: THE INHIBITORY CIRCUIT ARCHITECTURE OF THE LATERAL HYPOTHALAMUS ORCHESTRATES FEEDING....………...56
Introduction………...56
Methods...57
Results...66
Discussion...69
CHAPTER 4: VISUALIZING HYPOTHALAMIC NETWORK DYNAMICS FOR MOTIVATION AND CONSUMPTION………...82
Introduction………...82
Methods...84
Results...96
Discussion...104
CHAPTER 5: DISCUSSION………...125
General Discussion...125
LIST OF FIGURES
Figure 1.1: Neurocircuit blueprint for diverse motivated behavioral states...………...20
Figure 2.1: Optogenetic identification of vBNST→VTA projection neurons.………...39
Figure 2.2: Optogenetic identification of CaMKIIavBNST→VTA
projection neurons in freely moving mice………...41
Figure 2.3: vBNST→VTA projection neurons differentially respond to
aversive stimuli...43
Figure 2.4: Neurochemically distinct vBNST cell types contain CaMKIIa
and form functional excitatory and inhibitory synapses onto VTA neurons...44
Figure 2.5: Excitatory and inhibitory synapses onto non-dopaminergic VTA
neurons from neurochemically distinct vBNST neurons...45
Figure 2.6: Vglut2vBNST→VTA and VgatvBNST→VTA terminals synapse onto non-dopaminergic
and Ih negative dopaminergic neurons in the VTA...47
Figure 2.7: Vglut2vBNST→VTA and VgatvBNST→VTA projection neurons display distinct firing
patterns in response to foot-shock and shock-associated contextual cues...48
Figure 2.8: Photostimulation of the Vglut2vBNST→VTA pathway promotes
aversion and anxiety...50
Figure 2.9: Photostimulation of the Vgat
vBNST→VTA pathway and inhibition of Vgat
VTA neurons produces reward-related behaviours...52
Figure 2.10: Photostimulation of the Vgat
vBNST→VTA pathway and inhibition of Vgat
VTA neurons attenuates anxiety...54
Figure 3.2: Photoactivation of the VgatBNST¦VTA pathway is rewarding,
but does not produce feeding behavior...………...72 Figure 3.3: VgatBNST¦LH circuit inhibition diminishes feeding in food-deprived
mice and is aversive...………...74
Figure 3.4: VgatBNST¦LH projections preferentially target LH glutamatergic
neurons...………...76
Figure 3.5: Photoactivation of Vglut2LH neurons suppresses feeding in
food-deprived mice and is aversive...………...78
Figure 3.6: Photoinhibition of Vglut2LH neurons promotes feeding and is rewarding...………….80
Figure 4.1: Optogenetic Modulation of LH GABAergic Neurons Bidirectionally
Modulates Feeding and Reward-Related Behaviors...………...107
Figure 4.2: Bulk Chemogenetic Activation of LH GABAergic Neurons Enhances
Consummatory Behaviors...…………...110
Figure 4.3: Neurochemically Distinct Vgat LH Neurons are Completely Separate
From MCH and Orx Cells...…………...113
Figure 4.4: Genetic Ablation of LH GABAergic Neurons Attenuates Weight Gain,
Food-seeking, and Consummatory Behaviors...…………...115
Figure 4.5: In Vivo Ca2+ Imaging of LH GABAergic Neurons in Freely Moving Mice...……...118
Figure 4.6: Subsets of LH GABAergic Neurons Display Enhanced or Reduced
Activity to Environmental Locations Containing Food...…………...120
Figure 4.7: Separate LH GABAergic Neurons Selectively Encode Aspects
of Motivation or Consumption...…………...122
Figure 4.8: Tracking the Activity Dynamics of Individual LH GABAergic Neurons
LIST OF ABBREVIATIONS
3V Third ventricle
AAV Adeno-associated virus aCSF Artificial cerebral spinal fluid Arc Arcuate nucleus
BNST Bed nucleus of the stria terminalis Ca2+ Calcium
CaMKIIa Calcium/calmodulin-dependent protein kinase II a ChR2 Channelrhodopsin-2
CNO Clozapine-N-oxide
DA Dopamine
DMH Dorsal medial hypothalamus
DREADD Designer receptors exclusively activated by designer drugs eArch3.0 Enhanced archaerhodopsin
EP Entopenduncular nucleus
eYFP Enhanced yellow fluorescent protein
Fx Fornix
GABA Gamma-Aminobutyric acid
GFP Green fluorescent protein GRIN Gradient refractive index lens
hM3Dq Gq-coupled human M3 muscarinic DREADD LH Lateral hypothalamus
MCH Melanin-concentrating hormone NpHR3.0 Halorhodopsin
Nts Neurotensin
Orx Orexin
taCasp3 Designer procaspase-3 TH Tyrosine hydroxylase Vgat Vesicular GABA transporter
VgatBNST-LH LH-projecting BNST GABAergic neurons Vgat vBNST-VTA VTA-projecting BNST GABAergic neurons Vglut2 Vesicular glutamate transporter-2
Vglut2vBNST-VTA VTA-projecting BNST glutamatergic neurons VMH Ventral medial hypothalamus
CHAPTER 1: GENERAL INTRODUCTION1
Motivated behaviors
Adaptive motivated behaviors, such as seeking and obtaining resources, consuming nutrients, and avoiding danger, are fundamental survival processes that are driven by an organism’s basic needs. Furthermore, these survival-oriented behaviors are well conserved across all animal species and play a crucial role in many other complex behavioral states. In agreement with this, Abraham Maslow proposed that; “Practically all organismic states are to be understood as motivated. Usually acts have more than one motivation.” Therefore,
maladaptation of these purposive behaviors likely underlies numerous mental disease states that are detrimental to society, including addiction, depression, anxiety, and eating disorders. However, the main contributing factors responsible for the manifestation of these maladaptive disease states remain poorly understood. Recent advances in neuroscience have
demonstrated that an animal’s behavioral intent and actions are drastically altered from direct modulation of discrete neural circuit connections, suggesting that precise neuronal signaling and coding in defined brain networks selectively coordinate motivated behaviors. Thus, elucidating how behaviorally relevant information is transferred, integrated, and represented within distinct neural circuits is critical for determining the causal underpinnings of maladaptive behavioral states and may assist in the development of proper psychiatric treatment methods.
Maladaptive behavioral states
Stress modifies the intensity and direction of purposive behaviors, enabling an organism to properly adapt to novel environmental challenges. Chronic exposure to stressful and
aversive stimuli initiates a series of maladaptive neuronal responses that can result in
psychiatric disorders, such as anxiety, addiction, and depression (Davis et al., 2010). Anxiety is classified as persistent hypervigilance in the absence of aversive stimuli and immediate threats (Sylvers et al., 2011). Anxiety disorders are the most prevalent type of mental illness, affecting around 18 percent of adults in the United States (Kessler et al., 2005). Further, the expenses associated with treating anxiety as well as the lost of productivity from the disorder amounted to approximately 46 billion dollars in 1990, which accounted for 30 percent of all mental health expenditures in the United States (DuPont et al., 1996). Given the prevalence of these substantial economic and social burdens of anxiety, much emphasis is now placed on identifying the neural circuit elements that underlie this crippling disorder.
Addiction and obesity-related eating disorders share similar compulsive behaviors, such as foraging and ingestion, that persist despite adverse health, economic, or social
consequences (Volkow and Wise, 2005). Addiction- and obesity-promoting environmental factors, including drugs of abuse and palatable foods, activate similar brain reward areas to enhance reward-seeking and consummatory behaviors, further supporting the notion that addiction and obesity share overlapping hedonic mechanisms (Kenny, 2011). However, the precise neural circuit modulators responsible for both overeating in obesity and excessive drug use in addiction are not well defined. Thus, delineating the mutual neural circuits that promote aspects of reward-related behaviors is a crucial scientific priority for treating addiction and obesity-related eating disorders.
including diabetes, vascular disease, and cancer (Kopelman, 2000). Approximately 30 percent of adults in the United States possess a body mass index (BMI) of >30 and thus are considered to be obese (Flegal KM et al., 2002). Moreover, obesity contributes to more than 300,000 deaths in the United States each year, making it the second leading cause of death (Allison et al., 1999). Therefore, it is of critical importance to identify the precise mechanisms that give rise to eating disorders. Disruption in adaptive feeding behavior is a defining trait of eating
disorders, which are detrimental to society as they possess the highest mortality rate of any mental illness (Hudson et al., 2007). Binge-eating, classified as excessive feeding that is uncontrollable, is the most prevalent type of eating disorder15 and likely contributes to the worldwide obesity epidemic (Hill et al., 2003). Hyperphagia, also known as excessive feeding behavior, is another key factor contributing to the nationwide obesity epidemic (Swinburn et al., 2009). Furthermore, the growing abundance and easy accessibility of palatable high-fat foods are major environmental risks for the development of hyperphagia (Volkow and Wise, 2005). Therefore, pinpointing the discrete neural circuit elements that promote hyperphagia could unravel the underlying causes involved with high fat diet-induced obesity and thus provide crucial opportunities for developing novel therapeutic targets to treat obesity-related disorders. Taken together, the high prevalence of comorbidity between anxiety, addiction, and eating disorders, suggests that mutual neural circuits contribute to these disparate neuropsychiatric disease states (Back and Brady, 2008; Grilo et al., 2009; Javaras et al., 2008; Jordan et al., 2003; Kaye et al., 2004; Parylak et al., 2011; Tanofsky-Kraff et al., 2013).
Neural candidates for these comorbid disease states
structures within the continuum share similar neurochemical and morphological properties (Alheid, 2003). The BNST contains a vast array of molecularly distinct cell types, including GABAergic and glutamatergic neuronal populations, as well as cholinergic interneurons
(Cullinan et al., 1993; Ju and Swanson, 1989; Kudo et al., 2012). Additionally, an assortment of BNST neurons synthesize and release various neuropeptides, which includes enkephalin, corticotropin releasing factor (CRF), dynorphin, neuropeptide Y (NPY), and substance P (Gray and Magnuson, 1987; Kash and Winder, 2006; Kozicz et al., 1997; Phelix and Paull, 1990; Poulin et al., 2009; Walter et al., 1991). These heterogeneous cell types are located throughout multiple subdivisions of the BNST, such as the dorsal (BNSTd) and ventral (BNSTv)
sub-regions (Johnston, 1923; Ju and Swanson, 1989).
The BNST also possesses a complex connectivity profile as evident by the structure’s numerous connections that spread diffusely throughout the brain (Dong and Swanson, 2004; Dong et al., 2000, 2001a, 2001b). Moreover, the BNST is considered to be a major relay hub between stress regions and brain reward centers, since it is heavily interconnected with midbrain, hindbrain, amygdala, and hypothalamic areas that are important for mediating many of the autonomic and behavioral responses to aversive and reward-related stimuli (Walker et al., 2003). Thus, the BNST is thought to play an important role in the integration of behavioral states that have both positive and/or negative valences. Taken together, the diverse cell types as well as the complex wiring of the BNST arm the structure with the necessary tools for modulating diverse aspects of motivated behaviors, while also making it difficult to dissect the region’s precise functions and dynamics that underlie complex behavioral states.
al., 2009; Hammack et al., 2004; Schulz and Canbeyli, 2000; Walker et al., 2003), while
pharmacological activation of the BNST enhances anxiety-like phenotypes (Walker and Davis, 1997). Furthermore, human imaging studies have shown that BNST activity is enhanced in response to aversive stimuli (Somerville et al., 2010; Straube et al., 2007). In addition, BNST neurons respond to cocaine exposure (Mahler and Aston-Jones, 2012) and modulate the reinforcing properties of opiates (Walker et al., 2000), indicating that the BNST may also be involved with reward-related processes. The consumption and anticipation of food also activates BNST neurons (Ángeles-Castellanos et al., 2007) and the BNST heavily innervates motivated-feeding areas such as the lateral hypothalamus (LH) (Hahn and Swanson, 2012; Kim et al., 2013). Thus, the BNST may also play a pivotal role in regulating food intake through its molecularly- and projection-specific connections with the hypothalamus. Though these past findings define a causal role for the BNST in modulating anxiety and addiction-related states, the manipulations used by each study lack molecular and anatomical specificity and thus do not reveal the genetically distinct and projection specific cell populations that are mediating these diverse behavioral effects.
Initial electrophysiological and anatomical tract tracing studies demonstrated that a direct anatomic connection exists between the BNST and a classic brain reward center, the ventral tegmental area (VTA) (Georges and Aston-Jones, 2002; Kudo et al., 2012). In agreement with this, electrical stimulation of the BNSTv results in consistent activation of VTA neurons
VTA activity dynamics and function
The VTA, a heterogeneous midbrain region comprised primarily of dopamine (DA) neurons (approximately 60%) (Margolis et al., 2006a; Swanson, 1982), is canonically viewed as a crucial regulator of motivated behaviors. Numerous behavioral, pharmacological,
electrophysiological, and anatomical studies have associated the activity of these neurons with various functions including aversion, salience, novelty, and reward processing (Bromberg-Martin et al., 2010; Schultz, 2007; Ungless et al., 2010). DA neurons within the VTA are considered to be one of the principal neuronal systems of reward function. Consistent with this idea, selective ablation of DA neurons and blockade of DAergic signaling within major target sites of the VTA, such as the ventral and dorsal striatum, drastically attenuate motivational responding for normally rewarding substances (Ettenberg and Camp, 1986; Fouriezos et al., 1978; McFarland and Ettenberg, 1995; Ungerstedt, 1971; Wise et al., 1978; Yokel and Wise, 1975; Zarevics and Setler, 1979). Thus, the reward value of food, drugs, and brain stimulation is diminished in animals that have impaired DA function and signaling. In contrast, selective activation of VTA DA neurons enhances behavioral conditioning and increases motivation to obtain rewards (Adamantidis et al., 2011; Tsai et al., 2009). Collectively, these initial studies defined a causal role for VTA DA neurons in modulating motivation and reward-related behaviors. Although these functional assays ascribe DA function to motivated behaviors, the findings only offer causal information and thus do not account for the natural DAergic activity dynamics that likely underlie discrete components of motivation. Therefore, to determine how these neurons are able to act as valence detectors, one must elucidate how the DA system integrates and
converts external stimuli from the environment into an internal representation by monitoring the endogenous activity patterns of VTA DA neurons during discrete behavioral states.
Molecular and anatomical heterogeneity of the VTA
The molecular and anatomical heterogeneity within the VTA may contribute to the diverse functions of DA neurons in processing aspects of reward and aversion (Ikemoto, 2007; Lammel et al., 2008; Nair-Roberts et al., 2008). Intermingled with DA neurons, are also a large population of GABAergic cells that account for approximately 30 percent of the total VTA
population (Van Bockstaele and Pickel, 1995; Johnson and North, 1992; Margolis et al., 2006b). VTA GABAergic neurons suppress DA activity by forming local inhibitory synapses onto
neighboring VTA DA cells (Johnson and North, 1992; van Zessen et al., 2012) Further, selective activation of VTA GABAergic neurons disrupts reward consumption (van Zessen et al., 2012), and these neurons display increased activity in response to aversive stimuli (Cohen et al., 2012), indicating that VTA DA and GABAergic neurons share opposing roles for regulating and computing reward and aversion.
the presynaptic and postsynaptic sites of the BNST to VTA circuit connection, the existence of a functional connection within this pathway has not been established. Also, the functional
significance of this circuit for controlling reward, aversion, and anxiety is completely unknown. Thus, a key objective of this dissertation is to reveal the functional and genetic composition of the BNST to VTA pathway, while also attempting to define a causal role for this circuit in controlling divergent motivated states.
Function and cellular composition of the LH
The LH, an evolutionary ancient and well-conserved brain structure (Tessmar-Raible et al., 2007), was first highlighted as the feeding and motivation center over half a century ago by influential studies that employed gross manipulation tactics. These initial studies underscored the necessity of the LH for feeding and motivation by demonstrating that non-specific electrical activation of the LH elicited voracious feeding behavior in rodents (ANAND and BROBECK, 1951; DELGADO and ANAND, 1953) and positive reinforcement behavior (Hoebel and
Teitelbaum, 1962; Olds, 1958; OLDS and MILNER, 1954), while ablation of the region resulted in diminution of feeding with pronounced emaciation (Anand and Brobeck, 1951). Additional electrical stimulation experiments showed that electrical stimulation of LH can also evoke drinking (Greer, 1955), aggression (Woodworth, 1971), and sexual behaviors (Vaughan and Fisher, 1962), suggesting that the LH is involved with many purposive behaviors that satisfy an organism’s basic needs. The vast assortment of genetically distinct cell types within the LH likely contribute to these diverse behavioral responses (Berthoud and Münzberg, 2011;
The LH encompasses a plethora of genetically and functionally distinct cell types that utilize various signaling modalities, including neurotransmitters and neuropeptides (Allen and Cechetto, 1995; Burdakov and Alexopoulos, 2005; Collin et al., 2003; Goforth et al., 2014; Griffond and Risold, 2009; Laque et al., 2013a; Leinninger et al., 2009), to control nutrient intake. Vesicular glutamate transporter type 2 (Vglut2; a marker for glutamate neurons) mRNA expression is abundant in the LH (Collin et al., 2003; Rosin et al., 2003; Ziegler et al., 2002), suggesting that numerous LH neuronal subpopulations synthesize the excitatory
neurotransmitter, glutamate. In addition to glutamate, the LH is enriched with GABAergic neurons (Acuna-Goycolea et al., 2005; Karnani et al., 2013; Laque et al., 2013a; Rosin et al., 2003), which are completely separate from Vglut2-expressing LH cells (Ziegler et al., 2002). These prevalent neurotransmitter-containing neurons in the LH also coexpress several feeding-related neuropeptides, including orexin (Orx), melanin-concentrating hormone (MCH),
neurotensin (Nts), and galanin (GAL).
Neurons that synthesize and release the neuropeptide Orx (~5000 total in rodents) are restricted to the LH and also express Vglut2 (Rosin et al., 2003). Orx neurons are thought to promote feeding and reward seeking behaviors. Consistent with this idea, injections of the peptide into the lateral ventricle increases food intake (Sakurai, 1999), while Orx receptor antagonists and genetic removal of Orx decrease consumption (Haynes et al., 2002). Furthermore, chemical activation of Orx cells as well as infusions of the peptide into the VTA reinstate drug- and food-seeking behaviors (Harris et al., 2005). However, these neurons are also heavily involved with arousal, as Orx neuron activation increases wakefulness
MCH cells are also only found in the LH and are distinct from Orx neurons (Bittencourt et al., 1992; Elias et al., 1998). Several MCH neurons express markers for GABA (glutamatic acid decarboxylase; GAD67) and glutamate (Vglut2) (Elias et al., 2008; Harthoorn et al., 2005; Jego et al., 2013), suggesting that MCH neurons are composed of subsets of inhibitory and excitatory cells. MCH neurons have also been implicated in the regulation of feeding and
sleep-wakefulness balance. Intracerebroventricular injections of the peptide increases feeding and body weight in rodents (Qu et al., 1996). Further, recent genetic studies revealed that overexpression of MCH leads to hyperphagia and obesity (Ludwig et al., 2001), while mice lacking MCH neurons are hypophagic and lean (Alon and Friedman, 2006). In contrast to Orx neurons, activation of MCH neurons promotes sleep (Jego et al., 2013).
A separate neuropeptide-containing cell population within the LH (Kahn et al., 1980), Nts neurons, have been ascribed to be involved with negative energy balance. Peripheral and central administration of Nts suppresses feeding (Cooke et al., 2009), and both the genetic ablation of Nts neurons that contain leptin receptors, as well as the removal of the Nts receptor (NTR1) in a knock-out mouse model, result in hyperphagia and obesity (Kim et al., 2008; Leinninger et al., 2011). Nts neurons highly colocalize with GAL-expressing neurons (~95% overlap), but not with MCH and Orx cells (Laque et al., 2013b).
advanced in vivo measurements and manipulations, should provide critical insights into how neuronal networks within these regions of interest, the BNST, VTA, and LH, orchestrate motivated behavioral states.
Neuromodulator tools for ascribing circuit function to behavior
Manipulating neurons to control behavioral responses has been a hallmark feature of neuroscience (Caggiula and Hoebel, 1966; Hoebel and Teitelbaum, 1962; MARGULES and OLDS, 1962; OLDS and MILNER, 1954). The brain, however, embodies a mosaic of diverse cell types that are exquisitely woven together, thus manipulations involving non-specific electrical stimulation are not sufficient for ascribing brain function to behavior. The functional role of different cell types can be defined by their genetic complexion, therefore genetically directed manipulations are vital for understanding the causal link between specific circuit function and mammalian behavior. Advances in molecular genetics and genetically guided activity modulators have provided entry points for identifying precise neurocircuits that modulate the intensity and direction of certain behaviors. To selectively target genetically defined
neuronal populations, Cre recombinase in transgenic animals can be used to turn on gene expression for Cre-dependent viral vectors encoding optogenetic modulators, such as the excitatory opsin, channelrhodopsin-2 (ChR2), and inhibitory opsins, halorhodopsin-3 (NpHR3.0) and archaerhodopsin (eArch3.0) (Atasoy et al., 2008; Cardin et al., 2009; Chow et al., 2010, 2010; Kravitz et al., 2010; Mattis et al., 2012; Saunders et al., 2012; Sohal et al., 2009; Tsai et al., 2009).
ChR2, a light-gated cation channel, is expressed in the somas and axonal fibers of neurons (Yizhar et al., 2011). Thus, ChR2 can be used to activate the cell bodies of select neuronal populations as well as axonal projections within defined circuit connections
positioned above the region expressing the membrane-bound ion channel. Upon illumination via an optical fiber interfaced with a 473-nm solid state laser, the channel opens rapidly and an influx of cations enter the cell, resulting in light-evoked action potentials (Boyden et al., 2005). Optogenetic activation of genetically distinct neurocircuit elements offers valuable causal information by demonstrating that the activity of a particular neuronal population or circuit is sufficient for driving a certain behavioral state.
Inhibitory opsins can be used to determine if neuronal activity in a given region or circuit is required for a particular behavior. In contrast to ChR2, NpHR3.0 is a light-activated chloride pump that suppresses neuronal activity by pumping chloride ions from the extracellular to the intracellular space of the cell upon yellow light presentation (~590 nm) (Gradinaru et al., 2010; Tye et al., 2011; Witten et al., 2010; Zhang et al., 2007). eArch3.0, an outward proton pump, can also be used for somata and terminal photoinhibition applications (Chow et al., 2010; Fenno et al., 2011; Mattis et al., 2012). In response to yellow/green (~566 nm) light delivery, eArch3.0 pumps protons out of the cell, causing hyperpolarization of the cell and decreased neuron spiking (Chow et al., 2010).
Although optogenetic manipulations offer precise temporal control of neural circuit activity, the propensity of decreased opsin efficiency and phototoxicity significantly increases during chronic behavioral manipulations. Thus, behavioral experiments that demand sustained neuronal modulation may consider using ‘designer receptors exclusively activated by designed drugs, or DREADDs (Coward et al., 1998; Rogan and Roth, 2011). DREADD-mediated
manipulations utilize a pharmacologically inert compound, clozapine-N-oxide (CNO), that potently activates a family of muscarinic receptors on a longer timescale (up to several hours), allowing for selective modulation of signal-transduction pathways that is sustained through long durations (Armbruster et al., 2007). In comparison to the properties of optogenetic
hyperpolarization and depolarization effects in genetically defined neuronal populations
(Alexander et al., 2009; Atasoy et al., 2012; Krashes et al., 2011; Sasaki et al., 2011), making it a more viable option for reproducing the natural physiological characteristics of particular behavioral/disease states that are associated with persistent hyper- or hypo-activated neural circuits.
Providing a neural circuit wiring diagram
Unraveling the intricate neural wiring patterns within molecularly defined circuits is essential for elucidating the anatomical specificity underlying particular behavioral states. While gross neuroanatomical tracing methods have been used since the dawn of modern
neuroscience to provide critical insight into the axonal wiring between brain regions, these classical strategies typically cannot delineate neural circuit connectivity originating from ‘genetically’ distinct neuronal populations (that is, populations differing in their states of gene expression). Anterograde tracing viruses, such as Adeno-associated viruses (AAVs) (Monahan and Samulski, 2000) encoding ChR2 tagged with a fluorescent protein (ChR2-eYFP), are useful for mapping specific axonal projections and their selective destination points within distinct brain regions. AAV-mediated delivery of ChR2-eYFP to projection neurons in one brain region results in somata transduction (Gradinaru et al., 2009; Lee et al., 2010) and subsequently leads to anterograde transfer of the membrane-bound fusion protein to the axon terminals in
downstream regions (Lewis et al., 2011; Stuber et al., 2011; Tye et al., 2011), allowing
anatomical visualization of the pattern and density of innervation. However, these AAV-based anterograde tracing strategies cannot exclusively identify functional connections between multiple circuit nodes and so should only be used as an initial guide for visualizing possible neurocircuit interactions. Functional connectivity between two brain regions can be revealed through the combination of optogenetic approaches, i.e. ChR2, and patch clamp
whole cell recordings in the postsynaptic neurons with concurrent photostimulation of afferents expressing ChR2-eYFP will result in timelocked optically-evoked postsynaptic currents
(Chuhma et al., 2011).
ChR2-assisted slice electrophysiology experiments, should be used in combination to validate the presence of a functional synaptic connection between virally identified circuits. Another
important factor to consider when applying these viral tracing techniques is the complexity and diversity of various synaptic connections that may display differences in transsynaptic viral spread. Accordingly, the absence of viral labeling does not exclusively rule out a specific circuit connection.
Neurophysiological dynamics of distinct neural circuit elements
The ability to identify in vivo single-unit activity originating from genetically defined neurons provides an avenue for elucidating how specific neuronal subpopulations are engaged by environmental stimuli (Cohen et al., 2012; Kvitsiani et al., 2013; Lima et al., 2009; Zhang et al., 2013). Without these genetically guided electrophysiological approaches, the readout from extracellular recordings within brain tissue that originates from a vast array of diverse cell types, oftentimes with their own unique function, makes it virtually impossible to definitively
characterize the activity patterns of select neuronal subpopulations. As extracellular recordings within a given brain region usually reveal a multitude of discrete firing profiles timelocked to behaviorally relevant stimuli, it is now critical to determine if these functionally distinct activity patterns arise from genetically distinct neuronal subpopulations. Identifying distinct activity patterns will likely be fundamental for illustrating how whole neurocircuit systems are equal to the sum of their individual parts (genetically and functionally distinct cell types).
light. Under certain circumstances, however, using phototagging methods to identify responsive neurons may generate false-negatives or false-positives. For example, some light-evoked responses may be mediated through both local and distal polysynaptic circuit
modulation, as photoexcitable ChR2-expressing neurons may respond to light and elicit detectable spikes from neighboring synaptic partner neurons that do not express ChR2, thus giving a false-positive. When trying to identify neurons in vivo, there are certain criteria that can be used to minimize such problems. First, demonstrate a high-spike fidelity in response to high photostimulation frequencies (Cohen et al., 2012). Second, confirm that detected units possess short light-evoked latencies that have minimal variance (spike jitter) (Cohen et al., 2012; Zhang et al., 2013). Third, show that light delivery at certain intensities should does not alter the shape of the detected waveform, indicating that the responses to light are not caused from direct photoelectric artifacts (Cohen et al., 2012).
While these criteria may uphold for particular cell types, other cells of interest may require adjustments or alternative criteria for properly identifying light responses.
False-negative occurrences are influenced by factors underlying the detectability of light responses in recorded neurons. The detectability of light-responsive neurons depends on the level of ChR2 expression and on the volume of tissue that is efficiently illuminated by light. ChR2 expression strength is contingent upon the diffusion and spread of viral particles as well as the viral titer, while the volume of illuminated tissue relies on the intensity and scattering of the light in tissue. Thus, the absence of light-evoked responses does not completely rule out the possibility that a recorded neuron expresses the target gene.
and refine the computational role of participant cells within a complex circuit. To accomplish this, ChR2 localized in axons and presynaptic terminals can be activated via light delivery through implanted optical fibers. Congruently, multielectrode recording devices can be implanted near the somas of these targeted neurons. Photostimulation of
ChR2-expressing axonal fibers elicits an antidromic spike that propagates from the axons back to the soma region where the implanted electrode is capable of detecting these antidromic-initiated spikes. To confirm that detected light-evoked spikes originate from antidromic action potentials, orthodromic and antidromic photostimulations that occur close in time can be used to
demonstrate that the photoinitiated spikes, traveling in opposite directions, collide with each other and occlude the detectable spike. Spike collision is a key indicator that the action potentials are conducting along the same axon and thus are not due to synaptic transmission within a polysynaptic circuit (Fuller and Schlag, 1976; Nagy and Paré, 2008). Because ChR2 is expressed along axons, in certain situations the photoinitiation site of the antidromic spike is not restricted to the terminals and may arise from photoactivated fibers of passage that traverse through the postsynaptic target region. This key factor should be kept in mind when antidromic photostimulation methods are used to identify projection-specific activity.
While in vivo extracellular recordings can produce valuable neurophysiological
information in a precise temporal fashion, there are many challenges faced with this technique that can drastically hinder the investigation of neurocircuit dynamics. Modifications that have been made to long-term in vivo imaging techniques (Huber et al., 2012), along with the advent of newer variants of genetically encoded calcium indicators (Akerboom et al., 2012; Chen et al., 2013), have partially alleviated some of the limiting factors of extracellular recordings by
1971), and that engineered fluorescent proteins display changes in fluorescent intensity as they bind Ca2+ (Akerboom et al., 2009), action potentials and synaptic transmission are reliably measured by imaging changes in intracellular free Ca2+ (Yasuda et al., 2004). Chen and colleagues (Chen et al., 2013) recently developed a family of ultrasensitive protein calcium sensors (GCaMP6) that allow for reliable detection of single action potentials in neuronal somata.
Optical-fiber based approaches (Adelsberger et al., 2005; Cui et al., 2013; Gunaydin et al., 2014; Ziv et al., 2013) that are being developed are suited for complicated freely moving behavioral experiments that require in vivo imaging of activity in large neuronal populations situated in deep brain regions. Microendoscopes are composed of a relay lens fused to a doublet of gradient-index (GRIN) microlenses. GRIN lenses have a flat optical surface to refract light through a refractive index gradient and are able to efficiently focus and collect light through highly scattered tissue in deep brain regions (Göbel et al., 2004). High-speed, miniature epi-fluorescence microscopes (weighing less than 2 g) equipped with a complimentary metal oxide semiconductor (CMOS) image sensor and interfaced with a microendoscope are able to resolve simultaneous Ca2+ signals in large populations of genetically defined neurons. Notably, these integrated microscopes can repeatedly image neuronal populations for weeks to months (Ziv et al., 2013). Further technical developments, including innovative microendoscopic methods and Ca2+ indicators, will likely prove to be pivotal for addressing how large ensembles of genetically defined neurons encode aspects of multifaceted behavioral tasks.
Dissertation
amygdala (Heimer and Alheid, 1991), serves as a potential candidate for integrating comorbid disease conditions through its various circuit connections. While the BNST is canonically viewed as a modulator of fear and anxiety (Davis et al., 2010), its diverse synaptic targets, including the VTA (Geisler and Zahm, 2005b; Georges and Aston-Jones, 2001b, 2002; Kim et al., 2013), a brain region implicated in reward and aversion (Cohen et al., 2012; Fields et al., 2007; Lammel et al., 2012; Stamatakis and Stuber, 2012; Tan et al., 2012; Tye et al., 2013; van Zessen et al., 2012b), as well as the LH (Hahn and Swanson, 2012; Kim et al., 2013), a
neurosubstrate known to promote feeding and positive reinforcement behavior (DELGADO and ANAND, 1953; Hoebel and Teitelbaum, 1962; MARGULES and OLDS, 1962; Wise, 1968), indicates that the BNST may govern a multitude of motivational processes. Thus, a major goal of this thesis is to systematically dissect the precise neural circuits and networks that regulate stress-, reward-, and feeding-related processes (Figure 1.1). To accomplish this, we monitored and manipulated the activity of projection-specific and genetically distinct neurons within the BNST to VTA circuit (Chapter 2) and identified the circuit connectivity and functional
significance of the BNST to LH pathway for feeding (Chapter 3). Lastly, we monitored and manipulated the activity of genetically distinct LH GABAergic neurons to uncover the precise feeding- and motivation-coding ensembles within the LH (Chapter 4).
CHAPTER 2: DISTINCT EXTENDED AMYGDALA CIRCUITS FOR DIVERGENT MOTIVATIONAL STATES2
Introduction
The co-morbidity of anxiety and dysfunctional reward processing in illnesses such as addiction (Koob and Le Moal, 2001) and depression (Nestler and Carlezon, 2006) suggests that common neural circuitry contributes to these disparate neuropsychiatric symptoms. The
extended amygdala, including the bed nucleus of the stria terminalis (BNST), modulates fear and anxiety (Davis et al., 2010; Walker and Davis, 2008), but also projects to the ventral tegmental area (VTA) (Geisler and Zahm, 2005; Georges and Aston-Jones, 2001), a region implicated in reward and aversion (Cohen et al., 2012; Fields et al., 2007; Lammel et al., 2012; Stamatakis and Stuber, 2012; Tan et al., 2012; Tye et al., 2013; van Zessen et al., 2012), thus providing a candidate neural substrate for integrating diverse emotional states. However, the precise functional connectivity between distinct BNST projection neurons and their postsynaptic targets in the VTA, as well as the role of this circuit in controlling motivational states, have not been described. Here we record and manipulate the activity of genetically and neurochemically identified VTA-projecting BNST neurons in freely behaving mice. Collectively, aversive stimuli exposure produced heterogeneous firing patterns in VTA-projecting BNST neurons. By contrast, in vivo optically identified glutamatergic projection neurons displayed a net
enhancement of activity to aversive stimuli, whereas the firing rate of identified GABAergic
(γ-2This chapter previously appeared as an article published in the journal Nature. The original citation is as
aminobutyric acid-containing) projection neurons was suppressed. Channelrhodopsin-2-assisted circuit mapping revealed that both BNST glutamatergic and GABAergic projections preferentially innervate postsynaptic non-dopaminergic VTA neurons, thus providing a mechanistic framework for in vivo circuit perturbations. In vivo photostimulation of BNST glutamatergic projections resulted in aversive and anxiogenic behavioural phenotypes. Conversely, activation of BNST GABAergic projections produced rewarding and anxiolytic phenotypes, which were also recapitulated by direct inhibition of VTA GABAergic neurons. These data demonstrate that functionally opposing BNST to VTA circuits regulate rewarding and aversive motivational states, and may serve as a crucial circuit node for bidirectionally normalizing maladaptive behaviours.
Methods
Experimental subjects and stereotactic surgery
All procedures were conducted in accordance with the Guide for the Care and Use of Laboratory Animals, as adopted by the NIH, and with approval of the Institutional Animal Care and Use Committee at UNC. Adult (25-30g) male C57BL/6J mice (Jackson Laboratory), adult male Vgat-ires-cre mice and adult male Vglut2-ires-cre mice (see (Vong et al., 2011) for
additional details on the Vglut2-ires-cre and Vgat-ires-cre mouse lines) were group housed prior to surgery. All mice were maintained on a reverse 12 hr light cycle (lights off at 07:00) with ad libitum access to food and water, unless described below. Mice were anesthetized with a ketamine (150 mg per kg of body weight) and xylazine (50 mg per kg) solution and placed into a stereotactic frame (Kopf Instruments). For all in vivo electrophysiology experiments, male mice were unilaterally injected with 0.5 µl of purified and concentrated adeno-associated virus (AAV)
constructs were packaged by the UNC vector core facility at a final working concentration of 1 – 5E12 genome copies per mL.
For all in vivo electrophysiology experiments, mice were implanted with a 16-wire (4 x 4 configuration, wire diameter~30µm) tungsten multielectrode array (MEA) (Innovative
Neurophysiology, Inc) aimed at the vBNST using the stereotactic coordinates stated above. For all in vivo electrophysiological and in vivo behavioral experiments, except for the VTA
microinjection experiments, all mice were implanted with an optical fiber aimed at the VTA using the following stereotactic coordinates: -3.2 mm to bregma, +/-0.5 lateral to midline, and - 4.69 mm ventral to skull surface. For the VTA microinjection experiments, a 26-gauage steel tube cannula (McMasters-Carr) that terminated 0.5 mm above the tip of the optical fiber was epoxied to an optical fiber and unilaterally aimed at the VTA using the following stereotactic coordinates: -3.2 mm to bregma, +/-0.5 lateral to midline, and -4.69 mm ventral to skull surface. For
photoinhibition of VTA-GABAergic neurons using NpHR3.0, all mice were bilaterally implanted with an optical fiber at a 10o angle in the VTA using the following stereotactic coordinates: -3.2 mm to bregma, +/-1.1 lateral to midline, and – 4.75 mm ventral to skull surface. The time from virus injection to the start of the experiments was 4 – 6 weeks for all ChR2 terminal stimulation manipulations and 3 – 4 weeks for cell body manipulations.
Histology, immunohistochemistry, and microscopy
Mice were anesthetized with pentobarbital and transcardially perfused with phosphate buffered saline (PBS) followed by 4% paraformaldehyde (weight/volume) in PBS. 40 µm brain
microscope using a 20x or 63x objective. To determine optical fiber placement, tissue was imaged at 10x and 20x on an upright epi-fluorescent microscope.
In vivo anesthetized electrophysiology
C57BL/6J mice were bilaterally injected with 0.3 µl of AAV5-CaMKIIa-ChR2-eYFP into
the vBNST. 6 weeks following virus injection, mice were anesthetized with 0.5 – 1.0%
isoflurane (Butler Schein) and were placed into a stereotaxic frame (Kopf Instruments). Body temperature was maintained at ~ 37oC with a homeothermic heating blanket (Harvard
Apparatus, Holliston, MA). Tail pinches were administered frequently to monitor responses under anesthesia. A reference electrode was fixed inside brain tissue, approximately 2 mm from both the vBNST and VTA. Extracellular neural activity was recorded using a glass recording electrode (5 - 10 MΩ: and filled with 0.5 M NaCl). The recording electrode was
lowered into the vBNST (+ 0.14 mm to bregma, +/- 0.9 lateral to midline, and - 4.8 mm ventral to the skull surface) by a motorized micromanipulator (Scientifica). Recordings were amplified (Multiclamp 700B, Molecular Devices), highpass filtered at 6 kHz and sampled at 10 kHz.
For orthodromic activation, an optical fiber coupled to a solid state laser (473 nm) was fed through the side port of the electrode holder to terminate near the tip of the glass recording electrode, which allowed for delivery of ~5 mW light pulses into the vBNST. For antidromic activation, an optical fiber housed in a steel cannula and coupled to a separate solid state laser (473 nm) was inserted into the VTA at a 16o angle (- 3.2 mm to bregma, + 1.4 mm lateral to midline, and - 4.9 mm ventral to the skull surface), which delivered ~10 mW of light to the VTA. vBNST neurons were classified as antidromic-responsive, if the following 3 criteria were met: 1) stable antidromic spike latency (< 0.2 ms), 2) ability to respond reliably to high frequency photostimulation, 3) collision between orthodromic- and antidromic-evoked spikes. Each photostimulation parameter delivered a 5 ms light pulse to either vBNST cell bodies
latencies, 5 ms light pulses were delivered to the VTA every 5 s for 20 trials. To confirm reliable antidromic spike fidelity, 20, 40, and 100 Hz train pulses of light were delivered to the VTA every 10 s for 10 trials at each frequency. To validate spike collision, we varied the collision interval (0, 1, 2, 5, 10, 20 ms) between orthodromic and antidromic photostimulation. Each collision interval was repeated every 5 s for a total of 10 trials. Data acquisition and analysis was
performed using pCLAMP software (Molecular Devices). Placements of recording electrode tips within the vBNST and optical fibers within the VTA were verified with histological examination of brain tissue following the experiments.
Patch-clamp electrophysiology
Brain slices preparation and general methods for patch-clamp electrophysiology were conducted as previously described (Stamatakis and Stuber, 2012; Stuber et al., 2011; van Zessen et al., 2012), with the following changes. To examine both vBNST postsynaptic glutamatergic and GABAergic currents, C57BL/6J mice were injected with AAV5-CaMKIIa-ChR2-eYFP to nonspecifically target vBNST¦VTA projection neurons
(CaMKIIavBNST¦VTA::ChR2). For whole-cell voltage recordings (EPSCs and IPSCs) from VTA neurons, electrodes (2-4 MΩ electrode resistance) contained in mM: 117 cesium
methanesulfonate, 20 HEPES, 0.4 EGTA, 2.8 NaCl, 5 TEA, 2 Mg-ATP, 0.2 Na-GTP (pH 7.2-7.4), 275-285 mOsm. The cesium methanesulfonate internal solution also contained the selective NMDA antagonist, MK-801 (1.125 mM). VTA neurons were held at Vh = -70mV (EREV for GABAA receptors) and Vh = +10 mV (EREV for AMPA receptors) to examine both
glutamatergic and GABAergic postsynaptic currents respectively within the same neuron. Photostimulation (5 ms pulses of 1 - 2 mW, 473 nm light delivery via LED through a 40x
microscope objective) was used at both voltages. In a subset of neurons (n = 4 of 11 neurons), TTX (1 µM) and 4-AP (1 mM) was bath applied to isolate monosynaptic currents. To isolate
VgatvBNST¦VTA::ChR2 mice were used for recordings. For whole-cell voltage clamp recordings of VTA EPSCs from VglutvBNST¦VTA::ChR2 mice, once stable light-evoked EPSCs were achieved, 10 µM DNQX was bath applied. For whole-cell voltage clamp recordings of VTA IPSCs from
VgatvBNST¦VTA::ChR2 mice, once stable light-evoked IPSCs were achieved, 10
µM Gabazine was
bath applied.
Ex vivo validation of photoinhibition of VTA GABA neurons
For current clamp recordings to show hyperpolarization of membrane voltage from VTA GABA neurons following NpHR3.0 inhibition, Vgat-ires-cre mice were transduced with Cre-inducible NpHR3.0 under control of the EF1α promoter in the VTA. Electrodes (2-4 MΩ)
contained in mM: 130 K-gluconate, 10 KCl, 10 HEPES, 10 EGTA, 2 MgCl2, 2 Mg-ATP, 0.2 Na-GTP (pH 7.2-7.4), 275-285 mOsm. VTA neurons were maintained at~ -60 mV. For
photoinhibition, 500 ms pulses of 5 - 8 mW, 532 nm light delivery via a solid-state laser coupled to an optical fiber positioned in the brain slice.
Unpredictable foot-shock paradigm
Mice were placed in sound-attenuated mouse behavioral chambers (Med Associates) where an unpredictable foot shock was used as an aversive stimulus. A houselight and white noise signaled the start of the trial and remained on throughout the entire 20 min foot-shock session (contextual cues). Each unpredictable foot shock was 0.75 mA in intensity and 500 ms in duration on a variable interval (VI60) schedule. Mice received approximately 20
unpredictable foot shocks during the entire 20 min session.
For the in vivo electrophysiology experiments, VglutvBNST¦VTA::ChR2 and
association). Five days after the unpaired contextual cue session, mice were run in the
standard unpredictable foot-shock session (approx. 20 unpredictable foot shocks, 0.75 mA, 500 ms) for 5 consecutive days as stated above, which included paired presentation of the
contextual cues. Seven days following the 5th unpredictable foot-shock session, mice were placed back into the unpredictable foot-shock paradigm, where they received the visual and auditory contextual cues (houselight and white noise) in the absence of foot shock for 20 min.
In vivo electrophysiology
Neural activity was recorded using an Omniplex recording system (Plexon Instruments). Signals from each electrode in the array were referenced to ground, and recordings were performed in differential mode to subtract artifacts unrelated to neural activity. Acquired data was bandpass filtered between 0.1 and 8,000 Hz. Spike sorting was performed offline using Offline sorter (Plexon Instruments), as previously described (Roitman et al., 2005). Briefly, discrimination of individual units was performed offline using principal component analysis to separate individual units from the same electrode. In addition, auto- and cross-correlograms, firing characteristics, and inter-spike interval distributions were examined to ensure units were well-isolated. In addition, timestamp data to signify the start and end of foot-shock sessions, and the delivery of light pulses to optical fibers was synchronized with electrophysiological data. Sorted waveforms were further processed in NeuroExplorer (Nex Technologies) to extract unit timestamps and relevant events. NeuroExplorer-extracted timestamps were exported to
collected during these time epochs were excluded from analysis. This represents an
approximate loss of 0.8 – 1.66% of the collected data during the foot-shock session. Resulting data was binned in 30 s epochs in order to minimize the skewing of our results due to data lost by the shock artifacts. In addition, recording sites was verified histologically using electrolytic lesions at 200 µA for 5 s.
To identify units originating from vBNST projection neurons, 5 ms light pulses were delivered to VTA to antidromically stimulate vBNST projection neurons that innervated the area. Light pulses were delivered in 10 s intervals for 20 trials starting 40 min after the end of the unpredictable foot-shock session. Recorded vBNST units were classified as light-responsive, and thus VTA-projecting, if they met both of the following two criteria. 1) The latency of the first spike after light stimulation onset was less than 20 ms for ≥ 20% of the trials. 2) Light-evoked and spontaneous waveform shapes had a correlation coefficient of > 0.90. To compare light-evoked and spontaneous waveforms from units, light-light-evoked waveform characteristics were defined using the average waveform shape and average principal component values (PC1-3) of the first spike following photostimulation onset from each successful trial where a waveform was collected within 20 ms after light onset. This subset of light-evoked waveforms were then averaged together for a given unit, and compared to a subset of spontaneous, non-light-evoked waveforms that occurred immediately preceding the onset of light stimulations (pre-stimulation waveforms) and the first collected waveforms occurring after the 20 ms interval following the offset of photostimulations (post-stimulation waveforms). The correlation between each average waveform shape over the three time epochs (pre-stimulation, during stimulation, post-stimulation) was then calculated using Pearson’s product-moment coefficient as well as their average principle component values.
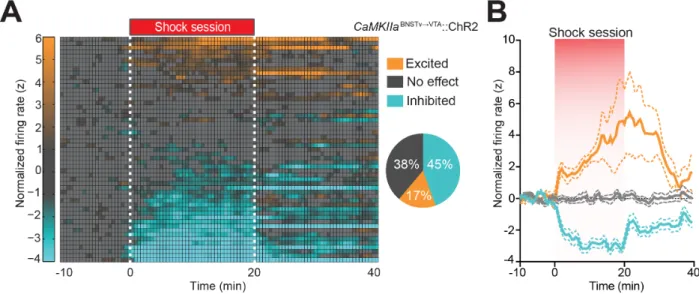
foot-shock session-inhibited and foot-foot-shock session-no effect. To clarify, foot-foot-shock session-excited, foot-shock session-inhibited, and foot-shock session-no effect refers to a neural unit’s activity in response to the collective aversive experience, not to individual foot shocks. To assess the firing rate of a particular neuron, each spike from 10 min preceding the foot shock session to 20 min following the end of the foot shock session was binned into 30 s bins. Firing rate was then normalized to the mean firing rate during the 10 min preceding the start of the 20 min foot-shock session using z-scores. Neurons were classified as foot-shock session-excited if their average z-score during the 20-min foot-shock session was greater than 1. Likewise, neurons were classified as foot-shock session-inhibited if their average z-score during the shock session fell below -1. All other units where the z-score did not exceed an absolute value of 1 during the 20 min foot-shock session were classified as no effect. Neural activity was recorded from the same mice during the cue exposure, foot shock, and cue re-exposure sessions, therefore we were able to reliably record activity from the same population of neurons during each of the three sessions.
Photostimulation of Vglut2vBNST¦VTA::ChR2 and VgatvBNST¦VTA::ChR2 projections and photoinhibition of VgatVTA::NpHR neurons during real-time place preference
Vglut2vBNST¦VTA::ChR2, VgatvBNST¦VTA::ChR2, VgatVTA::NpHR, and litter mate controls were implanted with optical fibers above the VTA and were run in the real-time place preference paradigm. See (Stamatakis and Stuber, 2012) for additional details on this method.
Intra-VTA injection of antagonists and photostimulation of Vglut2vBNST¦VTA::ChR2 and VgatvBNST¦VTA::ChR2 projections during real-time place preference
A separate cohort of Vglut2vBNST¦VTA::ChR2 and VgatvBNST¦VTA::ChR2 mice were
baseline session, Vglut2vBNST¦VTA::ChR2 mice were injected with either 0.3
µl of vehicle (saline)
or a cocktail of selective glutamate antagonists (0.1 µg AP-5/0.001 µg DNQX in saline) and
VgatvBNST¦VTA::ChR2 mice were injected with either 0.3
µl of vehicle (saline) or a selective
GABAA antagonist (0.001 µg Gabazine) into the VTA in a counter balanced design (all drugs from Tocris). The injector needle (33 gauge steel tube, McMasters-Carr) extended
approximately 1 mm past the cannula to ensure drug delivery 0.5 mm below the optical fiber. All mice were infused at a rate of 0.1 µl per minute. The injector remained in place for
approximately 2 min following infusion to ensure proper diffusion of drug into the VTA.
Immediately following the microinjection procedure, all mice were placed into the real-time place preference chamber. Mice had 2 days off between each VTA microinjection.
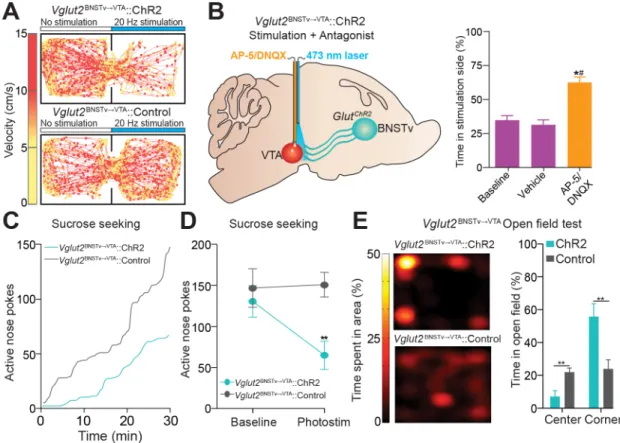
Photostimulation of Vglut2vBNST¦VTA::ChR2projections during open-field testing
Vglut2vBNST¦VTA::ChR2 and Vglut2 vBNST¦VTA::Control mice were examined in a custom made open field arena (25 x 25 x 25 cm white plexiglass arena) for 35 min. After a baseline period of 5 min, all mice received constant 20 Hz photostimulation. Immediately, following the 20 min photostimulation epoch, all mice had a 10 min period in which they received no
photostimulation. Center zone was defined as the center 156 cm2 (25% of the entire arena). Corner zones were defined as the 39 cm2 in each corner. The 35 min session was recorded with a CCD camera that was interfaced with Ethovison software (Noldus Information
Technologies). Time spent in the corner and the center of the open-field apparatus was
recorded. Heat maps and post-acquisition processing were conducted in MATLAB (Mathworks Inc.).
Photostimulation of Vglut2vBNST¦VTA::ChR2projections during sucrose self-administration
placed in standard mouse operant chambers in order to nose poke for a 15% (w/v) sucrose solution on a fixed ratio (FR-1) schedule in a 30 min session. Once stable nose-poking behavior for 15% sucrose was observed (approximately 100 active nose pokes on at least 2 consecutive days), all mice received constant 20 Hz photostimulation during the entire 30 min sucrose session.
Optical self-stimulation of VgatvBNST¦VTA::ChR2 projections
VgatvBNST¦VTA::ChR2 and VgatvBNST¦VTA::Control mice with optical fibers implanted above the VTA were trained in one 30 min session to nose poke on a fixed ratio (FR-1) schedule for optical self-stimulation of the VgatvBNST¦VTA::ChR2 projections in standard mouse operant chambers (Med Associates). Each nose poke resulted in a single 3 s 20 Hz optical pulse train. Following the 1 day 20 Hz training session, mice were run daily at each photostimulation
frequency (1, 5, 10, 20, 40 Hz) in a counter-balanced design.
Optical self-inhibition of VgatVTA::NpHR neurons
VgatVTA::NpHR and VgatVTA::Control mice with optical fibers implanted above the VTA were trained in one 30 min session to nose poke on a FR1 schedule for 3-s constant
photoinhibition of VTA GABAergic cell bodies in standard mouse operant chambers as described above (Med Associates).
Photostimulation of VgatvBNSTv¦VTA::ChR2 projections and photoinhibition of VgatVTA::NpHR neurons during the elevated plus maze
following the 5 min photostimulation or photoinhibition epoch, all mice had a 5 min period in which they received no light delivery.
Photostimulation of VgatvBNST¦VTA::ChR2 projections during foot-shock followed by
freezing and anxiety-like behavior measurements
VgatvBNST¦VTA::ChR2 and VgatvBNST¦VTA::Control mice with optical fibers implanted above the VTA were run in a modified foot-shock paradigm as described above. Briefly, mice were placed into sound attenuated mouse chambers (Med Associates) for a 5 min baseline period. After the 5 min baseline period, a house light and white noise were activated and mice received the same foot shock protocol as described above. Additionally, during the 20 min shock
session, all mice received constant 20 Hz photostimulation. A separate cohort of mice
(VgatvBNST¦VT::ChR2 and VgatvBNST¦VT::Control) received constant 20 Hz photostimulation of this pathway in the absence of foot shock. Immediately following the 20 min foot shock and
photostimulation epoch, all mice had a 5 min period in which they received no foot shock or photostimulation while still exposed to contextual cues, to assay freezing behavior. Freezing was defined as the total lack of any movement, except respiration for a period of 2 s. The 30 min test session was recorded with a CCD camera that was interfaced with Ethovision software (Noldus Information Technologies). Time frozen during the 5 min period immediately following the foot shock and photostimulation session was recorded. Approximately 3 hr after the foot shock and photostimulation session or just the photostimulation session in the absence of foot shock, mice were run on the elevated-plus maze to assay anxiety-like behavior for 5 min. Results
Optogenetic identification of vBNST¦VTA projection neurons
2005; Jalabert et al., 2009; Kudo et al., 2012), and aversive and rewarding stimuli activate a subset of these vBNST projection neurons (Briand et al., 2010; Christianson et al., 2011; Mahler and Aston-Jones, 2012). To identify and record the activity of vBNST¦VTA neurons using antidromic photostimulation in vivo, we targeted channelrhodopsin-2 fused to enhanced yellow fluorescent protein (ChR2–eYFP) (Boyden et al., 2005) under the control of a CaMKIIα promoter to the vBNST of adult mice. After 4–6 weeks, ChR2–eYFP was observed in vBNST cell bodies and projection fibres that innervate the VTA (Figure 2.1 A). Under anaesthesia, optical fibres for antidromic photostimulation were positioned above the VTA, whereas recording electrodes and optical fibres for orthodromic photostimulation were positioned in the vBNST (Figure 2.1 B). We recorded from vBNST units that showed reliable spiking to both orthodromic and antidromic photostimulation. By systematically decreasing the interval between orthodromic and
antidromic photostimulation, the fidelity of antidromic spikes was significantly attenuated (Figures 2.1 C and D), demonstrating spike collision (Fuller and Schlag, 1976). In addition, antidromic spike latencies were significantly greater and showed less variability than
orthodromic spikes (Figures 2.1E and F), and antidromic spike fidelity was significantly greater than orthodromic spike fidelity to 40-Hz photostimulation (Figure 2.1 G). Thus, photostimulation of vBNST¦VTA projections results in antidromic spiking that is reliably distinguishable from putative transsynaptic circuit activation.
shapes demonstrated that spontaneous waveforms were highly correlated with light-evoked waveforms 7 (average r = 0.950 ± 0.008 (mean ± s.e.m.) (Figures 2.2 D and E). Light-evoked spike latencies showed that a subset of recorded units consistently displayed time-locked spiking on 11.21 ± 0.68 out of 20 trials (56%), with a mean latency of 7.31 ± 0.32 ms (Figures 2.1 I and J), comparable with our anaesthetized recording data (Figure 2.1 E) and a previous study using electrical antidromic stimulation of BNST projections in rodents (Nagy and Paré, 2008). Accordingly, neurons that were identified as antidromic-responsive displayed a spike fidelity of 81 ± 15% in response to 20-Hz photostimulation (Figure 2.2 F). Using these criteria, we identified 53 out of 137 units as vBNST¦VTA projection neurons.
vBNST neurons display heterogeneous responses to aversive stimuli exposure (Briand et al., 2010; Christianson et al., 2011). Thus, we classified the firing patterns of identified vBNST¦VTA neurons in response to unpredictable foot shocks and associated contextual cues. Identified vBNST¦VTA neurons segregated into three functionally distinct classes based on changes in their normalized firing rates throughout the foot-shock session (Figures 2.3 A and B), demonstrating that vBNST–VTA neurons differentially encode information related to aversive stimuli and their associated contextual cues.
Excitatory and inhibitory synapses onto non-dopaminergic VTA neurons from neurochemically distinct vBNST neurons
We next dissected the functional connectivity between distinct glutamatergic and
GABAergic vBNST¦VTA neurons and their genetically defined postsynaptic targets within the
VTA. Injection of a Cre-inducible viral construct coding for ChR2–eYFP into the vBNST in
Vglut2-ires-cre or Vgat-ires-cre mouse lines (which express Cre recombinase from the
endogenous Vglut2 (also known as Slc17a6) or Vgat (Slc32a1) promoters, respectively) (Vong
et al., 2011) resulted in robust expression in the vBNST as well as in fibres originating from
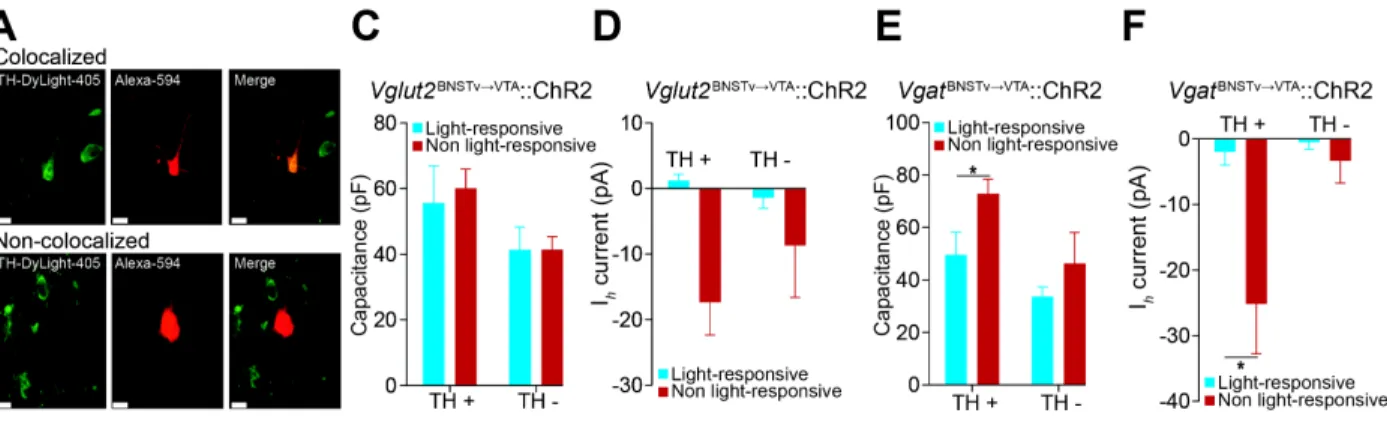
these neurons that innervated the VTA (Figures 2.5 A and B). Whole-cell recordings from VTA
neurons revealed that photostimulation of ChR2-containing fibres originating from vBNST
neurons expressing Vglut2 (Vglut2vBNST¦VTA::ChR2) or Vgat (VgatvBNST¦VTA::ChR2) produced excitatory or inhibitory postsynaptic currents, respectively (Figures 2.5 C and D).
Vglut2vBNST¦VTA and VgatvBNST¦VTA terminals formed functional synapses primarily onto
non-dopaminergic and medially located non-dopaminergic neurons, which have been implicated in
responding to aversive stimuli (Cohen et al., 2012; Lammel et al., 2012; Tan et al., 2012; van
Zessen et al., 2012) (Figures 2.5 E and F and Figure 2.6). These data provide a circuit
blueprint by which vBNST subcircuits interact with VTA-reward circuitry.
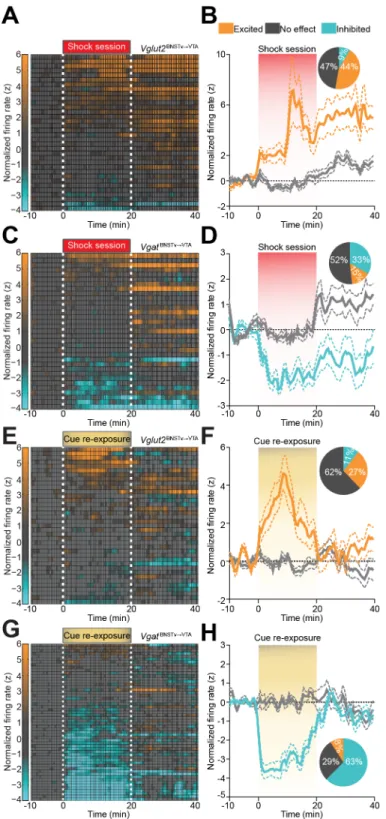
Vglut2vBNST¦VTA and VgatvBNST¦VTA projection neurons display distinct firing patterns in response to foot-shock and shock-associated contextual cues
VgatvBNST¦VTA::ChR2-expressing neurons out of 77 total neurons principally exhibited reduced firing during the aversive event (Figures 2.7 C and D). In addition, 1 week after five
consecutive daily foot-shock sessions, re-exposure to shock-associated contextual cues alone resulted in a net enhancement of Vglut2vBNST¦VTA::ChR2 neuronal activity (Figures 2.7 E and F), whereas the activity of VgatvBNST¦VTA::ChR2 neurons was largely suppressed (Figures 2.7 G and H). Collectively, exposure to the aversive event or associated cues alone enhanced the firing of Vglut2vBNST¦VTA neurons, while simultaneously suppressing the activity of VgatvBNST¦VTA neurons.
Photostimulation of the Vglut2vBNST¦VTA pathway promotes aversion and anxiety
Because aversive stimuli enhanced the activity of Vglut2vBNST¦VTA neurons (Figures 2.7 A and B), which can excite non-dopaminergic VTA neurons (Figure 2.5 E), we next explored the behavioural consequences of selectively activating this projection in behaving mice. We tested mice in a real-time place preference (RTPP) model to assay the effects of
photostimulation of the Vglut2vBNST¦VTA pathway on motivational valence. Photostimulation of Vglut2vBNST¦VTA::ChR2 mice resulted in a significant avoidance of a stimulation-paired chamber (Figures 2.8 A and B). The aversive effects of this stimulation was dependent on local VTA glutamatergic signalling as infusions of an ionotropic glutamate receptor antagonist cocktail abolished the aversive phenotype induced by Vglut2vBNST¦VTA activation (Figure 2.8 B). Activation of this pathway also reduced active reward seeking (Figures 2.8 C and D). In addition, inescapable activation of this pathway for 20 min in an open field resulted in