International Journal of Environmental Research and Public Health
Review
Indicators for Monitoring Water, Sanitation, and
Hygiene: A Systematic Review of Indicator
Selection Methods
Stefanie Schwemlein, Ryan Cronk and Jamie Bartram *
Department of Environmental Sciences and Engineering, University of North Carolina, Chapel Hill, NC 27599, USA; [email protected] (S.S.); [email protected] (R.C.)
* Correspondence: [email protected]; Tel.: +1-919-966-2480; Fax: +1-919-966-7911 Academic Editor: William A. Toscano
Received: 21 November 2015; Accepted: 11 March 2016; Published: 17 March 2016
Abstract:Monitoring water, sanitation, and hygiene (WaSH) is important to track progress, improve accountability, and demonstrate impacts of efforts to improve conditions and services, especially in low- and middle-income countries. Indicator selection methods enable robust monitoring of WaSH projects and conditions. However, selection methods are not always used and there are no commonly-used methods for selecting WaSH indicators. To address this gap, we conducted a systematic review of indicator selection methods used in WaSH-related fields. We present a summary of indicator selection methods for environment, international development, and water. We identified six methodological stages for selecting indicators for WaSH: define the purpose and scope; select a conceptual framework; search for candidate indicators; determine selection criteria; score indicators against criteria; and select a final suite of indicators. This summary of indicator selection methods provides a foundation for the critical assessment of existing methods. It can be used to inform future efforts to construct indicator sets in WaSH and related fields.
Keywords: criteria; method; monitoring and evaluation; Sustainable Development Goals; WaSH; water
1. Introduction
Drinking water, sanitation, and hygiene (WaSH) are important for human health, well-being, and development [1]. In September 2015, the United Nations launched the Sustainable Development Goals (SDGs)—a set of 17 goals and 169 targets for sustainable human development. The SDGs include a goal for water and sanitation: to “ensure access to water and sanitation for all” by 2030 [2]. Since 1990, 2.6 billion people have gained access to improved water sources and 1.9 billion people have gained access to improved sanitation. However, 663 million people lack an improved water source and 2.4 billion people do not use improved sanitation [3].
Achieving the goal of water and sanitation for all and to reach the remaining unserved people will require more and better use of data. Important indicators, such as water system functionality, safe management of excreta, water quality, sustainability, sanitary risk, and the enabling environment, will need to be measured; and data will need to be disaggregated by gender, socioeconomic status, and disability status [3–6]. Improved monitoring and new indicators are needed in non-household settings such as health care facilities, workplaces, and schools [7,8].
Improved monitoring of WaSH conditions is needed to track progress, improve accountability, and demonstrate impact. Monitoring data can be used to inform policy development and resource investment. Monitoring data can be used to identify opportunities to adjust the implementation strategy of a project or program at an interim stage, thus contributing to improved results.
Despite these benefits, stakeholders often do not allocate adequate resources to implement robust or sufficient WaSH monitoring [9]. Project and program monitoring do not always use consistent, specific, or relevant indicators. As a result, efforts to benchmark and report accurate data on the status of WaSH are limited. There are examples from the literature where analysis of WaSH monitoring data yielded important and valuable insights for policy and practice; but more value could have been derived if indicators were added or improved [10,11]. There is a considerable need to improve the quality and coordination of monitoring in order to identify weaknesses in data collection and to inform decisions in WaSH policy and practice [12].
An important component of effective WaSH monitoring is a framework for data collection based on a robust set of indicators. To improve quality and coordination of monitoring in WaSH, it is necessary to develop a structured process for data collection based on a set of indicators. Lorenz (2001) describes such an indicator set as “(an) aggregation of variables (that) describes a system or process such that it has significance beyond the face value of its components” [13]. Hammondet al. (2005) note two important characteristics of indicators that make them useful for decision-making: (1) they quantify information so its significance is more readily apparent; and (2) they simplify information about complex phenomena to improve communication [14]. Carefully constructed indicator sets may be useful for policymakers and other stakeholders because “they can provide valuable information on complex issues in a relatively accessible way” [15].
Selection methods for environment-related indicators are widely recognized to be “insufficiently systematic and transparent” [15]. The development and consistent use of objective and rigorous methods for indicator selection are needed for meaningful and credible WaSH monitoring. Reliable indicators facilitate comparison of projects, programs, and interventions.
In response to the need for WaSH monitoring improvements, this systematic review aims to identify methods for the selection of WaSH indicators. Existing indicator selection methods used in WaSH-related fields were reviewed. Based on the results of this review, a method for WaSH indicator selection is proposed. This review highlights indicator selection methods that can be applied to WaSH with the goal of promoting broader use and application of these methods in WaSH monitoring.
2. Methods
2.1. Search Strategy
Published, peer-reviewed literature was searched in October 2013 and May 2014 using the following electronic databases: PubMed; Web of Science; Global Health; and Academic Search Complete. The search was based on the keyword string: “indicator* AND selection AND criteria AND (environment* OR development OR public health OR water).” An expansive indicator selection literature exists beyond the field of WaSH; the authors recognize that a review of this literature could provide relevant insight to developing WaSH indicators. As such, literature from related fields was included, including environmental science and ecology, sustainability and international development, and water management. The body of indicator selection literature is vast, and the authors did not attempt to capture all of it in this review.
The search was restricted to papers for which there was an abstract and full-text article available in English. Papers were included in the review if they described methods used to identify, select and validate indicators relevant to the fields of environment, international development, and water. Studies analyzing clinical or biological indicators (e.g., fecal indicators, biomarkers, human samples) were excluded, as they are beyond the scope of this paper. Dissertations and non-peer reviewed (i.e., “grey”) literature were not included in the review. The search had no restrictions on time or location.
Int. J. Environ. Res. Public Health2016,13, 333 3 of 15
2.2. Data Extracted from Literature
Each paper was reviewed for use of distinct indicator selection methods. After the indicator selection methods were identified, a second full text review was performed to tally every method that each article used or proposed for indicator selection. A six-stage method of indicator selection was developed based on perceived relevance and the frequency with which each method was tallied in included studies.
3. Results
3.1. Systematic Literature Review 3.1.1. Search Results
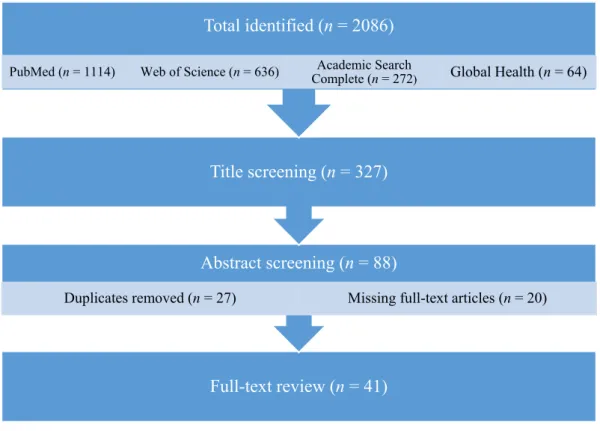
The primary literature search yielded 2086 references, with the majority of results from PubMed (53%). Title screening yielded 327 potentially relevant results. A secondary screening of abstracts yielded 152 potentially relevant papers; 88 remained after removing duplicates (27 articles) and references for which the full-text article was not available online (20 articles). Forty-one references were included after the final, full-text screening (Figure1).
Int. J. Environ. Res. Public Health2016, 13, 333 3 of 17
2.2. Data Extracted from Literature
Each paper was reviewed for use of distinct indicator selection methods. After the indicator selection methods were identified, a second full text review was performed to tally every method that each article used or proposed for indicator selection. A six-stage method of indicator selection was developed based on perceived relevance and the frequency with which each method was tallied in included studies.
3. Results
3.1. Systematic Literature Review
3.1.1. Search Results
The primary literature search yielded 2086 references, with the majority of results from PubMed (53%). Title screening yielded 327 potentially relevant results. A secondary screening of abstracts yielded 152 potentially relevant papers; 88 remained after removing duplicates (27 articles) and references for which the full-text article was not available online (20 articles). Forty-one references were included after the final, full-text screening (Figure 1).
Figure 1. Literature search flow diagram. n indicates the number of studies remaining after each identification or review stage.
3.1.2. Classification of Studies Included in Review
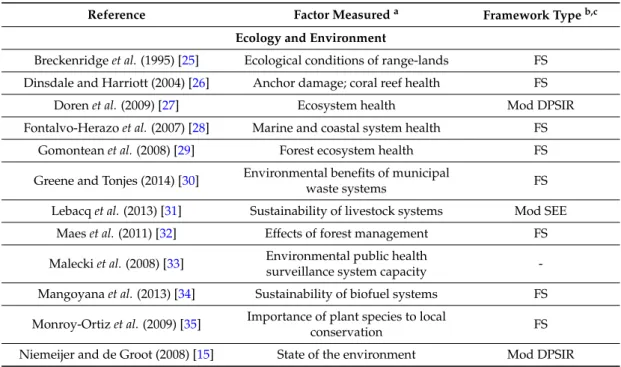
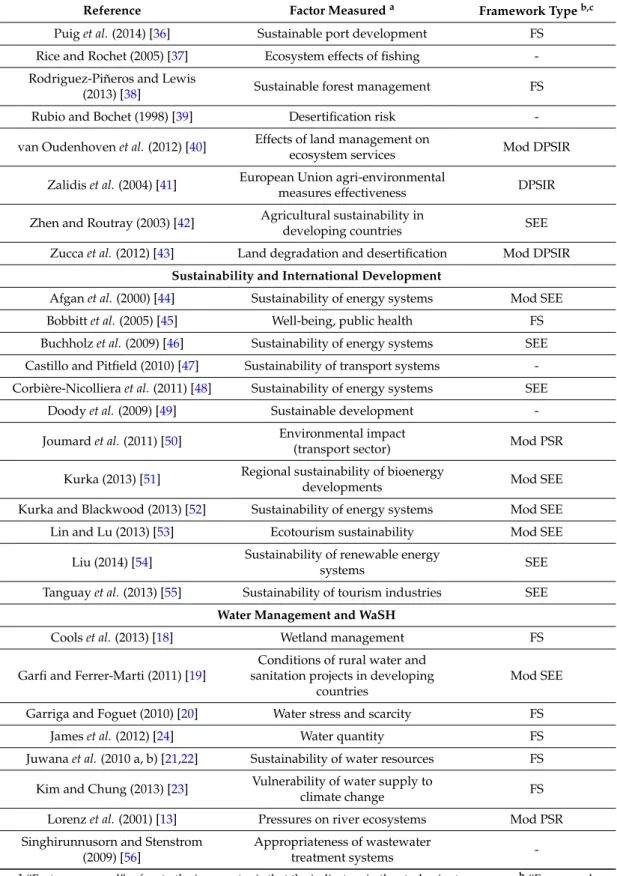
Of the 41 papers included in the review, 20 were in the fields of ecology and environment (49%); 12 papers addressed issues of sustainability and/or international development (29%); and the remaining nine were specific to water management and/or WaSH (22%) (Table 1).
The included studies aimed to measure a variety of complex concepts and used different conceptual frameworks to organize indicator sets. Ostrom notes that one major aim of a conceptual framework is to “identify the universal elements that any theory relevant to the same kind of phenomena would need to include” [16]. Hammond et al. (2005) observe that data from a large set of indicators can be diverse and confusing; as such, a framework is needed to structure information “to
Full-text review (
n
= 41)
Abstract screening (
n
= 88)
Duplicates removed (n= 27) Missing full-text articles (n= 20)
Title screening (
n
= 327)
Total identified (
n
= 2086)
PubMed (n= 1114) Web of Science (n= 636) Complete (Academic Search n= 272) Global Health (n= 64)
Figure 1. Literature search flow diagram. nindicates the number of studies remaining after each identification or review stage.
3.1.2. Classification of Studies Included in Review
Of the 41 papers included in the review, 20 were in the fields of ecology and environment (49%); 12 papers addressed issues of sustainability and/or international development (29%); and the remaining nine were specific to water management and/or WaSH (22%) (Table1).
phenomena would need to include” [16]. Hammond et al. (2005) observe that data from a large set of indicators can be diverse and confusing; as such, a framework is needed to structure information “to make it more accessible and intelligible to decision-makers and the general public” [14]. Ostrom further notes that the role of frameworks is to identify individual indicators and determine “general relationships among these elements that one needs to consider for institutional analysis” (emphasis added) [14].
Framework types frequently used to organize indicator sets include the Driving forces-Pressures-State-Impact-Response (DPSIR) (n= 5), Social-Economic-Ecologic/Environment (SEE) (n= 11), and Pressure-State-Response (PSR) (n= 2). The SEE framework is often used to describe foundational considerations for sustainability in business [17]. DPSIR and PSR are both causal chain frameworks. Causal chain frameworks are described by Neimeijer and deGroot (2005):
“In the causal chain, social and economic developments are considered driving forces that exert pressure on the environment, leading to changes in the state of the environment. In turn, these changes lead to impacts on human health, ecological systems and materials that may elicit a societal response that feeds back on the driving forces, pressures, or on the state or impacts directly.”[15]. In addition to these three framework types, 16 studies developed frameworks specific to the factor or a concept that the indicator set aimed to measure (factor specific, FS). Six studies did not use or recommend using a framework for structuring indicators (15%). A catalog of all studies included in the review and their respective fields of study are included in Table1.
Studies included that focused on WaSH or water management used diverse types of criteria to select indicators (these studies are listed in Table 1). Authors relied on consulting experts or stakeholders (whether through formal Delphi techniques or informal facilitation methods), multi-criteria analysis, or selecting indicators on anad hoc basis [18–23]. Others emphasize the importance of transparency in the process and continuous assessment of the indicators throughout their lifecycle of use in monitoring [13,24].
Table 1.Studies included in the review, grouped by field of study.
Reference Factor Measureda Framework Typeb,c
Ecology and Environment
Breckenridgeet al.(1995) [25] Ecological conditions of range-lands FS
Dinsdale and Harriott (2004) [26] Anchor damage; coral reef health FS
Dorenet al.(2009) [27] Ecosystem health Mod DPSIR
Fontalvo-Herazoet al.(2007) [28] Marine and coastal system health FS
Gomonteanet al.(2008) [29] Forest ecosystem health FS
Greene and Tonjes (2014) [30] Environmental benefits of municipal
waste systems FS
Lebacqet al.(2013) [31] Sustainability of livestock systems Mod SEE
Maeset al.(2011) [32] Effects of forest management FS
Maleckiet al.(2008) [33] Environmental public health
surveillance system capacity
-Mangoyanaet al.(2013) [34] Sustainability of biofuel systems FS
Monroy-Ortizet al.(2009) [35] Importance of plant species to local
conservation FS
Int. J. Environ. Res. Public Health2016,13, 333 5 of 15
Table 1.Cont.
Reference Factor Measureda Framework Typeb,c
Puiget al.(2014) [36] Sustainable port development FS
Rice and Rochet (2005) [37] Ecosystem effects of fishing
-Rodriguez-Piñeros and Lewis
(2013) [38] Sustainable forest management FS
Rubio and Bochet (1998) [39] Desertification risk
-van Oudenhovenet al.(2012) [40] Effects of land management on
ecosystem services Mod DPSIR
Zalidiset al.(2004) [41] European Union agri-environmental
measures effectiveness DPSIR
Zhen and Routray (2003) [42] Agricultural sustainability in
developing countries SEE
Zuccaet al.(2012) [43] Land degradation and desertification Mod DPSIR
Sustainability and International Development
Afganet al.(2000) [44] Sustainability of energy systems Mod SEE
Bobbittet al.(2005) [45] Well-being, public health FS
Buchholzet al.(2009) [46] Sustainability of energy systems SEE
Castillo and Pitfield (2010) [47] Sustainability of transport systems
-Corbière-Nicollieraet al.(2011) [48] Sustainability of energy systems SEE
Doodyet al.(2009) [49] Sustainable development
-Joumardet al.(2011) [50] Environmental impact
(transport sector) Mod PSR
Kurka (2013) [51] Regional sustainability of bioenergydevelopments Mod SEE
Kurka and Blackwood (2013) [52] Sustainability of energy systems Mod SEE
Lin and Lu (2013) [53] Ecotourism sustainability Mod SEE
Liu (2014) [54] Sustainability of renewable energysystems SEE
Tanguayet al.(2013) [55] Sustainability of tourism industries SEE
Water Management and WaSH
Coolset al.(2013) [18] Wetland management FS
Garfi and Ferrer-Marti (2011) [19]
Conditions of rural water and sanitation projects in developing
countries
Mod SEE
Garriga and Foguet (2010) [20] Water stress and scarcity FS
Jameset al.(2012) [24] Water quantity FS
Juwanaet al.(2010 a, b) [21,22] Sustainability of water resources FS
Kim and Chung (2013) [23] Vulnerability of water supply toclimate change FS
Lorenzet al.(2001) [13] Pressures on river ecosystems Mod PSR
Singhirunnusorn and Stenstrom (2009) [56]
Appropriateness of wastewater
treatment systems
-a“Factor measured” refers to the issue or topic that the indicators in the study aim to measure;b“Framework
type” refers to the organizational model used to structure the indicator set. The specific frame- work details were extracted then categorized by the types that were found;c“FS” = factor-specific = study developed a
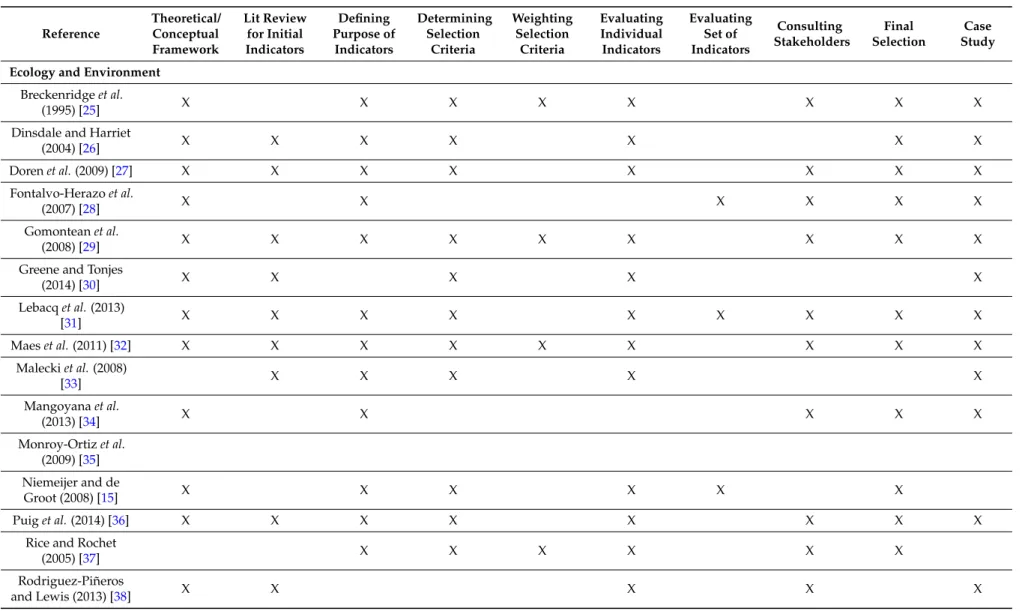
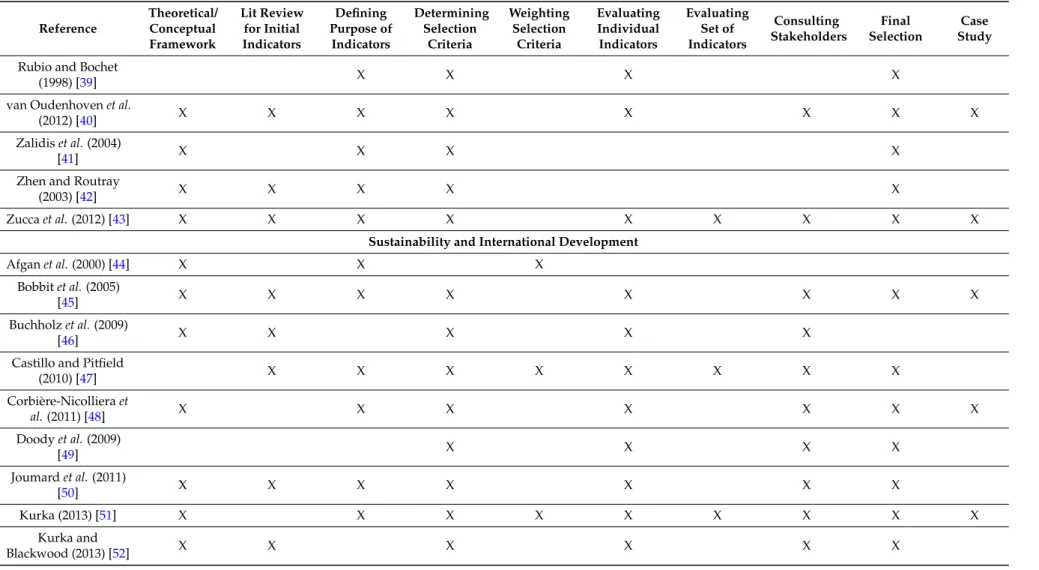
Ten methodological stages that emerged from the review were cataloged: (1) constructing a theoretical or conceptual framework (n= 33); (2) conducting a literature review to find the initial list of indicators (n= 22); (3) defining the purpose of the indicator set (n= 31); (4) determining selection criteria (n= 33); (5) weighting selection criteria (n= 8); (6) evaluating individual indicators (n= 29); (7) evaluating a set of indicators (n= 8); (8) consulting stakeholders (n= 27); (9) final indicator selection (n= 33); (10) applying methods to a case study (n= 24). The highest number of methodological stages used in a single paper was nine [29,32,45], and the lowest was four [20,39,41,49]. A description of each methodological stage is provided in Table2, and a tally of every method that each article used or proposed for indicator selection is included in Table3.
Table 2.Definitions of methods cataloged from indicator selection literature.
Method Used in Literature Definition
Theoretical/conceptual framework
Organizational structure to categorize indicators; provides the basis for the selection and combination of variables into a meaningful composite under a fit-for-purpose principle [57]
Literature review for initial indicators
Preliminary list of indicators is constructed following a thorough literature review of existing indicators for the concept in question
Defining the purpose of the indicator set The concept being measured by the indicator suite is explicitly defined
Determining selection criteria A list of quality criteria by which the initial list of indicators should be screened is defined
Weighting selection criteria
Selection criteria are rated or ranked into a weighting scheme (either qualitative or quantitative) that reflects the importance of each criterion
Evaluating individual indicators Each initial indicator is scored based on the extent to which it meets the defined selection criteria
Evaluating set of indicators
Full set of indicators is scored based on the extent to which it accurately and holistically represents the concept being measured
Consulting stakeholders
Experts or other stakeholders in the field of study are consulted for input on appropriateness of indicators, frameworks, and/or methods used
Final selection
Based on results from the criteria screening,
stakeholder/ expert feedback, or some other criteria, a final set of indicators is selected from the initial list
Case study
Int. J. Environ. Res. Public Health2016,13, 333 7 of 15
Table 3.Catalog of indicator selection methods used in included literature.
Reference
Theoretical/ Conceptual Framework
Lit Review for Initial Indicators
Defining Purpose of
Indicators
Determining Selection
Criteria
Weighting Selection
Criteria
Evaluating Individual Indicators
Evaluating Set of Indicators
Consulting Stakeholders
Final Selection
Case Study
Ecology and Environment
Breckenridgeet al.
(1995) [25] X X X X X X X X
Dinsdale and Harriet
(2004) [26] X X X X X X X
Dorenet al.(2009) [27] X X X X X X X X
Fontalvo-Herazoet al.
(2007) [28] X X X X X X
Gomonteanet al.
(2008) [29] X X X X X X X X X
Greene and Tonjes
(2014) [30] X X X X X
Lebacqet al.(2013)
[31] X X X X X X X X X
Maeset al.(2011) [32] X X X X X X X X X
Maleckiet al.(2008)
[33] X X X X X
Mangoyanaet al.
(2013) [34] X X X X X
Monroy-Ortizet al.
(2009) [35]
Niemeijer and de
Groot (2008) [15] X X X X X X
Puiget al.(2014) [36] X X X X X X X X
Rice and Rochet
(2005) [37] X X X X X X
Rodriguez-Piñeros
Table 3.Cont.
Reference
Theoretical/ Conceptual Framework
Lit Review for Initial Indicators
Defining Purpose of
Indicators
Determining Selection
Criteria
Weighting Selection
Criteria
Evaluating Individual Indicators
Evaluating Set of Indicators
Consulting Stakeholders
Final Selection
Case Study
Rubio and Bochet
(1998) [39] X X X X
van Oudenhovenet al.
(2012) [40] X X X X X X X X
Zalidiset al.(2004)
[41] X X X X
Zhen and Routray
(2003) [42] X X X X X
Zuccaet al.(2012) [43] X X X X X X X X X
Sustainability and International Development
Afganet al.(2000) [44] X X X
Bobbitet al.(2005)
[45] X X X X X X X X
Buchholzet al.(2009)
[46] X X X X X
Castillo and Pitfield
(2010) [47] X X X X X X X X
Corbière-Nicollieraet
al.(2011) [48] X X X X X X X
Doodyet al.(2009)
[49] X X X X
Joumardet al.(2011)
[50] X X X X X X X
Kurka (2013) [51] X X X X X X X X X
Kurka and
Int. J. Environ. Res. Public Health2016,13, 333 9 of 15
Table 3.Cont.
Reference
Theoretical/ Conceptual Framework
Lit Review for Initial Indicators
Defining Purpose of
Indicators
Determining Selection
Criteria
Weighting Selection
Criteria
Evaluating Individual Indicators
Evaluating Set of Indicators
Consulting Stakeholders
Final Selection
Case Study
Lin and Lu (2013) [53] X X X X X X
Liu (2014) [54] X X X X X X
Tanguayet al.(2013)
[55] X X X X X X X
Water Management and WaSH
Coolset al.(2013) [18] X X X X X X
Garfi and Ferrer-Marti (2011)
[19]
X X X X X X
Garriga and Foguet
(2010) [20] X X X X
Jameset al.(2012) [24] X X X X X X X X X
Juwanaet al.(2010 a,
b) [21,22] X X X X X X
Kim and Chung
(2013) [23] X X X X X X X
Lorenzet al.(2001)
[13] X X X X
Singhirunnusorn and
3.2. Proposed Method for Selecting Indicators for WaSH Monitoring
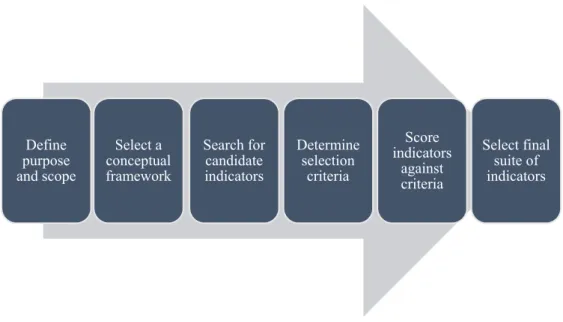
Using the systematic review results (Section3.1), a six step method for selecting WaSH indicators is proposed. The six steps are selected because of their frequency of use in studies included in the systematic review and their applicability to WaSH monitoring (Figure2).
3.2. Proposed Method for Selecting Indicators for WaSH Monitoring
Using the systematic review results (Section 3.1), a six step method for selecting WaSH indicators is proposed. The six steps are selected because of their frequency of use in studies included in the systematic review and their applicability to WaSH monitoring (Figure 2).
Figure 2. Proposedmethod for selection of indicators for WaSH monitoring.
3.2.1. Define Purpose and Scope
To produce a useful and meaningful set of indicators, it is necessary to define the concept of interest for monitoring and establish the purpose and scope of the indicator set [15]. This stage helps to frame the subsequent steps by establishing a precisely defined set of goals. The concept and purposes may be broadly or narrowly defined, depending on user needs and the intended audience. A possible example of a purpose and scope of indicators applied to WaSH is “to identify a set of elements that reflect the status of WaSH in school settings on the national level.”
3.2.2. Select a Conceptual Framework
The purpose of a conceptual framework is to provide organizational structure for categorizing and combining indicators in a logical and useful way [58]. Existing frameworks that could possibly function for WaSH indicator sets include Driving forces-Pressures-State-Impact-Response (DPSIR), Social-Economic-Ecologic/Environment (SEE), and Inputs-Outputs-Outcomes-Impacts.
3.2.3. Search for Candidate Indicators
Candidate indicators are extracted through a literature review of existing WaSH indicators and other relevant WaSH literature. New indicators can also be proposed during this stage if deemed appropriate by researchers or policy-makers.
3.2.4. Determine the Selection Criteria
Candidate indicators should be evaluated using indicator selection criteria. Examples of indicator selection criteria include:
• Measurable: Indicator is straightforward to measure and quantifiable [59]
• Reliable: Indicator measurement produces the same value if repeated in the same way on the same population at almost the same time [60]
• Data available: Data are available and accessible, accurate, comparable over time, complete with historical information and covering sufficient geographic areas [57]
Define purpose and scope
Select a conceptual framework
Search for candidate indicators
Determine selection
criteria
Score indicators
against criteria
Select final suite of indicators
Figure 2.Proposed method for selection of indicators for WaSH monitoring.
3.2.1. Define Purpose and Scope
To produce a useful and meaningful set of indicators, it is necessary to define the concept of interest for monitoring and establish the purpose and scope of the indicator set [15]. This stage helps to frame the subsequent steps by establishing a precisely defined set of goals. The concept and purposes may be broadly or narrowly defined, depending on user needs and the intended audience. A possible example of a purpose and scope of indicators applied to WaSH is “to identify a set of elements that reflect the status of WaSH in school settings on the national level.”
3.2.2. Select a Conceptual Framework
The purpose of a conceptual framework is to provide organizational structure for categorizing and combining indicators in a logical and useful way [58]. Existing frameworks that could possibly function for WaSH indicator sets include Driving forces-Pressures-State-Impact-Response (DPSIR), Social-Economic-Ecologic/Environment (SEE), and Inputs-Outputs-Outcomes-Impacts.
3.2.3. Search for Candidate Indicators
Candidate indicators are extracted through a literature review of existing WaSH indicators and other relevant WaSH literature. New indicators can also be proposed during this stage if deemed appropriate by researchers or policy-makers.
3.2.4. Determine the Selection Criteria
Candidate indicators should be evaluated using indicator selection criteria. Examples of indicator selection criteria include:
• Measurable: Indicator is straightforward to measure and quantifiable [59]
Int. J. Environ. Res. Public Health2016,13, 333 11 of 15
• Data available: Data are available and accessible, accurate, comparable over time, complete with historical information and covering sufficient geographic areas [57]
• Sensitive: Indicator reveals important changes in the factor of interest [60]
• Valid: There must be an accurate correlation between an indicator and the issue for which it is supposed to proxy [60]
3.2.5. Score Indicators against Criteria
The adopted selection criteria can be used to screen candidate indicators. Each candidate indicator is scored for its suitability in relation to each criterion. The indicator is assigned a score of 0 if the indicator does not meet the selection criterion, or 1 if the indicator does meet the selection criterion. A score of 0.5 is assigned if the indicator meets the selection criteria in some instances and not in others.
3.2.6. Select Final Set of Indicators
Based on the indicator scoring results, a final set of indicators is chosen. In order to obtain a final set that includes a relatively even spread of indicators across each step of the selected framework, only indicators that receive scores at least one standard deviation above the mean within each category can be selected.
4. Discussion
In this study, we reviewed methods of indicator selection and identified six methodological stages for selecting indicators for WaSH. Indicator selection methods are not always used in WaSH which is one of the reasons why this review was conducted. We present a summary of indicator selection methods for environment, international development, and water. This review provides a foundation for critical assessment of indicator selection methods and can be used to inform future efforts to construct indicator sets in WaSH.
The findings display considerable homogeneity in methods for indicator selection across fields of study, providing a foundation for the construction of commonly used methods for indicator selection. This homogeneity in indicator selection methods is evident in two ways: the relatively small number of distinct methods identified (ten methods were identified across 41 studies); and the frequency with which each method was used across the studies (eight of the methods were used by over half of the studies).
Though homogeneity and frequency of use are not necessarily indicative of good practices or appropriateness for the purposes of this study, it does provide some validation of the selected methods, as it suggests that other researchers have found these methods to be useful. The methods provide logical organization to the indicator selection process, eliminating the arbitrariness often associated with indicator selection. Additionally, the defined process improves transparency, allowing other researchers or stakeholders to better understand each stage in the decision-making process.
Indicators that can be used across studies, projects, and interventions are needed in WaSH. Clear, consistent indicators in WaSH can be used to make comparisons in status over space and time. They can be used to describe complex implementation and they help to provide an overview of projects and programs. Data collected from indicators can be used to identify trends and patterns and can be used to make improvements over time. Data can be used in making important policy and practice decisions. Comparable indicators can be used to measure performance of projects, programs or countries [61]. In contrast, poor indicators may produce data that lead to an incorrect understanding of a project or program.
A limitation of this study was the exclusion of grey literature, and there are useful resources available [63]. We only reviewed English language publications which is another limitation. This study revealed a number of areas for future research. Further analysis is needed to determine how to evaluate interrelations between indicators. Additional methodological refinement is needed to determine the usefulness of a weighting scheme for selection criteria. Few studies comment on the strengths and weaknesses of their indicator selection criteria. Assessment of strengths and weaknesses would be valuable to determine which methods are most useful when selecting indicators for WaSH projects and programs.
Further work is needed to determine appropriate scale and weights for consolidation of the indicators into a composite index. A composite index is a compilation of individual indicators into a single value on the basis of an underlying model [57]. Such composite indices are controversial because of their tendency to mask important aspects of complex concepts; however, such an index, if constructed properly, can serve as an important tool to facilitate monitoring and interpreting general trends in WaSH conditions globally. Finally, more research is needed to determine how a set of indicators can better monitor and reflect needs on scales ranging from household and community level to national and global levels.
5. Conclusions
This review highlights indicator selection methods that can be applied to WaSH monitoring. The review fills a knowledge gap since many WaSH monitoring initiatives do not always use well designed indicators. This review may help promote broader use and application of these methods in WaSH monitoring.
Acknowledgments: We thank Jackie MacDonald-Gibson, Jill Stewart, Georgia Kayser, Urooj Amjad, and Kristen Downs for their feedback and advice throughout the writing of this paper. We thank UNC Health Sciences Librarian Mellanye Lackey for suggestions regarding systematic literature review methods. This project was funded in part by the Robertson Scholars Leadership Program and the Conrad N. Hilton Foundation. Ryan Cronk was supported by a training grant from the National Institute of Environmental Health Sciences (Grant Number: T32ES007018).
Author Contributions:Stefanie Schwemlein, Ryan Cronk, and Jamie Bartram contributed to the design of the study. Stefanie Schwemlein and Ryan Cronk conducted the review. Stefanie Schwemlein wrote the first draft of the manuscript; all authors contributed to revising the manuscript; all authors read and approved the final manuscript. Conflicts of Interest:The authors declare no conflict of interest.
References
1. Bartram, J.; Cairncross, S. Hygiene, sanitation, and water: Forgotten foundations of health.PLoS Med.2010, 7, e1000367. [CrossRef] [PubMed]
2. United Nations General Assembly.Draft Resolution a/69/l.85: Transforming Our World: The 2030 Agenda for Sustainable Development; United Nations: New York, NY, USA, 2015.
3. WHO/UNICEF.Progress on Sanitation and Drinking Water–2015 Update and mdg Assessment; WHO: New York, NY, USA, 2015.
4. Amjad, U.; Ojomo, E.; Downs, K.; Cronk, R.; Bartram, J. Rethinking sustainability, scaling up, and enabling environment: A framework for their implementation in drinking water supply.Water2015,7, 1497–1514. [CrossRef]
5. Bain, R.; Cronk, R.; Hossain, R.; Bonjour, S.; Onda, K.; Wright, J.; Yang, H.; Slaymaker, T.; Hunter, P.; Pruss-Ustun, A.;et al. Global assessment of exposure to faecal contamination through drinking water based on a systematic review.Trop. Med. Int. Health2014,19, 917–927. [CrossRef] [PubMed]
6. Bain, R.; Cronk, R.; Wright, J.; Yang, H.; Slaymaker, T.; Bartram, J. Fecal contamination of drinking-water in low- and middle-income countries: A systematic review and meta-analysis.PLoS Med.2014,11, e1001644. [CrossRef] [PubMed]
Int. J. Environ. Res. Public Health2016,13, 333 13 of 15
8. Cronk, R.; Slaymaker, T.; Bartram, J. Monitoring drinking water, sanitation, and hygiene in non-household settings: Priorities for policy and practice. Int. J. Hygiene Environ. Health2015,218, 694–703. [CrossRef] [PubMed]
9. Kusek, J.; Rist, R. Ten Steps to a Results-Based Monitoring and Evaluation System: A Handbook for Development Practitioners. Available online: https://openknowledge.worldbank.org/bitstream/handle/ 10986/14926/296720PAPER0100steps.pdf?sequence=1 (accessed on 15 March 2016).
10. Fisher, M.B.; Shields, K.F.; Chan, T.U.; Christenson, E.; Cronk, R.D.; Leker, H.; Samani, D.; Apoya, P.; Lutz, A.; Bartram, J. Understanding handpump sustainability: Determinants of rural water source functionality in the greater Afram plains region of Ghana.Water Resour. Res.2015,51, 8431–8449. [CrossRef]
11. Jordanova, T.; Cronk, R.; Obando, W.; Medina, O.Z.; Kinoshita, R.; Bartram, J. Water, sanitation, and hygiene in schools in low socio-economic regions in Nicaragua: A cross-sectional survey. Int. J. Environ. Res. Public Health2015,12, 6197–6217. [CrossRef] [PubMed]
12. Bartram, J.; Brocklehurst, C.; Fisher, M.B.; Luyendijk, R.; Hossain, R.; Wardlaw, T.; Gordon, B. Global monitoring of water supply and sanitation: History, methods and future challenges. Int. J. Environ. Res. Public Health2014,11, 8137–8165. [CrossRef] [PubMed]
13. Lorenz, C.M.; Gilbert, A.J.; Cofino, W.P. Indicators for transboundary river management.Environ. Manag. 2001,28, 115–129. [CrossRef]
14. Hammond, A.; Adriannse, A.; Rodenburg, E.; Bryant, D.; Woodward, R.A Systematic Approach to Measuring and Reporting on Environmental Policy Performance in the Context of Sustainable Development; World Resources Institute: Washington, DC, USA, 1995.
15. Niemeijer, D.; de Groot, R.S. A conceptual framework for selecting environmental indicator sets.Ecol. Indic. 2008,8, 14–25. [CrossRef]
16. Ostrom, E. Background on the institutional analysis and development framework.Policy Stud. J.2011,39, 7–27. [CrossRef]
17. Elkington, J. Enter the triple bottom line. InThe Triple Bottom Line: Does It All Add Up; Taylor & Francis: Abingdon, VI, USA, 2004; pp. 1–16.
18. Cools, J.; Diallo, M.; Boelee, E.; Liersch, S.; Coertjens, D.; Vandenberghe, V.; Kone, B. Integrating human health into wetland management for the inner Niger delta, Mali. Environ. Sci. Policy2013,34, 34–43. [CrossRef]
19. Garfi, M.; Ferrer-Marti, L. Decision-making criteria and indicators for water and sanitation projects in developing countries.Water Sci. Technol.: J. Int. Assoc. Water Poll. Res.2011,64, 83–101. [CrossRef]
20. Garriga, R.G.; Foguet, A.P. Improved Method to Calculate a Water Poverty Index at Local Scale. Avaiable online: http://upcommons.upc.edu/bitstream/handle/2117/10221/improvedmethodcalculate.pdf (accessed on 15 March 2016).
21. Juwana, I.; Perera, B.; Muttil, N. A water sustainability index for west Java-part 2: Refining the conceptual framework using Delphi technique.Water Sci. Technol.2010,62, 1641–1652. [CrossRef] [PubMed]
22. Juwana, I.; Perera, B.; Muttil, N. A water sustainability index for west Java-part 1: Developing the conceptual framework.Water Sci. Technol.2010,62, 1629–1640. [CrossRef] [PubMed]
23. Kim, Y.; Chung, E.-S. Fuzzy vikor approach for assessing the vulnerability of the water supply to climate change and variability in South Korea.Appl. Math. Model.2013,37, 9419–9430. [CrossRef]
24. James, C.A.; Kershner, J.; O’Neill, S.; Levin, P.S. A methodology for evaluating and ranking water quantity indicators in support of ecosystem-based management. Environ. Manag. 2012,49, 703–719. [CrossRef] [PubMed]
25. Breckenridge, R.P.; Kepner, W.G.; Mouat, D.A. A process for selecting indicators for monitoring conditions of rangeland health.Environ. Monit. Assess.1995,36, 45–60. [CrossRef] [PubMed]
26. Dinsdale, E.A.; Harriott, V.J. Assessing anchor damage on coral reefs: A case study in selection of environmental indicators.Environ. Manag.2004,33, 126–139.
27. Doren, R.F.; Trexler, J.C.; Gottlieb, A.D.; Harwell, M.C. Ecological indicators for system-wide assessment of the greater everglades ecosystem restoration program.Ecol. Indic.2009,9, S2–S16. [CrossRef]
29. Gomontean, B.; Gajaseni, J.; Edwards-Jones, G.; Gajaseni, N. The development of appropriate ecological criteria and indicators for community forest conservation using participatory methods: A case study in northeastern Thailand.Ecol. Indic.2008,8, 614–624. [CrossRef]
30. Greene, K.L.; Tonjes, D.J. Quantitative assessments of municipal waste management systems: Using different indicators to compare and rank programs in New York State.Waste Manag.2014,34, 825–836. [CrossRef] [PubMed]
31. Lebacq, T.; Baret, P.V.; Stilmant, D. Sustainability indicators for livestock farming. A review. Agron. Sustain. Dev.2013,33, 311–327. [CrossRef]
32. Maes, W.H.; Fontaine, M.; Rongé, K.; Hermy, M.; Muys, B. A quantitative indicator framework for stand level evaluation and monitoring of environmentally sustainable forest management.Ecol. Indic.2011,11, 468–479. [CrossRef]
33. Malecki, K.C.; Resnick, B.; Burke, T.A. Effective environmental public health surveillance programs: A framework for identifying and evaluating data resources and indicators.J. Public Health Manag. Pract. 2008,14, 543–551. [CrossRef] [PubMed]
34. Mangoyana, R.B.; Smith, T.F.; Simpson, R. A systems approach to evaluating sustainability of biofuel systems. Renew. Sustain. Energy Rev.2013,25, 371–380. [CrossRef]
35. Monroy-Ortiz, C.; García-Moya, E.; Romero-Manzanares, A.; Sánchez-Quintanar, C.; Luna-Cavazos, M.; Uscanga-Mortera, E.; Gonzalez-Romero, V.; Flores-Guido, J.S. Participative generation of local indicators for conservation in Morelos, Mexico.Int. J. Sustain. Dev. World Ecol.2009,16, 381–391. [CrossRef]
36. Puig, M.; Wooldridge, C.; Darbra, R.M. Identification and selection of environmental performance indicators for sustainable port development.Mar. Pollut. Bull.2014,81, 124–130. [CrossRef] [PubMed]
37. Rice, J.C.; Rochet, M.-J. A framework for selecting a suite of indicators for fisheries management. ICES J. Mar. Sci.2005,62, 516–527. [CrossRef]
38. Rodriguez-Piñeros, S.; Lewis, D.K. Analysis and deliberation as a mechanism to assess changes in preferences for indicators of sustainable forest management: A case study in Puebla, Mexico.J. Environ. Manag.2013, 128, 52–61. [CrossRef] [PubMed]
39. Rubio, J.L.; Bochet, E. Desertification indicators as diagnosis criteria for desertification risk assessment in europe.J. Arid Environ.1998,39, 113–120. [CrossRef]
40. Van Oudenhoven, A.P.; Petz, K.; Alkemade, R.; Hein, L.; de Groot, R.S. Framework for systematic indicator selection to assess effects of land management on ecosystem services. Ecol. Indic. 2012, 21, 110–122. [CrossRef]
41. Zalidis, G.C.; Tsiafouli, M.A.; Takavakoglou, V.; Bilas, G.; Misopolinos, N. Selecting agri-environmental indicators to facilitate monitoring and assessment of EU agri-environmental measures effectiveness. J. Environ. Manag.2004,70, 315–321. [CrossRef] [PubMed]
42. Zhen, L.; Routray, J.K. Operational indicators for measuring agricultural sustainability in developing countries.Environ. Manag.2003,32, 34–46. [CrossRef] [PubMed]
43. Zucca, C.; Della Peruta, R.; Salvia, R.; Sommer, S.; Cherlet, M. Towards a world desertification Atlas. Relating and selecting indicators and data sets to represent complex issues.Ecol. Indic.2012,15, 157–170. [CrossRef] 44. Afgan, N.H.; da Graça Carvalho, M. Energy system assessment with sustainability indicators. InSustainable
Assessment Method for Energy Systems; Springer: Berlin, Germany, 2000; pp. 83–125.
45. Bobbitt, L.; Green, S.; Candura, L.; Morgan, G.A. The development of a county level index of well-being. Soc. Indic. Res.2005,73, 19–42. [CrossRef]
46. Buchholz, T.; Luzadis, V.A.; Volk, T.A. Sustainability criteria for bioenergy systems: Results from an expert survey.J. Clean. Prod.2009,17, S86–S98. [CrossRef]
47. Castillo, H.; Pitfield, D.E. Elastic—A methodological framework for identifying and selecting sustainable transport indicators.Transp. Res. Transp. Environ.2010,15, 179–188. [CrossRef]
48. Corbière-Nicollier, T.; Blanc, I.; Erkman, S. Towards a global criteria based framework for the sustainability assessment of bioethanol supply chains: Application to the Swiss dilemma: Is local produced bioethanol more sustainable than bioethanol imported from Brazil?Ecol. Indic.2011,11, 1447–1458. [CrossRef] 49. Doody, D.; Kearney, P.; Barry, J.; Moles, R.; O’Regan, B. Evaluation of the Q-method as a method of public
Int. J. Environ. Res. Public Health2016,13, 333 15 of 15
50. Joumard, R.; Gudmundsson, H.; Folkeson, L. Framework for Assessing Indicators of Environmental Impacts in the Transport Sector. Available online: https://hal.archives-ouvertes.fr/hal-00657820/document (accessed on 15 March 2016).
51. Kurka, T. Application of the analytic hierarchy process to evaluate the regional sustainability of bioenergy developments.Energy2013,62, 393–402. [CrossRef]
52. Kurka, T.; Blackwood, D. Participatory selection of sustainability criteria and indicators for bioenergy developments.Renew. Sustain. Energy Rev.2013,24, 92–102. [CrossRef]
53. Lin, L.-Z.; Lu, C.-F. Fuzzy group decision-making in the measurement of ecotourism sustainability potential. Group Decis. Negot.2013,22, 1051–1079. [CrossRef]
54. Liu, G. Development of a general sustainability indicator for renewable energy systems: A review. Renew. Sustain. Energy Rev.2014,31, 611–621. [CrossRef]
55. Tanguay, G.A.; Rajaonson, J.; Therrien, M.-C. Sustainable tourism indicators: Selection criteria for policy implementation and scientific recognition.J. Sustain. Tour.2013,21, 862–879. [CrossRef]
56. Singhirunnusorn, W.; Stenstrom, M.K. Appropriate wastewater treatment systems for developing countries: Criteria and indictor assessment in Thailand. Water Sci. Technol. Water Pollut. Res. 2009,59, 1873–1884. [CrossRef] [PubMed]
57. Nardo, M.; Saisana, M.; Saltelli, A.; Tarantola, S.; Hoffman, A.; Giovannini, E.Handbook on Constructing Composite Indicators: Methodology and User Guide; OECD publishing: Paris, France, 2005.
58. Commission, J.R.C.-E. Handbook on Constructing Composite Indicators: Methodology And User Guide; OECD publishing: Paris, France, 2008.
59. Dale, V.H.; Beyeler, S.C. Challenges in the development and use of ecological indicators.Ecol. Indic.2001,1, 3–10. [CrossRef]
60. World Health Organization. Selecting Reproductive Health Indicators: A Guide for District Managers; WHO: Geneva, Switzerland, 1997.
61. Luh, J.; Cronk, R.; Bartram, J. Assessing progress towards public health, human rights, and international development goals using frontier analysis.PLoS ONE2016,11, e0147663. [CrossRef] [PubMed]
62. Kostyla, C.; Bain, R.; Cronk, R.; Bartram, J. Seasonal variation of fecal contamination in drinking water sources in developing countries: A systematic review. Sci. Total Environ. 2015,514, 333–343. [CrossRef] [PubMed]
63. NHS Institute for Innovation and Improvement.The Good Indicators Guide: Understanding How to Use and Choose Indicators; NHS Institute for Innovation and Improvement: Coventry, UK, 2008.