N
K CELL CYTOTOXICITY IN INFLUENZA-
INFECTED MICE WITH DIETVARIATIONS
by: Usman Saqib
Honors Thesis Department of Nutrition University of North Carolina
2017
Approved:
Advisor
Abstract
Obesity is epidemic that affects more than a third of the U.S. population. Additionally, the influenza virus is an infectious disease that affects millions of people and claims a quarter to half a million lives each year. The few studies that have been conducted on these two factors and their effect on immune response have found that obese influenza-infected mice had suppressed immune function in combatting the influenza infection as well as reduced expression of
proinflammatory cytokines and decreased NK cell cytotoxicity. In this study, we expand on this topic and explore the effects of NK cell cytotoxicity with diet-induced weight change in
influenza-infected mice. One of the goals of this study is to determine if beneficial weight change from a metabolically obese mouse to lean plays a significant role in restoring NK cell function. Upon analyzing the data, we found that weight change did not play a significant role affecting NK cell cytotoxicity. Furthermore, we found that the original weight status of the mouse had similar NK cell function and so mice that were originally lean, regardless of if they underwent weight change, had a significantly greater NK cell cytotoxicity than if the mouse was originally obese. I believe that these studies are relevant to global public health and preventative medicine because if we are able to determine how weight change effects the immune function in influenza-infected models, we will be better able to understand how to help certain individuals based on their weight status.
Introduction
Obesity and the Immune System
diabetes, and cancer. Obesity trends have been growing globally as well as nationally and in the last decade alone the prevalence of adult obesity has increased 5.5% in the United States. The most recent (2011-2014) figures from the CDC indicate that 36.5% of U.S. adults and 17.2% of U.S. children are obese (1). More importantly obesity has shown to result in altered immune response leading to increased susceptibility to bacterial infection, chronic increases in pro-inflammatory response, and even increased vulnerability to viral infections (2). With a little over a third of the population dealing with the disease and its many health risk factors, obesity
prevention and treatment plays a crucial role in the sustainability of a healthy population.
antigens. These two responses also develop an “immunological memory” in order to handle subsequent attacks by the same pathogens (3).
Natural Killer Cells
Natural killer cells, also known as NK cells, are large, granular lymphocytes belonging to the innate immune system. NK cells are primarily developed in the bone marrow, but are found in the lungs, liver, lymph, and spleen, with the spleen being the target tissue for this study (5). NK cells serve several important functions most importantly in response to viral infections and tumor formations. In terms of viral infections, such as influenza, NK cells are recruited through two mechanisms. Either they are stimulated by direct engagement on their activating receptors by viral ligands or by the activation of chemokines and cytokines, such as interferon gamma (IFN-γ) and TNF-α, produced by other components of the immune system. These complex receptor interactions elude to the point that NK cells have more role in adaptive immunity than previously thought and why more research is being done about the specific roles NK cells play in this alternative branch of the immune system (5,6).
they decrease MHC-I translation. On a side note, NK cells have two classes of surface receptors, activating and inhibitory. It is the inhibitory receptors on the cell surfaces of NK cells which sense a down regulation of the MHC-I molecules. This mechanism is the indicator for NK cells that the cell is not functioning normally and has lost the sense of “self”. The second mechanism mentioned earlier is through the use of activating ligands on the cell surfaces of virus-infected and cancer cells. One example is that NK cells that carry a receptor such as Ly94H which recognizes ligands produced by virally-infected cells like m157 (6-8). When the NK cell
encounters the correct ligand for its activating receptor it will activate its cytotoxic ability and be able to destroy the cell. NK cells exocytose intracellular granules such as perforin and other granzymes to create pores in the target cell membrane and induce apoptosis (9). Because there is an array of receptor and ligand interactions, NK cell mechanisms are still studied extensively seeing as how they work synergistically with other aspects of the immune system to recognize and ultimately destroy virus-infected and tumor cells.
Influenza and Obesity’s Effect on NK Cells
Influenza’s effects have also been studied with the immune system, specifically NK cells. Following an infection with the influenza virus, NK cells are recruited to lung and other infected tissues with various signals such as interferon gamma. These NK cells function to destroy the influenza-infected cells as well as help in adaptive immunity to the influenza virus. Various experiments, human and murine, have looked at NK cell function with influenza virus. One murine study found that certain receptors NKp46/NCR1 were essential in influenza response by NK cells. Knockout mice without these NK receptors had increased viral titers compared to the normal wild-type mice. Additionally, a human found during the pandemic of H1N1 that
individuals had decreased numbers of peripheral blood NK cells compared to their healthy counterparts (8). However, much more research needs to be done to determine how influenza and obesity play a role in NK cell function.
The central literature that this study is developed from explores the immune response of diet-induced obese mice compared to normal lean mice. The study found that NK cell
cytotoxicity and enumeration was significantly reduced in the influenza-infected mice in the lung and spleen. In this study we wanted to expand on this association and explore the effects of weight change on NK cell cytotoxicity. By creating two additional groups of mice, lean-to-obese and obese-to-lean, we would be able to potentially see if weight change could restore NK
function (2).
Methods
Mice Growth and Diet
for this study. The mice are obtained at 6 weeks of age and are acclimated for one week at the UNC School of Medicine Animal Colony. The mice were then randomly placed into two groups to induce the initial weight status. One group was fed normal chow (low fat) to maintain a metabolically lean weight status while the second group was put on a high fat diet to induce obesity. Additionally, the mice were also infected with influenza in the first 22 weeks to create an influenza-infected mouse model for this study. At the end of 22 weeks, both groups were randomly divided into two additional groups. Half would remain on the same diet and half would switch to the alternate (low or high fat) diet to induce weight change. After 15 weeks on the weight altering diet, the mice were now in four distinct groups: always lean, always obese, lean-to-obese, and obese-to-lean. The mice were then euthanized and spleens were extracted. Jenny Rebeles of the Beck lab was the primary animal handler and caretaker for the mouse study population.
YAC-1 Cell Growth and Maintenance
To perform the NK cytotoxicity assay, target cells are required to interact with the spleen cells of the mice. The cells obtained as the target for the spleen NK cells were YAC-1 cancer cell line which is commonly used for NK cell studies. These cells were cultured in 75 cm2 culture flasks containing 7.5 mL of RPMI 1640 (ThermoFisher) with 10% fetal bovine serum and 1% Pen-strep and stored in an incubator at 37°C with 5% CO2. The cells were split in their
YAC-1 cells were split 24 hours before to ensure that they were in an upward growth phase and not too old. Splitting these cells the day before allowed them to be fresh and ensure the greatest viability for the experimental assay.
Spleen Extraction and Cell Enumeration
To obtain the spleenocytes to use for the cytotoxicity assay, spleens were extracted from the mice the same day they were euthanized. The entire spleen was removed and placed in a 10% FBS RPMI media with Pen-Strep on ice. Any fat tissue or adiposity was separated from the spleen tissue and discarded. The end of a 5 mL syringe was used to crush and dissolve the spleen tissue in the spleen media. The aim was to obtain a single cell suspension of the spleen media, therefore this was done thoroughly until there were no visible tissue clumps remaining. The solution was then run through a 40 μm nylon mesh cell strainer to separate the spleen tissue and have single cell spleen suspension in the spleen media. This solution was then centrifuged at 300 x G for 8 minutes at 8° C. One mL of ammonium-Chloride-Potassium (ACK) lysis buffer was added for 1 minute at room temperature to lyse red blood cells from the spleen solution which would interfere with spleen cell enumeration. Visible cell debris would form after this step and would be removed by pipette. This step was repeated 2 to 3 times with the ACK lysis buffer until there was no visible layer of blood after centrifuging. The spleen pellet was then suspended in 1 milliliter of spleen media and placed on ice until cell counting.
At this stage in the procedure the YAC-1 cells were also prepped so that both
were run to determine the optimal number of target cells (YAC-1 cancer cells) to use. In the October 4, 2016 experiment 10,000 YAC-1 cells per well were used whereas in the December 20, 2016 experiment it was 40,000 YAC-1 cells per well. For spleenocytes the ratios were determined based off the YAC-1 target cells in the respective ratios listed above. These cells were counted by staining with Trypan Blue at a 1:1 ratio of cells to Trypan Blue. The cells per mL were calculated accordingly and the cell solutions, spleenocyte and YAC-1 cells, were diluted to equal their target cells per mL.
Cytotoxicity Assay
The assay used in this study was the CytoTox 96® Non-Radioactive Cytotoxicity Assay developed by Promega (13). This is an alternative and safer procedure compared to the
previously used radioactive Chromium release cytotoxicity assays. The CytoTox 96 assay works by measuring lactate dehydrogenase (LDH) which is released upon cell death. LDH is an
enzyme that converts lactate to pyruvate and is present is most cells including the YAC-1 tumor cells. The reagent solution, which is a part of the assay kit, contains tetrazolium salt or
percent cytotoxicity of their NK cells that each mouse in the four diet groups had. This would then allow us to compare cytotoxicites between the four groups and determine NK cell
effectiveness.
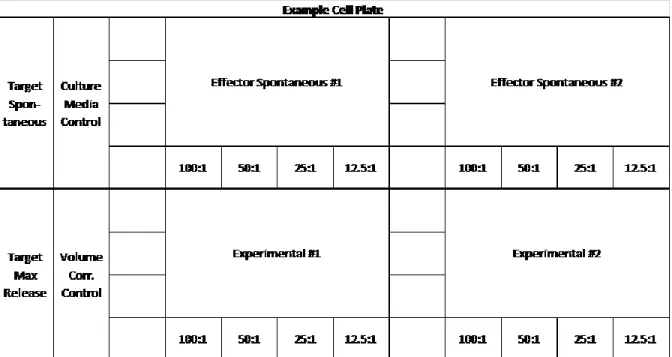
The assay plates used were standard 96 V-bottom cell plates. The plates were all setup with either control or experimental wells in either triplicates or quadruplicates. The first set of wells were the experimental wells. These contained 100 uL of the YAC-1 target cells, 100 uL spleenocytes at the four ratios 100:1, 50:1, 25:1, and 12.5:1 of spleen-to-cancer cells (in the 12/20/16 experiment 100:1 ratio was removed and 6.25:1 ratio was added). Adjacent to each of these wells was the effector spontaneous LDH release wells which contained 100 uL of culture media, 100 uL of spleenocytes in order to determine how much LDH is released naturally from the spleenocytes themselves through leaking, apoptosis, or etc. Next a target cell (YAC-1)
Figure 1. Example setup of the cell plate with all six well types described above. Each 96
well plate can hold two mouse spleen samples.
Running the Cytotoxicity Assay
Once plate setup was completed, the plate was placed in an incubator (37°C, 5% CO2) for four hours to allow time for the NK cells and target YAC-1 tumor cells to interact. In the
of Stop solution was added to each well to end the INT to red formazan reaction. Finally, the plate was placed in a plate reader and the absorbance values were recorded at 490 nm.
Calculations
After absorbance values were recorded, the percent cytotoxicity for each mouse was calculated incorporating the background and spontaneous release wells using the following formula (13).
% 𝐶𝑦𝑡𝑜𝑡𝑜𝑥𝑖𝑐𝑖𝑡𝑦 = 𝐸𝑥𝑝𝑒𝑟𝑖𝑚𝑒𝑛𝑡𝑎𝑙 − 𝐸𝑓𝑓𝑒𝑐𝑡𝑜𝑟 𝑆𝑝𝑜𝑛𝑡𝑎𝑛𝑒𝑜𝑢𝑠 − 𝑇𝑎𝑟𝑔𝑒𝑡 𝑆𝑝𝑜𝑛𝑡𝑎𝑛𝑒𝑜𝑢𝑠 𝑇𝑎𝑟𝑔𝑒𝑡 𝑀𝑎𝑥𝑖𝑚𝑢𝑚 − 𝑇𝑎𝑟𝑔𝑒𝑡 𝑆𝑝𝑜𝑛𝑡𝑎𝑛𝑒𝑜𝑢𝑠 ∗ 100
Equation 1. Formula used to calculate percent cytotoxicity for each mouse at the four
effector-to-target cell ratios.
Statistical Design
An ANOVA test was run for the four mice groups using SAS statistical software. A t-test was run after combining the groups into two groups to determine significance. Differences were considered significant at a P < 0.05.
Results
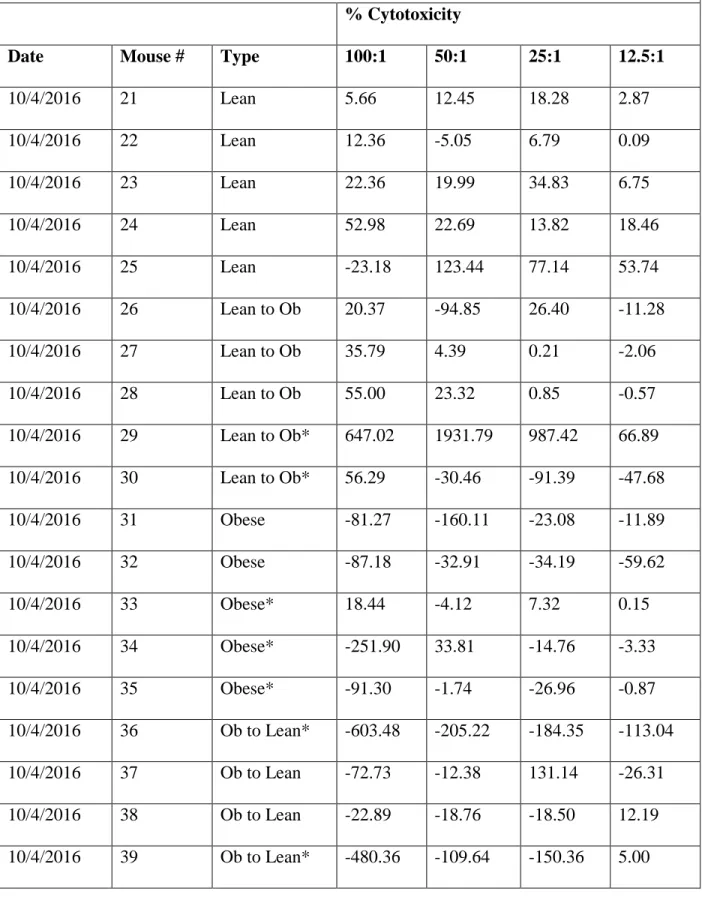
Table 1. Mouse data from trial 1 with mouse IDs, weight type, and percent cytotoxicity at
each of the four effector-to-target cell ratios obtained on October 4, 2016
% Cytotoxicity
Date Mouse # Type 100:1 50:1 25:1 12.5:1
10/4/2016 21 Lean 5.66 12.45 18.28 2.87
10/4/2016 22 Lean 12.36 -5.05 6.79 0.09
10/4/2016 23 Lean 22.36 19.99 34.83 6.75
10/4/2016 24 Lean 52.98 22.69 13.82 18.46
10/4/2016 25 Lean -23.18 123.44 77.14 53.74
10/4/2016 26 Lean to Ob 20.37 -94.85 26.40 -11.28
10/4/2016 27 Lean to Ob 35.79 4.39 0.21 -2.06
10/4/2016 28 Lean to Ob 55.00 23.32 0.85 -0.57
10/4/2016 29 Lean to Ob* 647.02 1931.79 987.42 66.89
10/4/2016 30 Lean to Ob* 56.29 -30.46 -91.39 -47.68
10/4/2016 31 Obese -81.27 -160.11 -23.08 -11.89
10/4/2016 32 Obese -87.18 -32.91 -34.19 -59.62
10/4/2016 33 Obese* 18.44 -4.12 7.32 0.15
10/4/2016 34 Obese* -251.90 33.81 -14.76 -3.33
10/4/2016 35 Obese* -91.30 -1.74 -26.96 -0.87
10/4/2016 36 Ob to Lean* -603.48 -205.22 -184.35 -113.04
10/4/2016 37 Ob to Lean -72.73 -12.38 131.14 -26.31
10/4/2016 38 Ob to Lean -22.89 -18.76 -18.50 12.19
10/4/2016 40 Ob to Lean* -191.79 -143.21 -132.14 -122.50 * — indicates the data values that are outliers and to be excluded from the test for significance described below.
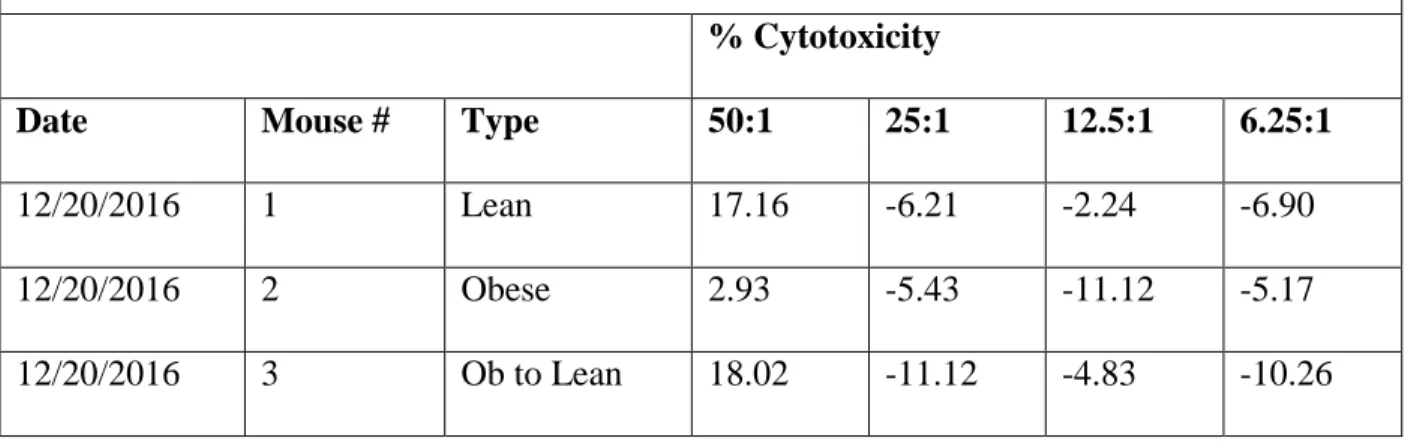
Table 2. Mouse data from trial 2 with mouse IDs, weight type, and percent cytotoxicity at
each of the four effector-to-target cell ratios obtained on December 20, 2016
% Cytotoxicity
Date Mouse # Type 50:1 25:1 12.5:1 6.25:1
12/20/2016 1 Lean 17.16 -6.21 -2.24 -6.90
12/20/2016 2 Obese 2.93 -5.43 -11.12 -5.17
12/20/2016 3 Ob to Lean 18.02 -11.12 -4.83 -10.26
The data from trial 1 and trial 2 were combined and outliers were removed using two methods. I first removed the outliers using the IQR rule. I also removed visual outliers that were unreliable by looking at the absorbance value readings that showed data that did not make practical sense. For example, some results from the plate readings showed maximum release of LDH in the YAC-1 cells lower than spontaneous release of LDH in the same concentration of YAC-1 cells. After removing these values, Table 3 shows the fifteen data points that remained and would be used in the statistical test.
Table 3. Data from trial 1 and 2 combined with outliers removed. This was the final data
set used in the tests for significance.
% Cytotoxicity
10/4/2016 21 Lean 5.66 12.45 18.28 2.87
10/4/2016 22 Lean 12.36 -5.05 6.79 0.09
10/4/2016 23 Lean 22.36 19.99 34.83 6.75
10/4/2016 24 Lean 52.98 22.69 13.82 18.46
10/4/2016 25 Lean -23.18 123.44 77.14 53.74
10/4/2016 26 Lean to Ob 20.37 -94.85 26.40 -11.28
10/4/2016 27 Lean to Ob 35.79 4.39 0.21 -2.06
10/4/2016 28 Lean to Ob 55.00 23.32 0.85 -0.57
10/4/2016 31 Obese -81.27 -160.11 -23.08 -11.89
10/4/2016 32 Obese -87.18 -32.91 -34.19 -59.62
10/4/2016 37 Ob to Lean -72.73 -12.38 131.14 -26.31
10/4/2016 38 Ob to Lean -22.89 -18.76 -18.50 12.19
12/20/2016 1 Lean - 17.16 -6.21 -2.24
12/20/2016 2 Obese - 2.93 -5.43 -11.12
12/20/2016 3 Ob to Lean - 18.02 -11.12 -4.83
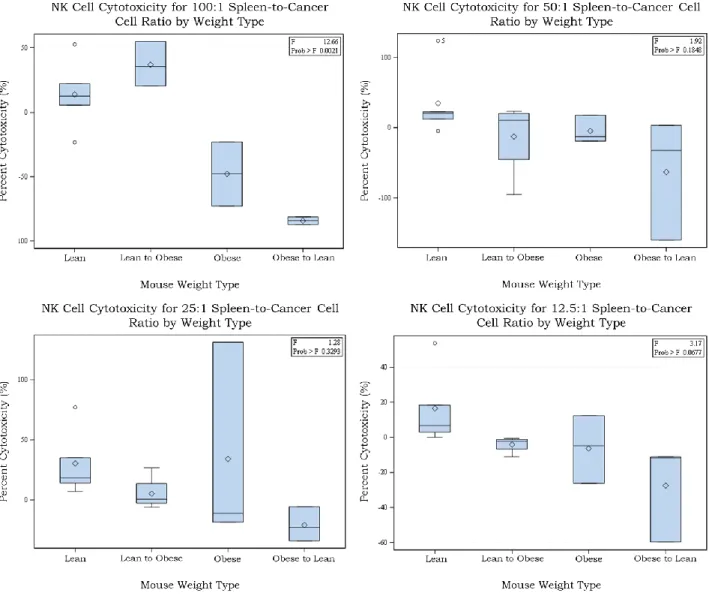
Figure 2. NK cell cytotoxicity for all 4 effector-to-target cell ratios and separated by weight
type.
Figure 3. NK cell cytotoxicity for the 100:1 spleen-to-cancer cell ratio. The p-value is less
than 0.05 indicating statistical significance.
cytotoxicity of the NK cells versus the two combined original mouse weight types for all the effector-to-target cell ratios.
Figure 4. NK cell cytotoxicity for all 4 spleen-to-cancer cell ratios and separated by weight
type. The weight types are combined into two groups with “Lean Original” and “Obese
Similarly, with a p-value of 0.05 the only set of data that was significant was the 100:1 effector-to-target cell ratio. Figure 5 shows the 100:1 effector-effector-to-target cell ratio by itself because it was the only statistically significant data set.
Figure 5. NK cell cytotoxicity for the 100:1 spleen-to-cancer cell ratio with the combined
weight types. The p-value is less than 0.05 indicating statistical significance.
This figure shows that there is a significant difference in the cytotoxicity of the mice based on their original weight status at the start of the experiment. Mice that were originally lean had more cytotoxic NK cell activity compared to the mice that were originally obese regardless of the weight status change they underwent.
Previous studies have established that the immune response to influenza vaccination is compromised in obese individuals. These studies also showed that NK cell cytotoxicity and enumeration were also decreased in the obese mice compared to lean mice (2). In this
experiment, we wanted to expand on the study and attempt to establish an association similar to that described if there were weight changes in the mice. On top of the two groups of obese and lean mice, two additional groups were added to the study population to determine the effect of weight change on the immune response, specifically in NK cells. Four groups of mice were tested: always lean, lean-to-obese, obese-to-lean, and always obese. Because the original study had already established that always obese mice had decreased NK cell cytotoxicity and
enumeration compared to the lean mice, I hypothesized that the obese-to-lean and the lean-to-obese groups would have greater NK cell cytotoxicity than the always lean-to-obese mice, but less than the always lean mice. Similarly, I also hypothesized that the obese-to-lean mice would have greater NK cell cytotoxicity than the lean-to-obese mice. I hypothesized this because I assumed that the metabolic changes that follow obesity would have a negative impact on NK cell
production and effectiveness and therefore make the mice that became obese have a lower NK cell cytotoxicity than the mice that became lean.
particular set of data, we can say the difference between the four groups NK cell percent cytotoxicity was statistically significant. This is different from my hypothesis because it shows that mice that were lean-to-obese had better percent cytotoxicity than the obese-to-lean whereas I had predicted that the opposite.
To further investigate this claim, I combined both the lean and lean-to-obese mice in one group as “Lean Original” meaning that these were mice that had lean weight statuses at the start of the study period. I combined the obese and obese-to-lean groups in a second group called “Obese Original” for similar reasons. I ran the ANOVA test again and the results were seen in Figure 4. Figure 4 showed a similar trend to that in Figure 2, with the lean mice groups have higher percent cytotoxicity than the obese groups. At a p-value of 0.05, the only data set again that was statistically significant was the 100:1 spleen-to-cancer cell ratios. It is worth noting that the 12.5:1 data set had a p-value of 0.052 which was close to the acceptable p-value, but not statistically significant. Analyzing the 100:1 cell ratio graph in Figure 5 in more depth, we see that the mice that were originally lean at the start of the study had significantly higher NK cell percent cytotoxicity than the mice that were originally obese at the start of the study period. This analysis shows that mice starting out lean had a more effective NK cells than the mice that started out obese regardless of the weight status change that they underwent. There could be a few possible reasons as to why the results were as shown.
virus-infected and cancer cells. One study found that KIR, an Ig-like receptor on NK cells which is one of the many receptors involved in a recognition mechanism to target cells is controlled by DNA methylation of the surrounding CpG islands of the KIR gene. Increased methylation resulted in decreased gene expression of this crucial surface receptor needed for NK cell functioning (14). On a similar note, a separate study looked at how obesity was associated with increased methylation of the LY86 gene. The LY86 is a lymphocyte antigen gene important for cell surface receptors of many immune cells showing the potential for DNA methylation to be a contributor to the altered NK cell response we saw in the study (15).
Another possible explanation for the results seen in this study may be due to NK cell turnover rate. A study looked at the dynamics and kinetics of splenic NK cell populations in different conditions. They concluded that “most splenic NK cells in adults are not dividing rapidly” and of the NK cell proliferation they do see, it is a small subset population of the entire NK cell population and the divisions are infrequent (16). Further inquiry into specific NK cell populations would be needed to be done before assumptions can be made about NK cell cytotoxicity. Determining whether NK cells would even proliferate and be effected by the metabolic changes occurring during the weight change would be a key focal point. However, as of now it seems that the NK cell populations generally remained constant throughout the weight change which is why the results showed that the original weight status of the mice was indicative of the NK cell cytotoxicity.
Future Applications and Possible Limitations
problematic. By exploring the topic of weight change on influenza-infected mice, we are attempting to determine if healthy lifestyle changes in order to induce weight change would be helpful in returning immune function. From a public health and preventative medicine
standpoint, this is an important topic because it would allow for concrete evidence in inducing these weight changes to restore immune functionality, specifically NK cells. From the data gathered thus far, it does not seem like weight change has an effect on NK cell function, but further research is required to extensively research the intricacies of NK cells and their function in our immune systems.
There are some limitations to this study that should be considered when revising and repeating the study design. One would be to increase sample size. Because of the schedule and timing of mice being euthanized, I was only able to utilize about 23 samples for my study and then those only had 15 samples after removing outliers. Additionally, the NK cell population for this study was obtained from spleen tissue harvested from the mice. In a follow-up study, I would use NK cell populations from multiple sources such as lung and blood. There is literature which indicates that lung tissue in influenza-infected mice actually has separate NK cell
have shown the NK cells have two types of cytolytic activity, spontaneous and induced.
Spontaneous is the baseline cytoxic ability of the NK cell population whereas the induced is the additional NK cell cytotoxic ability that comes from inducers such as interferon gamma which activates NK cell activity. Developing a study with and without these inducers may allow us to study the full potential of NK cell cytotoxicity. Finally, I would increase the study duration to allow for the NK cell populations to proliferate under the new metabolic conditions of the mice. The study cited earlier discussed splenic NK cell turnover rate and infrequent subpopulation divisions (16). Allowing more time for the NK cell populations to adjust to the new metabolic status may give us insight in a follow-up study into how the NK cell population adjusts over time.
Citations
1. Ogden CL, Carroll MD, Fryar CD, Flegal KM. (2015). Prevalence of obesity among adults and youth: United States, 2011–2014. NCHS data brief, no 219. Hyattsville, MD: National Center for Health Statistics.
2. Smith, A. G., Sheridan, P. A., Harp, J. B., & Beck, M. A. (2007). Diet-induced obese mice have increased mortality and altered immune responses when infected with influenza virus. The Journal of nutrition, 137(5), 1236-1243.
3. Marti, A., Marcos, A., & Martinez, J. A. (2001). Obesity and immune function relationships. Obesity reviews, 2(2), 131-140.
5. Mandal, A., & Viswanathan, C. (2015). Natural killer cells: In health and disease. Hematology/oncology and stem cell therapy, 8(2), 47-55.
6. Long, E. O., Sik Kim, H., Liu, D., Peterson, M. E., & Rajagopalan, S. (2013). Controlling natural killer cell responses: integration of signals for activation and inhibition. Annual review of immunology, 31, 227-258.
7. Lodoen, M. B., & Lanier, L. L. (2005). Viral modulation of NK cell immunity. Nature Reviews Microbiology, 3(1), 59-69.
8. Schultz-Cherry, S. (2014). Role of NK cells in influenza infection. In Influenza Pathogenesis and Control-Volume II (pp. 109-120). Springer International Publishing. 9. Iannello, A., Debbeche, O., Samarani, S., & Ahmad, A. (2008). Antiviral NK cell responses in HIV infection: I. NK cell receptor genes as determinants of HIV resistance and progression to AIDS. Journal of leukocyte biology, 84(1), 1-26.
10. Influenza – Seasonal. (2017). World Health Organization. Retrieved 17 April 2017, from http://www.who.int/mediacentre/factsheets/fs211/en/
11. Sheridan, P. A., Paich, H. A., Handy, J., Karlsson, E. A., Hudgens, M. G., Sammon, A. B & Beck, M. A. (2012). Obesity is associated with impaired immune response to influenza
vaccination in humans. International journal of obesity, 36(8), 1072-1077.
13. Promega. (2016). CytoTox 96® Non-Radioactive Cytotoxicity Assay. Promega Protocols, G1780, 1-20.
14. Santourlidis, S., Trompeter, H. I., Weinhold, S., Eisermann, B., Meyer, K. L., Wernet, P., & Uhrberg, M. (2002). Crucial role of DNA methylation in determination of clonally distributed killer cell Ig-like receptor expression patterns in NK cells. The Journal of Immunology, 169(8), 4253-4261.
15. Su, S., Zhu, H., Xu, X., Wang, X., Dong, Y., Kapuku, G., ... & Wang, X. (2014). DNA methylation of the LY86 gene is associated with obesity, insulin resistance, and inflammation. Twin Research and Human Genetics, 17(03), 183-191.
16. Jamieson, A. M., Isnard, P., Dorfman, J. R., Coles, M. C., & Raulet, D. H. (2004). Turnover and proliferation of NK cells in steady state and lymphopenic conditions. The Journal of Immunology, 172(2), 864-870.