Heme oxygenase-1 in the forefront of a multi-molecular
network that governs cell
–
cell contacts and
filopodia-induced zippering in prostate cancer
Alejandra V Paez
1, Carla Pallavicini
2, Federico Schuster
1, Maria Pia Valacco
1, Jimena Giudice
3, Emiliano G Ortiz
1, Nicolás Anselmino
1,
Estefania Labanca
4, Maria Binaghi
1, Marcelo Salierno
1, Marcelo A Martí
1, Javier H Cotignola
1, Anna Woloszynska-Read
5,
Luciana Bruno
2, Valeria Levi
1, Nora Navone
4, Elba S Vazquez
1and Geraldine Gueron*
,1Prostate cancer (PCa) cells display abnormal expression of cytoskeletal proteins resulting in an augmented capacity to resist
chemotherapy and colonize distant organs. We have previously shown that heme oxygenase 1 (HO-1) is implicated in cell
morphology regulation in PCa. Here, through a multi 'omics' approach we define the HO-1 interactome in PCa, identifying HO-1
molecular partners associated with the integrity of the cellular cytoskeleton. The bioinformatics screening for these
cytoskeletal-related partners reveal that they are highly misregulated in prostate adenocarcinoma compared with normal prostate tissue. Under
HO-1 induction, PCa cells present reduced frequency in migration events, trajectory and cell velocity and, a significant higher
proportion of filopodia-like protrusions favoring zippering among neighboring cells. Moreover forced expression of HO-1 was also
capable of altering cell protrusions in transwell co-culture systems of PCa cells with MC3T3 cells (pre-osteoblastic cell line).
Accordingly, these effects were reversed under siHO. Transcriptomics profiling evidenced significant modulation of key markers
related to cell adhesion and cell
–
cell communication under HO-1 induction. The integration from our omics-based research
provides a four molecular pathway foundation (ANXA2/HMGA1/POU3F1; NFRSF13/GSN; TMOD3/RAI14/VWF; and PLAT/PLAU)
behind HO-1 regulation of tumor cytoskeletal cell compartments. The complementary proteomics and transcriptomics approaches
presented here promise to move us closer to unravel the molecular framework underpinning HO-1 involvement in the modulation
of cytoskeleton pathways, pushing toward a less aggressive phenotype in PCa.
Cell Death and Disease
(2016)
7,
e2570; doi:10.1038/cddis.2016.420; published online 29 December 2016
Prostate cancer (PCa) is the most frequently diagnosed
cancer in men aside from skin cancer.
1Although PCa has
been well defined in regards to the mutational landscape,
analysis at the proteome level of these genetic alterations is
still understudied. Most of the functional information of the
cancer-associated genes relies in the proteome, an
excep-tionally complex biological system involving several proteins
that function through dynamic protein
–
protein interactions and
post-translational modifications.
2Tumor development and progression are partly
conse-quence of defects in mechanisms controlling cytoskeletal
remodeling.
3Actin re-arrangement and attachment to focal
adhesions at the leading edge of a migrating cell, generate the
driving force necessary for movement.
3The loss of cell
–
cell
adhesion enables cancer cells to dissociate from the primary
tumor mass and changes in cell
–
matrix interaction allows the
cells to invade the surrounding stroma.
4Higher grade prostate
carcinoma has been associated with the loss of cell adhesion
molecules at adherens junctions.
5Cell protrusive forces are
partly regulated by the GTP-binding protein Rac.
6The delicate
equilibrium between the cell pushing and pulling forces drive
leading edge dynamics and cell migration. Interdigitating
filopodia are vital for the proper alignment and establishment
of the initial cell
–
cell adhesions
7This event is known as
adhesion 'zippering'.
8Heme oxygenase 1 (HO-1) is the rate-limiting enzyme in
heme degradation.
9,10HO-1 is as a stress response protein
and a critical mediator of cellular homeostasis.
11Although the
role of HO-1 in cancer is controversial,
12we have shown that
its pharmacologic or genetic upregulation is associated with a
less aggressive phenotype in PCa.
13HO-1 inhibits cell
proliferation, migration and invasion,
14it impairs tumor growth
and angiogenesis
in vivo
and downregulates the expression
of target genes associated with inflammation.
14,15HO-1 is
also implicated in the modulation of cellular adhesion in
PCa, upregulating E-cadherin and
β
-catenin expression, and
relocating them to the cell membrane,
13favoring a more
epithelial phenotype. However, it is yet unclear which are the
HO-1
interactors
and
how
it
regulates
cytoskeleton
organization.
In this work, we undertook a proteomics study to build the
HO-1 interactome in PCa. We showed that HO-1 binds to key
factors associated with the dynamics of the actin cytoskeleton
and induces the remodeling of the actin filament architecture
1
Department of Biological Chemistry, School of Sciences, FCEN, University of Buenos Aires, IQUIBICEN-CONICET, Buenos Aires, Argentina;2Department of Physics, FCEN, University of Buenos Aires, IFIBA-CONICET, Buenos Aires, Argentina;3Department of Cell Biology and Physiology, School of Medicine, University of North Carolina at Chapel Hill, Chapel Hill, NC, USA;4Department of Genitourinary Medical Oncology, The University of Texas, MD Anderson Cancer Center, Houston, TX, USA and 5
Pharmacology and Therapeutics Department, Roswell Park Cancer Institute, Buffalo, NY, USA
*Corresponding author: G Gueron, Department of Biological Chemistry, School of Sciences, FCEN, University of Buenos Aires, IQUIBICEN-CONICET, Intendente Guiraldes 2160-Ciudad Universitaria Pab 2, 2ºpiso, CM1, Buenos Aires CP1428, Argentina. Tel/Fax: +(5411) 4788-5755; E-mail: [email protected]
at filopodia. Further we obtained RNA-sequencing (RNA-Seq)
profiles and determined a significant alteration of cytoskeletal
genes by HO-1 induction, establishing molecular pathways by
which forced expression of HO-1 leads to a more adhesive and
less invasive phenotype, further supporting the antitumoral
function in PCa.
Results
Proteomics profiling of HO-1-interacting proteins in PCa
cells.
We have previously demonstrated HO-1 implications
on the maintenance of the epithelial cell morphology and
architecture.
13We hypothesized that HO-1 could be exerting
a regulatory role through its interaction with
cytoskeleton-associated proteins. For this purpose, we conducted an
in-depth mass spectrometry-based proteomics study. We
constructed a recombinant FLAGHO-1 protein. PC3 cells
were transiently transfected with FLAGHO-1 or the respective
controls and treated with H2O2. Immunoprecipitated protein
complexes were subjected to LC-ESI MS/MS (Figure 1a).
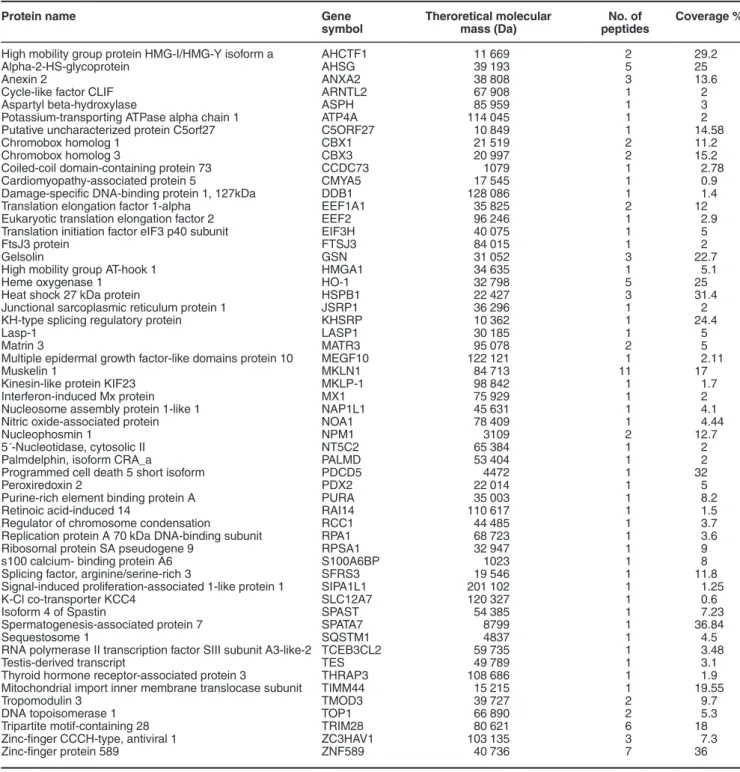
This approach rendered a list of 56 proteins (Table 1). We
performed a protein interaction network, showing
intercon-nectivity either by reported gene colocalization, genetic
interactions, predicted functional relationship, shared protein
domains or physical interaction (Figure 1b, right panel). In all,
53% of the HO-1 interactome showed physical
interconnec-tivity. The gene ontology (GO) analysis revealed an
enrich-ment of proteins associated with four main functions: DNA
and chromatin, RNA metabolism (post-transcription,
includ-ing splicinclud-ing), actin and cytoskeleton proteins and other
proteins (Figure 1b, left panel).
Crystallographic analysis of HO-1-interacting proteins.
To assess protein domain interaction of HO-1 interactors, we
obtained their reference amino-acid sequences. The
crystal-lographies with the highest coverage and score were
selected and introduced into the protein domain database
(PFAM) (Supplementary Figure S1). Using the inferred
domain
–
domain interactions, we restricted the analysis to
those proteins presenting domain interconnectivity, obtaining
a network with 28 nodes and 29 edges (Figure 1d). We could
not predict domain interaction between HO-1 and its
inter-actome because HO-1 is a small globular protein with only
one reported domain. However, we successfully predicted
domain interactions among several HO-1-interacting
pro-teins: LASP1 and TES through the LIM domain, TES and
ARNTL2 through LIM and HLH domains and TRIM28 and
SRP20 through PHD and RMM_1, (Figure 1d). The
crystal-lographic analysis of protein domains further supports
physical interconnectivity of HO-1 interactor proteins.
Analysis of multiple microarray data sets for cytoskeletal
HO-1-interacting proteins.
Given that HO-1 modulates
the cell adhesive properties and morphology,
13we focused
on HO-1-interacting proteins associated with the cytoskeleton
organization. To address their relevance in PCa, we searched
the
public
cancer
microarray
database,
Oncomine
(http://www.oncomine.org) (Figure 2a). The expression profile
for these genes showed significant dysregulation for most of
the cytoskeletal interactors of HO-1, in particular,
upregula-tion for TMOD3, TOP1, CBX3, RCC1, NPM1 and
down-regulation for ANXA2, HSPB1, STAT3 and TES (fold change
⩾
1.5,
P
-value
⩽
0.05; Figure 2b). The meta-analysis
combin-ing data from the independent data sets showed that the
above-mentioned dysregulated cytoskeletal genes for
pros-tate adenocarcinoma
versus
normal prostate gland lie within
the 25% of the most consistently high- or low-expressed
genes across this comparison. Of note, TES and MKLN lie
within the 1
–
9% of the lowest expressed genes in PCa
versus
normal tissue (Figure 2b).
We also used the
cBioPortal for Cancer Genomics
platform (
www.cbioportal.org
) to search for the most common
genetic alterations for these cytoskeletal proteins in PCa
(Figure 2c, left panel). Results show presence of
muta-tions, amplifications and deletions for the cluster of
cyto-skeletal genes selected. Of note, amplification was the
most frequent alteration across the data sets (Figure 2c,
right panel).
PCa cell 2-D migratory patterns under forced expression
of HO-1.
To examine whether the association of HO-1 with
proteins implicated in the integrity of the actin cytoskeleton
had an impact on PCa cellular migratory trajectories, we
evaluated quantitatively the motion of cells in a
wound-healing assay. Cells were treated with hemin (specific inducer
of HO-1, 80
μ
M, 24 h). A linear scratch was done along
the culture plate and cells were imaged using phase contrast
Figure 1 Construction of the HO-1 interactome in PCa cells. (a) Simplified schematic workflow of the construction of the HO-1 interactome in PC3 cells. FLAGHO-1 immunoprecipitation assays were performed from PC3 cell extracts that had been previously transiently transfected with FLAGHO-1 plasmid or empty FLAG vector and treated with H2O2(200μM, 1 h). For LC-ESI MS/MS analyses, peptides were desalted and concentrated using a C18 resin. Peptides were analyzed by reverse-phase chromatography
microscopy at 1 frame/20 min during 48 h. Single-cell
trajectories (Figure 3a) were analyzed to obtain the mean
squared displacement (MSD)
versus
time plot in each
experimental condition. Figure 3b shows that the MSD
obtained in both conditions increases as a function of time;
however, after 10 h, the MSD obtained in hemin-treated cells
was significantly smaller than in control cells. HO-1 induction
significantly reduces the area explored by PCa cells in the
assayed temporal window compared with control cells.
PCa cellular protrusions under HO-1 induction.
To
analyze whether there were variations in cell
–
cell
interac-tions, we determined the distribution of the distances to the
first neighboring cell under HO-1 modulation (Figure 3c). For
every cell or cell cluster, we calculated the distance to all the
other cells/cell clusters (white line) and to the first neighboring
cell (red line) (Figure 3c). Results show that HO-1 induction in
PC3 cells significantly reduced the distances to the first
neighboring cell (
Po
0.05; Figure 3d).
Table 1List of HO-1-interacting proteins identified by MS/MS analysis
Protein name Gene
symbol
Theroretical molecular mass (Da)
No. of peptides
Coverage %
High mobility group protein HMG-I/HMG-Y isoform a AHCTF1 11 669 2 29.2
Alpha-2-HS-glycoprotein AHSG 39 193 5 25
Anexin 2 ANXA2 38 808 3 13.6
Cycle-like factor CLIF ARNTL2 67 908 1 2
Aspartyl beta-hydroxylase ASPH 85 959 1 3
Potassium-transporting ATPase alpha chain 1 ATP4A 114 045 1 2 Putative uncharacterized protein C5orf27 C5ORF27 10 849 1 14.58
Chromobox homolog 1 CBX1 21 519 2 11.2
Chromobox homolog 3 CBX3 20 997 2 15.2
Coiled-coil domain-containing protein 73 CCDC73 1079 1 2.78
Cardiomyopathy-associated protein 5 CMYA5 17 545 1 0.9
Damage-specific DNA-binding protein 1, 127kDa DDB1 128 086 1 1.4
Translation elongation factor 1-alpha EEF1A1 35 825 2 12
Eukaryotic translation elongation factor 2 EEF2 96 246 1 2.9 Translation initiation factor eIF3 p40 subunit EIF3H 40 075 1 5
FtsJ3 protein FTSJ3 84 015 1 2
Gelsolin GSN 31 052 3 22.7
High mobility group AT-hook 1 HMGA1 34 635 1 5.1
Heme oxygenase 1 HO-1 32 798 5 25
Heat shock 27 kDa protein HSPB1 22 427 3 31.4
Junctional sarcoplasmic reticulum protein 1 JSRP1 36 296 1 2
KH-type splicing regulatory protein KHSRP 10 362 1 24.4
Lasp-1 LASP1 30 185 1 5
Matrin 3 MATR3 95 078 2 5
Multiple epidermal growth factor-like domains protein 10 MEGF10 122 121 1 2.11
Muskelin 1 MKLN1 84 713 11 17
Kinesin-like protein KIF23 MKLP-1 98 842 1 1.7
Interferon-induced Mx protein MX1 75 929 1 2
Nucleosome assembly protein 1-like 1 NAP1L1 45 631 1 4.1
Nitric oxide-associated protein NOA1 78 409 1 4.44
Nucleophosmin 1 NPM1 3109 2 12.7
5´-Nucleotidase, cytosolic II NT5C2 65 384 1 2
Palmdelphin, isoform CRA_a PALMD 53 404 1 2
Programmed cell death 5 short isoform PDCD5 4472 1 32
Peroxiredoxin 2 PDX2 22 014 1 5
Purine-rich element binding protein A PURA 35 003 1 8.2
Retinoic acid-induced 14 RAI14 110 617 1 1.5
Regulator of chromosome condensation RCC1 44 485 1 3.7
Replication protein A 70 kDa DNA-binding subunit RPA1 68 723 1 3.6
Ribosomal protein SA pseudogene 9 RPSA1 32 947 1 9
s100 calcium- binding protein A6 S100A6BP 1023 1 8
Splicing factor, arginine/serine-rich 3 SFRS3 19 546 1 11.8 Signal-induced proliferation-associated 1-like protein 1 SIPA1L1 201 102 1 1.25
K-Cl co-transporter KCC4 SLC12A7 120 327 1 0.6
Isoform 4 of Spastin SPAST 54 385 1 7.23
Spermatogenesis-associated protein 7 SPATA7 8799 1 36.84
Sequestosome 1 SQSTM1 4837 1 4.5
RNA polymerase II transcription factor SIII subunit A3-like-2 TCEB3CL2 59 735 1 3.48
Testis-derived transcript TES 49 789 1 3.1
Thyroid hormone receptor-associated protein 3 THRAP3 108 686 1 1.9 Mitochondrial import inner membrane translocase subunit TIMM44 15 215 1 19.55
Tropomodulin 3 TMOD3 39 727 2 9.7
DNA topoisomerase 1 TOP1 66 890 2 5.3
Tripartite motif-containing 28 TRIM28 80 621 6 18
Zinc-finger CCCH-type, antiviral 1 ZC3HAV1 103 135 3 7.3
We used confocal microscopy to study the changes in the
cytoskeletal organization, in particular the cell adhesion
zippering through the actin stress fibers at the leading edge
level of PCa cells. To quantify contacts among cells, we
selected regions in which the filopodia from two neighboring
cells touched each other, considered as 'contacts', and divided
these regions into segments where the distance between the
cells remained constant (Figures 3e and f). An intensity profile
for each of these areas was analyzed with a custom made
algorithm to count contacts (Figure 3e). A '
contact density'
was
defined for each region as the ratio between the number
of contacts and the length of the profile. Results showed an
increased contact density under HO-1 induction, favoring
adhesion zippering (Figure 3g;
Po
0.05). Filopodia-like
protrusions (cell filopodia density) were also enhanced by
hemin treatment (Figure 3h;
Po
0.05).
Using a specific siRNA for HO-1 (siHO-1), the effects
observed on the augmented filopodia per cell and cell
–
cell
contact, under HO-1 induction, were reversed (Figure 4a, left
panel). Efficiency of HO-1 depletion was confirmed by western
blot (Figure 4a, right panel). Accordingly cell zippering under
HO-1 induction, was also impaired (Figure 4b). Contacts were
further analyzed for the different distances among cells (range
1
–
25
μ
m), displaying no negative correlation between cell
–
cell
contacts and distance between cells for all treatments
(Figure 4c). Moreover, HO-1 silencing also reverted the
augmented filopodia density after hemin exposure (Figure 4d).
Presence of HO-1 at the leading edge protrusions of cells
was also assayed by immunofluorescence. HO-1 induction in
PC3 showed increased expression of this protein in the
cytoplasm and nuclei of cells but did not reveal localization at
cell filopodia (Supplementary Figure S2).
Metastatic cells rely on invadopodia to degrade and invade
ECM.
5To rule out that these increased protrusions were
invadopodia structures, we stained cells for metalloproteinase
9 (MMP9), a metalloproteinase highly implicated in tumor
invasion. No staining for MMP9 was detected at these
protrusions (Supplementary Figure S3).
Microtubule mechanics in PC3 cells treated or not with
hemin was also evaluated by confocal microscopy
(Supple-mentary Figure S4). The persistence length (pL) of
micro-tubules was measured in PC3 cells. A Fourier analysis was
performed and the ensemble variance of Fourier amplitudes
was calculated. Both, cells treated or not with hemin, exhibited
a similar thermal-like q-dependence: (1/Lp*)*(1/q)
2with no
variation of Lp (Supplementary Figure S4).
Considering that PC3 cells present an osteolytic bone
metastatic behavior, we extended our observations to C4-2B
cells, another PCa cell line with osteoblastic metastatic
behavior. Imaging of C4-2B cells also revealed an increased
network of filopodia from neighboring cells and an augmented
number of protrusions per cell by forced expression of HO-1
(Supplementary Figure S5). HO-1 depletion could revert the
increased contact density under hemin exposure
(Supple-mentary Figure S5), however, no significant difference was
observed in the filopodia density, probably due to a reduced
efficiency of the siHO compared with the effect observed in
PC3 cells. These results show that HO-1 induction in PCa cells
favors a more adhesive phenotype regardless the bone
metastatic behavior.
Analysis of PCa cellular protrusions in the presence of
CM from co-culture systems (PC3 and MC3T3).
As bone
is the most common and frequent site of PCa progression
and the bioinformatics analysis has shown important
dys-regulation of cytoskeletal proteins in the metastatic stage
of PCa, we next assessed the effect of conditioned media
(CM) obtained from transwell co-culture systems (PC3 and
MC3T3), on tumoral cell protrusions. MC3T3 is an osteoblast
precursor cell line derived from mouse calvaria.
16PC3 cells pre-treated or not with hemin were co-cultured
with or without MC3T3 cells. CM from the different
experi-mental protocols was then added to PC3 cells (Figure 5a). Cell
contact density and number of protrusions were evaluated by
confocal microscopy (Figure 5b). Regarding contacts between
cells, no correlation was observed for contact density and cell
–
cell distance for all conditions (Figure 5c). CM from co-culture
systems reduced the number of contacts among PCa cells
(Figure 5d; PC3+CM2
versus
PC3+CM1) and hemin
pre-treatment prevented this fall (Figure 5d; PC3+CM4
versus
PC3+CM2). Intriguingly, the CM from co-culture systems
impacted negatively on the membrane filopodia density of
PC3 cells (Figure 5d; PC3+CM2
versus
PC3+CM1). These
effects were prevented by hemin pre-treatment (Figure 5d;
PC3+CM4
versus
PC3+CM2). These findings suggest that
induced HO-1 expression in PC3 cells alters the soluble
factors released to the CM in the co-culture systems, in turn
affecting cell filopodia and zippering. A more adhesive
phenotype of tumoral cells potentially prevent them from
extravasation and invasion of other homing organs.
Integrated analysis of HO-1 transcriptomic and
proteo-mics data in PCa.
We next integrated the transcriptomic
overlapping data sets with the HO-1 interactome for a
combined holistic view of HO-1 molecular mechanisms
implicated in the cytoskeletal remodeling in PCa. Figure 7a
shows the interaction network between the cytoskeletal GO
categories of the proteome with the overlapping twofold
upregulated gene categories (red) and twofold
downregu-lated gene categories (blue) of the trascriptome.
Filtering by physical interconnectivity among these data
sets, four main molecular pathways were depicted: ANXA2
(Annexin 2) connected to PLAU (urokinase-type plasminogen
activator precursor) signaling axis, HMGA1 (high mobility
group AT-Hook) connecting to POU3F1, (POU class 3
homeobox 1) GSN (Gelsolin) with TNFRSF13C (tumor
necrosis factor receptor superfamily member 13C) and
TMOD3 (tropomodulin 3) and RAI1 (retinoic acid induced 1)
with VWF (Von Willebrand factor) (Figure 7b, left panel). These
pathways are intrinsically related to the cytoskeleton
remodel-ing, MMP secretion, uPA pathways, Rho GTPases pathway
and filopodia and lamillopodia regulation (Figure 7b, right
panel). This network creates a molecular framework by which
HO-1 operates at the molecular level governing cell protrusive
forces, migration, invasion and cell adhesiveness.
Interestingly, uPA/uPAR, through the activation of the
plasminogen system, degrade ECM, and consequently drive
tumor cell membrane protrusion and motility.
17The RNAseq
profiling for both PCa cells overexpressing HO-1
pharmacolo-gically or genetically showed a direct regulation of the critical
factors in the uPA/uPAR cascade, such as the downregulation of
the axis activators: uPA/uPAR (PLAU/PLAUR) and tPA (PLAT),
and the upregulation of the axis inhibitors: CPB2 (thrombin
activator of fibrinolysis inhibitor), SERPINF2 (alpha 2
anti-plasmin, and F12 (factor XIIA). Our data delineate a molecular
axis by which HO-1 potentially shuts down the acquisition of an
invasive tumor cell phenotype, crucial for cancer metastasis.
Discussion
Different sets of genes, proteins and metabolites govern
progression from a precursor lesion, to the localized disease
and finally to the metastatic stage. Although several studies
have profiled PCa tissues at the transcriptome level, less work
has been done at the protein level that serve as the functional
effectors of cancer progression.
Several studies have shown the anti-inflammatory effects of
HO-1 on diseases
18–20although the underlying mechanisms
are still to be deciphered. Its role in cancer is still
controversial.
12,21–25In PCa, HO-1 impairs cell proliferation,
migration invasion, and angiogenesis
in vitro
and
in vivo
.
14The confirmation of its association with the augmented
adhesive capabilities of cells and the induction and relocation
of E-cadherin and
β
-catenin to the cell membrane,
13led us to
hypothesize its potential implications in cell
–
cell adhesion
zippering and in the regulation of the actin dynamics at the
leading edge of cells.
For this purpose, we built for the first time the HO-1
interactome in PCa cells, showcasing 56 molecular partners,
including cytoskeletal proteins with roles in cell structure,
physiological processes, cell signaling and regulation of the
actin stress fiber dynamics. Pharmacological HO-1 induction
altered migratory patterns and PCa cell trajectories toward a
less motile phenotype.
Cell
–
cell adhesion is essential for the development,
differentiation and maintenance of tissues. Epithelial cells
require cell
–
cell adhesion zippering to promote barrier
function.
8This barrier is critical in the maintenance of cellular
homeostasis. Its loss provides a considerable advantage for
carcinoma progression, as disruption of cell
–
cell interactions
and detachment from the ECM are required for proliferation,
aberrant signaling, epithelial-to-mesenchymal transition,
inva-sion and metastasis.
7These events are facilitated by the actin
cytoskeleton and tubulin at microtubules.
26Actin is the key
component of several cellular structures, including filopodia,
lamellipodia and stress fibers. Actin bundling contributes to
epithelial cell polarity by preserving cell
–
cell junctions and
microvilli.
26In the metastatic disorder, actin and the
cytoske-letal proteins serve as mechanosensors between the cell and
the microenvironment.
26There is no general rule whether
actin bundling promotes or inhibits cancer metastasis.
26Mechanical stiffness has long been positively associated with
invasion and metastasis.
27However, Swaminathan
et al.
28reported that cancer cells with the highest migratory and
invasive potential are significantly less stiff than cells with the
lowest migratory and invasive potential. It is clear that
transformed cells display corrupt actin bundling, turning the
cytoskeletal compartment into a key target to understand
tumor progression and develop appropriate therapies.
By confocal microscopy, we quantified and compared actin
filaments at the leading edge level in PCa cells. HO-1 induced
the remodeling of the actin filament architecture at filopodia,
yielding a more adhesive and less invasive phenotype. The
fact that HO-1 silencing could revert the augmented contact
density observed under HO-1 forced expression, showcases
a direct effect on cellular actin-based protrusions. However,
HO-1 displays negative staining at cell filopodia, pointing to a
regulatory role of this protein on the actin filaments, rather than
a direct interaction between these proteins.
Figure 2 Meta-analysis of multiple microarray data sets for cytoskeletal HO-1-interacting proteins. (a) Expression microarray studies selected from the Oncomine platform (http://www. oncomine. org) comparing prostate adenocarcinomaversusnormal prostate. (b) Summary table showing the gene name, median gene rank and corresponding
Men with PCa display characteristically osteoblastic bone
metastases, which are the main cause of morbidity and
mortality of the disease.
29A previous report has shown HO-1
we used co-culture systems (PC3 and MC3T3). PCa cells
exposed to CM from these co-culture systems, displayed
reduced membrane filopodia density and contact among cells,
effects reverted by hemin pre-treatment. Retraction of cell
protrusions could be a sign of rounding up of cells and may be
one of the characteristic features of cell detachment. Our
results suggest that HO-1 prevents PCa cells from
extravasa-tion and invasion to other homing organs.
To point out the significance of the cytoskeletal
HO-1-interacting proteins in prostate carcinogenesis, we searched
the public cancer microarray database Oncomine and
cBioportal.
Essential
transcriptional
features
for
lethal
castration-resistant PCa were discovered using
meta-analysis of transcriptomic data.
31,32Interestingly, TES and
MKLN lie within the 1
–
9% of the lowest expressed genes
across this comparison. TES, a scaffold protein that
partici-pates in the reorganization of the actin cytoskeleton,
33is
known for being a tumor suppressor in PCa.
34MKLN1, a
nucleocytoplasmic mediator of cellular morphology and
adhesiveness,
35exhibits similar sub-cellular dynamics to
HO-1, relocating from the cell membrane toward the cell
nuclei under hemin treatment.
13Multi 'omics' technologies reveal new aspects of the
mechanistic strategy that HO-1 uses to alter protrusive forces
and adhesiveness of tumor cells, which may not otherwise be
deduced from a single-omics approach. The RNA profiling
evidenced significant alterations of key markers related to cell
adhesion and cell
–
cell communication under HO-1 induction.
Strikingly, when integrating the transcriptome under HO-1
modulation with the HO-1 interactome, a framework of four
main molecular pathways arose as the foundation for the
regulation of the tumor cell protrusive forces: ANXA2/HMGA1/
POU3F1; NFRSF13/GSN; TMOD3/RAI14/VWF; PLAT/PLAU.
We provide a schematic representation of the different
cytoskeletal-associated targets modulated by HO-1
over-expression, which is supported by the results presented here
and our previous data.
13,14Of note, downregulation of uPA/
uPAR directly impacts on Rho GTPases pathways through the
alpha V-Beta 3 integrin receptor, which in turn affect filopodia
formation. HO-1 binds Gelsolin, STAT3 and HSPB1,
poten-tially supporting its implication in filopodia regulation and gives
ground to HO-1 involvement at the molecular level in the
modulation of the cytoskeleton pathways.
Materials and Methods
Cell culture, treatments, reagents and antibodies. PC3 cells were obtained from the American Type Culture Collection (Manassas, VA, USA) and were routinely cultured in RPMI 1640 (Invitrogen, Grand Island, NY, USA) supplemented with 10% fetal bovine serum (FBS). PC3 cells were transiently transfected with HO-1FLAG plasmid or FLAG empty vector.
Hemin was obtained from Sigma-Aldrich (Glasgow, UK). For treatments, cells were incubated 24 h in RPMI media containing 10% FBS and then were exposed to hemin (80μM, 24 h).
For H2O2treatment, cells were exposed to H2O2(200μM, 0.5 h).
Polyclonal and monoclonal anti-HO-1 antibodies were from Stressgen Biotechnol-ogies Corp. (San Diego, CA, USA). Anti-β-actin antibody was purchased from Sigma-Aldrich (UK). The rhodamine–phalloidin was purchased from Life Technologies (Thermo Fisher Scientific Inc., Eugene, OR, USA). Anti-mouse and anti-rabbit secondary antibodies conjugated with HRP were from Amersham Ltd (Freiberg, Germany). Secondary antibodies conjugated with Alexa Fluor 488 or Alexa Fluor 555 were from Molecular Probes, Invitrogen (Grand Island, NY, USA).
p3xFLAG-CMV-10-HO-1 cloning. p3xFLAG-CMV-10-HO-1 vector was generated by cloning the cDNA sequence encoding the human HO-1 (HMOX1) into the restriction sitesEcoRI andBamHI of the mammalian expression vector p3xFLAG-CMV-10 (Sigma-Aldrich, UK). This strategy results in the fusion of the Flag tag peptide at the C-terminus of the HMOX1. The sequences of the primers used were as follow: forward – 5′-GCAGAATTCAGAGCGTCCGCAACCC-3′; reverse–5′- GCCGGATCCGCATTCACATGGCATAAAGC-3′.
FLAG immunoprecipitation strategy. PC3 cells were transfected either with FLAGHO-1 plasmid or the empty vector as a control. Forty-eight hours after transfection, proteins were extracted using a buffer with a low NaCl concentration (20 mM Tris, 150 mM NaCl, 5 mM MgCl2, 0.5% NP40, pH 7,5) not to disrupt the
protein–protein interactions. Protein extracts were incubated with Flag Magnetic Beads (purchased from Sigma-Aldrich, UK) for 2 h at 4 °C. After removing the proteins that did not interact with the FLAG construction, the proteins complexes formed were incubated with 3XFLAG peptide (100μg/μl) for 2 h at 4 °C. Flag peptide competes with the proteins complexes bound to the magnetic beads and, as a consequence, the FLAGHO-1-interacting proteins remain in the supernatant.
Separation of peptides and mass spectrometry. Recombinant
FLAGHO-1 protein complexes were reduced (200 mM DTT), alkylated (200 mM iodoacetamide) and digested with trypsin in-solution overnight, using an estimated 1 : 30 enzyme to substrate ratio. The peptides were desalted and concentrated in a C18 resin (Zip-Tips, Waters Technologies Corporation, Milford, MA, USA) before analysis by LC-ESI MSMS at the Center for Metabolomics and Mass Spectrometry (The Scripps Research Institute, La Jolla, CA, USA). Peptides were separated by reverse-phase chromatography before mass spectrometry analysis using the following method: nanoelectrospray capillary column tips were made in-house by using a P-100 laser puller (Sutter Instruments, Novato, CA, USA). The columns were packed with Zorbax SB-C18stationary phase (Agilent Technologies, Santa
Clara, CA, USA) purchased in bulk (5-mm particles, with a 15-cm length and a
75-mm inner diameter). The reverse-phase gradient separation was performed by using water and acetonitrile (0.1% formic acid) as the mobile phases. The gradient consisted of 5% acetonitrile for 10 min followed by a gradient to 8% acetonitrile for 5 min, 35% acetonitrile for 113 min, 55% acetonitrile for 12 min, 95% acetonitrile for 15 min and re-equilibrated with 5% acetonitrile for 15 min.
Data-dependent MS/MS data were obtained with an LTQ linear ion trap mass spectrometer using a home-built nanoelectrospray source at 2 kV at the tip. One MS
spectrum was followed by 4 MS/MS scans on the most abundant ions after the application of a dynamic exclusion list. Tandem mass spectra were extracted by use of Xcalibur software (Thermo Scientific, Waltham, MA, USA). All MS/MS samples were analyzed by using Mascot (version 2.1.04; Matrix Science, London, UK) withH. Sapiens
proteins contained in the NCBI protein database, assuming the digestion enzyme trypsin. Mascot was searched with a fragment ion mass tolerance of 0.80 Da and a parent ion tolerance of 2.0 Da; identification was done at the 95% confidence level with a
Figure 4 Filopodia-like protrusions under HO-1 modulation using siHO-1. (a) PC3 cells were treated with hemin (80μM, 24 h) or vehicle (control) and transfected with a specific siRNA for HO-1 (siHO-1) or scrambled siRNA (control). Cells were fixed and stained with rhodamine–phalloidin and imaged by confocal microscopy. One representative image for each group is shown (left panel). Efficiency of siHO-1 was confirmed by western blot.β-Actin was used as loading control (right panel). (b) Cell–cell contact density
calculated false-positive rate ofo1% as determined by using a reversed concatenated protein database. Peptide identifications were accepted if they could be established at a
495.0% probability as specified by thePeptide Prophet algorithm. Protein identifications were accepted if they could be established at a499.0% probability and contained at least two identified peptides as specified by theProtein Prophet algorithm.36Proteins that
contained similar peptides and could not be differentiated based on MS/MS analysis alone were grouped to satisfy the principles of parsimony. To control for nonspecific binding, we compared FLAGHO-1 co-purifying proteins with those immunoprecipitated in
cells transfected with a FLAG empty vector. Only differential FLAGHO-1 binding proteins compared with FLAG-binding proteins were considered further.
Bioinformatics data analysis. In all cases, the networks were performed using Cytoscape 3.2.1 software (Institute of Systems Biology, Seattle, USA). GO analysis was performed using the Database for Annotation, Visualization and Integrated Discovery (DAVID) v6.7. (Leidos Biomedical Research, Inc., Bethesda, MD, USA).
Hemin pre-treatment of PCa cells and Co-culture system. An
in vitrobicompartment culture system was used as a model of bone metastases from PCa as previously described slightly modified. Briefly cells were seeded (100 000 cells) in cell culture inserts (0.4-mm pore; Falcon/Becton Dickinson
PC3 cells (pre-treated or not with hemin) were extensively washed with PBS. Then, the inserts were placed into tissue culture plates containing MC3T3 so that the two different cell types shared the culture medium but were not in physical contact. Co-culturing of PC3 cells with MC3T3 was performed with
α-MEM plus 2% FBS for 24 h. As control, each cell type (PC3 cells and MC3T3 cells) was grown alone. On day 3, all CM were collected and used to incubate new PC3 cells for 24 h so as to perform immunofluorescence and filopodia analysis on day 4. Cultures were done in triplicate and each experiment was assayed three times.
siRNA transfection. siRNA anti-HO-1 (siHO-1) was used to knock down HO-1 expression and siRNA scramble was used as a negative control (ON-TARGETplus siRNA reagents, both purchased at Dharmacon, Pittsburgh, Pennsylvania, USA). The HO-1 siRNA is a pull of four targeted siRNA (HO-1 siRNA cat# L-006372-00-05, scrambled siRNA cat# D-001810-01-05). In all, 1 × 10⁶PC3
cells were grown in 12-well plates until 60% confluence and then transfected using Dharmacon (US) transfection reagent (Dharmacon) in medium supplemented with 10% FBS without antibodies. One day after transfection, the medium was replaced for complete medium including or not hemin (80μM, 24 h). Forty-eight hours after transfection, cells were fixed and stained for immunofluorescence experiments.
Bioinformatics inference on protein–protein interactions. Refer-ence amino-acid sequRefer-ences for EEF1A1, GSN, HSPB1, LASP1, MEGF10, MKLN1, MX1, NT5C2, RAI14, TES, TMOD3 (NP_001393.1, NP_001121135.2, NP_001531.1, NP_006139.1, NP_115822.1, NP_037387.2, NP_001171517.1, NP_001127845.1, NP_001138993.1, NP_056456.1, NP_055362.1, respectively) were annotated from RefSeq and a search for similar protein structures was achieved using Basic Alignment and Search Tool (BLAST) against the Protein Data Bank (PDB). The resulting structures were selected by assessment of the alignment coverage and score. Domain data were collected from the Protein Family database (PFAM). HO-1 interactor candidate protein domains were annotated and searches in the Interaction Protein Family (iPfam) database were performed, in order to get structural description of domain–domain interactions. The information gathered from these databases was used as input for the construction of an interaction network using Cytoscape 3.2.1 software.
Bioinformatics analysis
Information source and eligibility criteria (Oncomine): We searched the public cancer microarray database, Oncomine (715 data sets investigating and 68 tumor types), to identify expression microarray data sets that compared the expression of prostate adenocarcinoma versus prostate gland. In order to be included in our study, a data set was required to (1) be generated from human tumors, (2) compare prostate adenocarcinomaversusprostate gland, (3) have aP -valueo0.05 and (4) have a fold change 41.5 and/or (5) have a gene rank between 1 and 10%. It is worth mentioning that although theP-value criteria was strict for the data set selection, some genes were considered even if the fold change or the gene rank waso1.5% or410%, respectively, when the gene showed a significant over or under expression.
Search/study selection (Oncomine): We performed one search for each gene using the 'gene symbol' as the search term and obtained different number of studies for each gene. The selected studies were analyzed on the basis of normal glandversusprostate adenocarcinoma. Cited literature was reviewed to confirm that the analysis was as documented in the Oncomine database.
Data source and selection criteria (CBioPortal): The cBio Cancer Genomics Portal (http:/cbioportal.org), (open source cancer genomics data platform created by Memorial Sloan-Kettering Cancer Center (MSKCC)) was used to analyze the most common mutations of the selected genes in PCa. The criteria used in order to include data sets in our analysis were the following: (1) type of cancer: PCa; (2) the study must be published and (3) the study must consist of460 samples.
Immunofluorescence experiments and quantitative microscopy: PC3 cells were fixed with 8% paraformaldehyde (PFA) (20 min, room temperature) and stained with rhodamine–phalloidin (1 h, room temperature). Confocal images were acquired by confocal microscopy (FV1000, Olympus, Tokyo, Japan) using an UPlanSApo 60x oil immersion objective (NA 1/41.35; Olympus), a diode laser of 543 nm as the excitation source and fluorescence was collected in the range of 555–655 nm. We selected the regions from which filopodia from two neighboring cells were in contact, considered as 'contacts', and divided these regions into segments where the distance between the cells remained constant. An intensity profile for each of these areas was analyzed with a custom made Matlab algorithm to count contacts. A 'contact density' was defined for each region as the ratio between the number of contacts and the length of the profile.
To determine the distance to the first neighbor, cells were fixed with PFA8% and stained with C-Laurdan. Wide field fluorescence images were acquired using an Olympus IX71 inverted epifluorescence microscope, with an UPlanSApo 10x objective (NA 0.30, Olympus). The images were obtained using a Qimaging EXI Aqua camera. The images were analyzed with an algorithm designed to binnarize the image and assign a label to each set of connected pixels. Every set of connected pixels represents a single cell in most cases and a cell cluster when the binnari-zation process could not distinguish among cells in contact or too close to each other. For every cell–cell cluster, the distance to all the other cell–cell clusters was calculated and to the first neighbor cell. Distances were normalized to the average cell radius.
Microtubule mechanics in PC3 cells was evaluated using confocal micro-scopy. Cells were treated with a primary antibody against tubulin and secondary antibody conjugated with Alexa-647. The effective Lp of microtubules in PC3 cells was determined using the methodology described by Gittes et al.,37 for cells
treated or not with hemin. Briefly, microtubule xy positions were recovered using a filament tracking routine,38a Fourier analysis was performed on the shape of the filaments and mode amplitudes were recorded. Finally, Lp* was obtained by fitting an inverse square law to the ensemble variance of these amplitudes as a function of the mode number.
Image processing for presentation: Confocal and wide field microscope images were processed for presentation using ImageJ software (NIH, Bethesda, MD, USA). Background of each channel was subtracted and in some cases a median filter (radius: 1 pixel) was applied only for presentation.
Immunoblotting: PC3 cells were lysed with CelLytic M Cell Lysis Reagent (Sigma-Aldrich, UK), incubated on ice for 20 min, centrifuged at 12 000 r.p.m. for 3 min and the supernatant was collected. Protein concentration was determined using the bicinchoninic acid (BCA) protein assay kit from (Sigma-Aldrich, UK). Samples were then resolved by SDS-PAGE, transferred to a nitrocellulose membrane (Invitrogen). Membranes were blocked for 1 h with 5% (w/v) non-fat milk in TBS-T buffer (0.1% Tween-20 in 10 mM Tris-HCl pH 7.4), and then incubated with
specific primary antibodies overnight at 4oC: anti-HO-1 (1 : 1000), anti-β-actin (1 : 4000). The next day, the membranes were incubated with secondary antibodies for 1 h at room temperature. Protein bands were detected using ECL reagents (Amersham Ltd).
Germany) set at 37oC. Phase contrast images were taken every 20 min during 48 h using a camera AxioCam HRm from Zeiss. The movies were processed using the cell tracking plug-in from Fiji (http://fiji.sc/Fiji) to extract cell trajectories and analyzed to obtain the MSD following equation 1, where x and y are the coordinates of the particle, t is time, and the brackets represent the trajectories ensamble average (see equation 1).
MSDðtÞ ¼oðxðtÞ xð0ÞÞ42þ ðyðtÞ yð0ÞÞ42> ð1Þ
Statistical analysis. Results are shown as mean±s.e.m of ‘n’ separate independent experiments unless otherwise is stated. In cases were binning was required, the size of the bins was determined by Freedman–Diaconi's rule. Boxplots show mean, median and whiskers represent the 5–95% window. For the distance analysis to the first neighboring cell, distributions were compared with a two-sample Kolmogorov–Smirnov test. A kernel smoothing density estimate was applied to the data in order to obtain probability density estimate curves.
RNA sequencing.The sequencing libraries for the RNA samples were prepared with the TruSeq Stranded Total RNA kit (Illumina Inc., San Diego, CA, USA), from 1μg total RNA. Following the manufacturer’s instructions, the first step depleted rRNA from total RNA. After ribosomal depletion, the remaining RNA was purified, fragmented and primed for cDNA synthesis. Fragmented RNA was then reverse transcribed into first-strand cDNA using random primers. The next step removed the RNA template and synthesized a replacement strand, incorporating dUTP in place of dTTP to generate ds cDNA. AMPure XP beads were used to separate the ds cDNA from the second strand reaction mix resulting in blunt-ended cDNA. A single‘A’nucleotide was then added to the 3’ends of the blunt fragments. Multiple indexing adapters, containing a single‘T’nucleotide on the 3’end of the adapter, were ligated to the ends of the ds cDNA, preparing them for hybridization onto a flow cell. Libraries were purified and validated for appropriate size on a 2100 Bioanalyzer High Sensitivity DNA chip (Agilent Technologies, Inc., Santa Clara, CA, USA). The DNA library was quantitated using Kapa Biosystems qPCR kit (Wilmington, MA, USA), and then pooled together in an equimolar manner to a final concentration of 2 nM, following experimental design criteria. Each pool was denatured, diluted to 10pM, and clustered to individual lanes of a HiSeq Flow Cell using an Illumina cBot and the corresponding paired-end TruSeq V3 cluster kit. Pooled, clustered samples were then run on a HiSeq2500 sequencer according to the manufacturer's recommended protocol (Illumina Inc.).
Conflict of Interest
The authors declare no conflict of interest.
Acknowledgements. We are grateful to the Prostate Cancer Foundation for the Young Investigator Award given to Geraldine Gueron. This work was supported by grants from the Prostate Cancer Foundation (Young Investigator award PCF), NIH-5-P50-CA14038; Start-up grant from The University of North Carolina at Chapel Hill, AGENCIA-PICT 2013-0996 and 2015-1786 (Argentina), UBACyT 2014-2017 nº497 (Argentina), and the National Cancer Institute (INC - Argentina).
Author contributions
Conception/design: EV and GG. Provision of reagents and facilities: PV, MS, LB, VL, NN, EV and GG. Acquisition of data: AP, CP, FS, EO, NA and EL. Analysis/
interpretation of data: AP, CP, PV, JG, MM, JC, AW-R, LB, VL, NN, EV and GG. Writing of the manuscript: AP, EV and GG. Review of the manuscript: JG, AW-R, MM, JC, LB, VL and NN. Study supervision: EV and GG.
1. American Cancer Society. Cancer facts and figures. Cancer facts and figures, 2016. Available at http://www.cancer.org/research/cancerfactsstatisti.
2. Swami M. Proteomics: a discovery strategy for novel cancer biomarkers.Nat Rev Cancer
2010;10: 597.
3. Clainche C Le, Carlier M-F. Regulation of actin assembly associated with protrusion and adhesion in cell migration.Physiol Rev2008;88: 489–513.
4. Okegawa T, Pong RC, Li Y, Hsieh JT. The role of cell adhesion molecule in cancer progression and its application in cancer therapy.Acta Biochim Polonica2004;51: 445–457. 5. Fan L, Wang H, Xia X, Rao Y, Ma X, Ma Det al.Loss of E-cadherin promotes prostate cancer metastasis via upregulation of metastasis-associated gene 1 expression.Oncol Lett
2012;4: 1225–1233.
6. Parsons JT, Horwitz AR, Schwartz M A. Cell adhesion: integrating cytoskeletal dynamics and cellular tension.Nat Rev Mol Cell Biol2010;11: 633–643.
7. Bowser JL, Blackburn MR, Shipley GL, Molina JG, Dunner K Jr, Broaddus RRet al.Loss of CD73-mediated actin polymerization promotes endometrial tumor progression.J Clin Invest
2016;126: 220–238.
8. Vasioukhin V, Bauer C, Yin M, Fuchs E. Directed actin polymerization is the driving force for epithelial cell-cell adhesion.Cell2000;100: 209–219.
9. Matsumoto H, Ishikawa K, Itabe H, Maruyama Y. Carbon monoxide and bilirubin from heme oxygenase-1 suppresses reactive oxygen species generation and plasminogen activator inhibitor-1 induction.Mol Cell Biochem2006;291: 21–28.
10. Otterbein LE, Soares MP, Yamashita K, Bach FH. Heme oxygenase-1: unleashing the protective properties of heme.Trends Immunol2003;24: 449–455.
11. Keyse SM, Tyrrell RM. Heme oxygenase is the major 32-kDa stress protein induced in human skin fibroblasts by UVA radiation, hydrogen peroxide, and sodium arsenite.Proc Natl Acad Sci USA1989;86: 99–103.
12. Jozkowicz A, Was H, Dulak J. Heme oxygenase-1 in tumors: is it a false friend?Antioxidants Redox Signal2007;9: 2099–2117.
13. Gueron G, Giudice J, Valacco P, Paez A, Elguero B, Toscani Met al.Heme-oxygenase-1 implications in cell morphology and the adhesive behavior of prostate cancer cells.
Oncotarget2014;5: 4087–4102.
14. Gueron G, De Siervi A, Ferrando M, Salierno M, De Luca P, Elguero Bet al.Critical role of endogenous heme oxygenase 1 as a tuner of the invasive potential of prostate cancer cells.
Mol Cancer Res2009;7: 1745–1755.
15. Ferrando M, Gueron G, Elguero B, Giudice J, Salles A, Leskow FCet al.Heme oxygenase 1 (HO-1) challenges the angiogenic switch in prostate cancer.Angiogenesis2011;14: 467–479.
16. Sudo H, Kodama HA, Amagai Y, Yamamoto S, Kasai S.In vitrodifferentiation and calcification in a new clonal osteogenic cell line derived from newborn mouse calvaria.
J Cell Biol1983;96: 191–198.
17. Smith HW, Marra P, Marshall CJ. uPAR promotes formation of the p130Cas-Crk complex to activate Rac through DOCK180.J Cell Biol2008;182: 777–790.
18. An L, Liu CT, Qin XB, Liu QH, Liu Y, Yu SY. Protective effects of hemin in an experimental model of ventilator-induced lung injury.Eur J Pharmacol2011;661: 102–108. 19. Chen C, Zhang F, Zhang Z, Peng M, Wang Y, Chen Yet al.TLR4 signaling-induced heme
oxygenase upregulation in the acute lung injury: role in hemorrhagic shock and two-hit induced lung inflammation.Mol Biol Rep2013;40: 1167–1172.
20. Elguero B, Gueron G, Giudice J, Toscani MA, De Luca P, Zalazar Fet al.Unveiling the association of STAT3 and HO-1 in prostate cancer: role beyond heme degradation.
Neoplasia (New York, NY)2012;14: 1043–1056.
21. Lin C-W, Shen SC, Hou WC, Yang LY, Chen YC. Heme oxygenase-1 inhibits breast cancer invasion via suppressing the expression of matrix metalloproteinase-9.Mol Cancer Ther
2008;7: 1195–1206.
22. Skrzypek K, Tertil M, Golda S, Ciesla M, Weglarczyk K, Collet Get al.Interplay between heme oxygenase-1 and miR-378 affects non-small cell lung carcinoma growth, vascularization, and metastasis.Antioxidants Redox Signal2013;19: 644–660.
23. Tertil M, Golda S, Skrzypek K, Florczyk U, Weglarczyk K, Kotlinowski Jet al.Nrf2-heme oxygenase-1 axis in mucoepidermoid carcinoma of the lung: Antitumoral effects asso-ciated with down-regulation of matrix metalloproteinases.Free Radical Biol Med2015;89: 147–157.
24. Was H, Dulak J, Jozkowicz A. Heme oxygenase-1 in tumor biology and therapy.Curr Drug Targets2010;11: 1551–1570.
25. Wegiel B, Gallo D, Csizmadia E, Harris C, Belcher J, Vercellotti GMet al. Carbon monoxide expedites metabolic exhaustion to inhibit tumor growth.Cancer Res2013;73: 7009–7021.
26. Stevenson RP, Veltman D, Machesky LM. Actin-bundling proteins in cancer progression at a glance.J Cell Sci2012;125: 1073–1079.
27. Narumiya S, Tanji M, Ishizaki T. Rho signaling, ROCK and mDia1, in transformation, metastasis and invasion.Cancer Metastasis Rev2009;28: 65–76.
28. Swaminathan V, Mythreye K, O'Brien ET, Berchuck A, Blobe GC, Superfine R. Mechanical Stiffness grades metastatic potential in patient tumor cells and in cancer cell lines.Cancer Res2011;71: 5075–5080.
29. Mohamedali KA, Li ZG, Starbuck MW, Wan X, Yang J, Kim Set al.Inhibition of prostate cancer osteoblastic progression with VEGF 121/rGEL, a single agent targeting osteoblasts, osteoclasts, and tumor neovasculature.Clin Cancer Res2011;17: 2328–2338. 30. Ferrando M, Wan X, Meiss R, Yang J, De Siervi A, Navone Net al.Heme oxygenase-1
(HO-1) expression in prostate cancer cells modulates the oxidative response in bone cells.
PLoS One2013;8.
31. Daves MH, Hilsenbeck SG, Lau CC, Man TK. Meta-analysis of multiple microarray datasets reveals a common gene signature of metastasis in solid tumors.BMC Med Genomics2011; 4: 56.
32. Grasso CS, Wu YM, Robinson DR, Cao X, Dhanasekaran SM, Khan APet al.The muta-tional landscape of lethal castration-resistant prostate cancer. Nature 2012; 487: 239–243.
33. Griffith E, Coutts AS, Black DM. RNAi knockdown of the focal adhesion protein TES reveals its role in actin stress fibre organisation.Cell Motility Cytoskeleton2005;60: 140–152.
34. Gunduz E, Gunduz M, Beder L, Nagatsuka H, Fukushima K, Sutcu Ret al.Downregulation of TESTIN and its association with cancer history and a tendency toward poor survival in head and neck squamous cell carcinoma.Arch Otolaryngol Head Neck Surg2009;135: 254–260.
35. Valiyaveettil M, Bentley AA, Gursahaney P, Hussien R, Chakravarti R, Kureishy Net al.Novel role of the muskelin-RanBP9 complex as a nucleocytoplasmic mediator of cell morphology regulation.J Cell Biol2008;182: 727–739.
36. Keller A, Nesvizhskii AI, Kolker E, Aebersold R. Empirical statistical model to estimate the accuracy of peptide identifications made by MS/MS and database search.Analyt Chem
2002;74: 5383–5392.
37. Gittes F, Mickey B, Nettleton J, Howard J. Flexural rigidity of microtubules and actin filaments measured from thermal fluctuations in shape.J Cell Biol1993;120: 923–934. 38. Pallavicini C, Levi V, Wetzler DE, Angiolini JF, Benseñor L, Despósito MAet al.Lateral
motion and bending of microtubules studied with a new single-filament tracking routine in living cells.Biophys J2014;106: 2625–2635.