selection criteria.
One of two things can happen to those cases that do not meet the selection criteria. When filtered, the cases that do not meet the selection criteria remain in the data file, but are turned ‘off’, much like missing values, so that they are not counted in further analysis. In the example above, all cases that are not from the North East will not be used in determining the frequency distribution of Respondent’s Sex. The alternative to filtering is for cases to be deleted so that only those cases that meet the selection criteria remain in the data file. Filtering is the default setting, and the one we generally use, since deleting cases is a fairly drastic step, and should only be used when we wish to trim down a very large file that requires a large amount of processing time. Even so, it is advisable that, when the deleted option is chosen, the new data set with only the selected cases is saved with a new name so that the original data set with all cases is available if we find that we need it again.
Selecting cases using a single conditional criterion
The selection criteria that we use in the Select Cases command can be very elaborate involving many variables, arithmetic operations, and/or functions. We will introduce the Select Cases command by working through an example that involves the simplest selection criterion, which is where we select cases that have a particular value for a single existing variable. An example is the one we introduced above where we wish to narrow down the 1991 U.S. General Social Survey data set to those cases just from the North East. To isolate these cases we follow the procedure in Table 1 (Figure 1).
Table 1: The Select Cases If command (file: 1991 U.S. General Social Survey)
SPSS command/action Comment
1 Select Data/Select Cases This brings up the Select Cases dialog box
2 Click on the radio button next to If condition is satisfied The default setting is for SPSS to use all cases. By clicking on the radio button we are instructing SPSS that only a sub-set of cases will be used
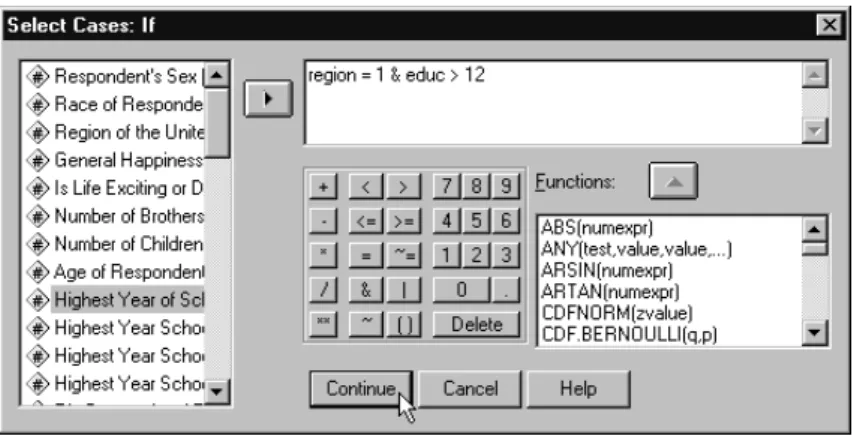
3 Click on the If condition is satisfied button This brings up the Select Cases: If dialog box
4 In the source variable list select the variable whose values will act as the filter. Here we are filtering according to the values of Region of the United States
5 Click on This pastes the selected variable in the area where the filter criteria are determined
6 From the calculator pad in the box, or from the keyboard, select = 1
This instructs SPSS to select all those cases whose value for
Region of the United States is 1, which is the code for North East
7 Click Continue 8 Click OK
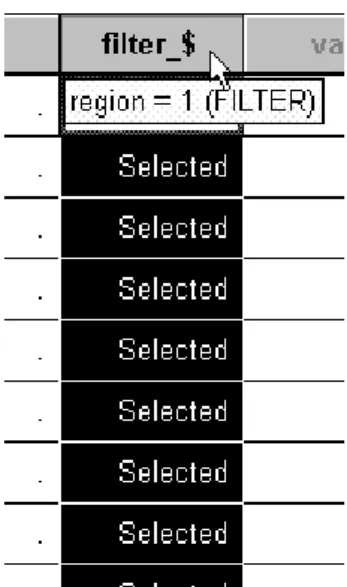
Figure 1(a) The SPSS Select Cases command and (b) The SPSS Select Cases: If dialog box
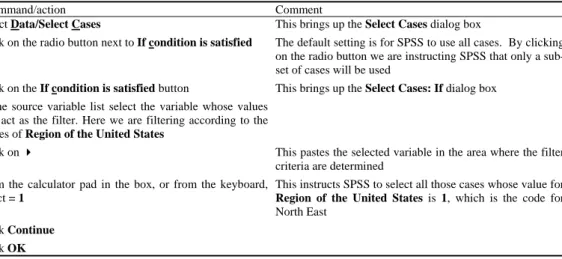
The effect of this will be to create a new variable as the last column in the Data Editor. This variable is labelled filter_$ (Figure 2).
Figure 2 The Data Editor with filter variable
Cases will be given a value of 0 (Not Selected) for this filter variable if they do not conform to the filtering criteria used in the Select Cases command (in this example those cases that are not from the North East) and a value of 1 (Selected) if they do fulfil the selection criteria (in this instance, cases that are from the North East). You will also notice that those cases for which the selection criterion is not true will have a slash mark through their respective row numbers, indicating that they will not be used in any subsequent analysis.
We can observe the effect of this procedure by comparing a frequency table for Respondent’s Sex before selection (Figure 3) and after the selection of just North East cases only (Figure 4).
Figure 4 Frequency of Respondent’s Sex: North East cases only
The program has selected out those 679 cases from the total of 1517 that have a value of North East for the Region variable.
It is important to remember that SPSS will continue to use the filter until we instruct it otherwise. The fact that the filter is operating is indicated in the status bar at the bottom of the window (Figure 5).
Figure 5 Filter On status
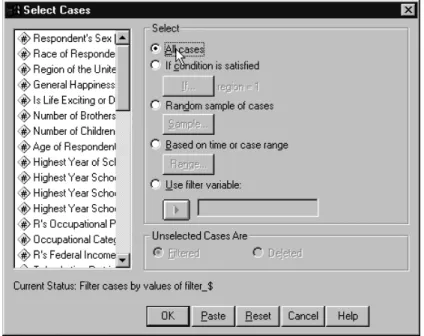
Thus if we want to continue analysis using the whole data set rather than the sub-set we have isolated, we need to go back into the Select Cases dialog box and click on the radio button next to All cases
(Figure 6).
Figure 6 Selecting all cases
There are a number of other criteria by which cases can be selected, which are summarized in the Figure 7.
Figure 7 Overview of the Select Cases dialog box
Selecting cases using multiple conditional criteria
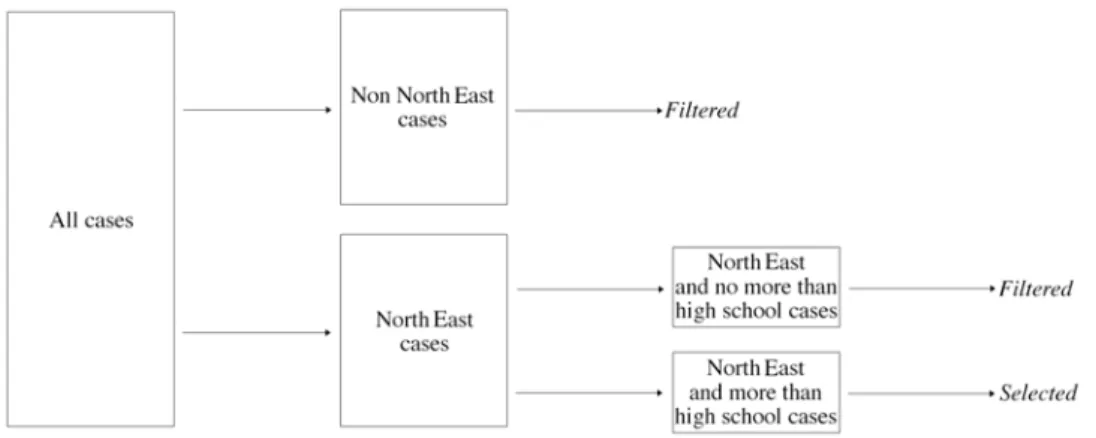
We will now go through a slightly more complicated example where we select cases on the basis of more than one criterion, involving two variables. For example, assume that we not only want to select cases from the North East but also want to narrow this group down further to only those cases that have more than a high school education, defined as those cases with more than 12 years of education. This combination of selection criteria is illustrated in Figure 8.
Figure 8 Filtering with two variables
To achieve this selection in SPSS we follow exactly the same procedure outlined in Table 1, but with one slight addition. After indicating region = 1 we then include & educ > 12 in the selection criteria field (Figure 9).
same result:
region = 1& educ >= 13
‘Greater than 12’ is logically equivalent, given our units of measurement, to ‘greater than or equal to 13’.
The effect of this additional selection criterion is evident when we look at the Data Editor (Figure 10).
Figure 10 The Data Editor after case selection
We can see that the first case which, in the previous instance where we used a single selection criterion, was not filtered, now has a slash through its case number indicating that it is now filtered. This is because this case, while from the North East, only had 12 years of education and therefore does not satisfy the second of our selection criteria. Case 2, on the other hand, is also from the North East, but has 20 years of education, and therefore is a case of interest, signalled by the fact that it does not have a slash through its case number.
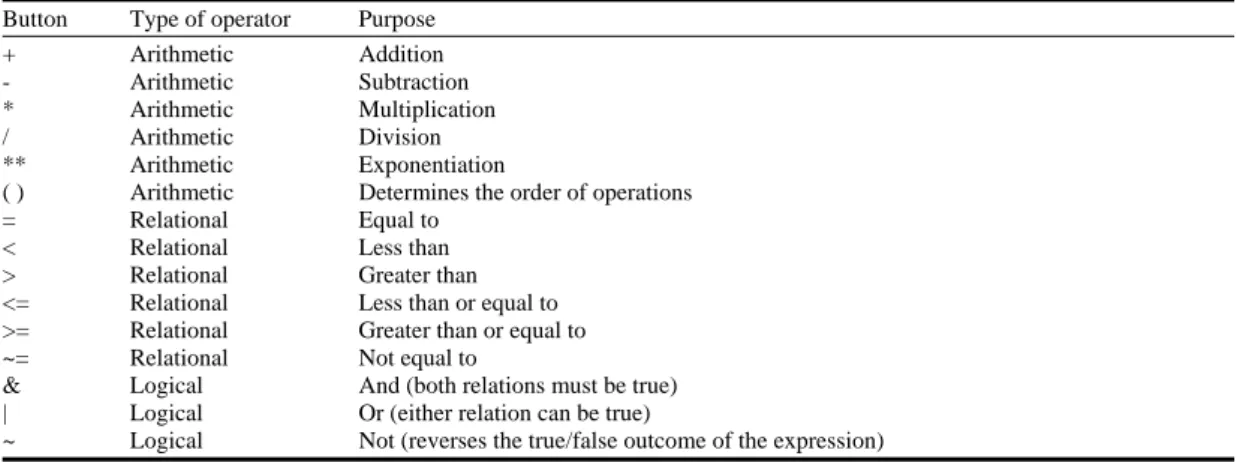
When clicking the relevant buttons on the key pad that appear on the Select Cases: If dialog box, you may have observed some whose meaning may not be immediately obvious. A full list of these buttons and their respective purpose is presented in Table 2.
These operators can be used in any combination that we require. For example, the expression
(age * 2) < 40
selects all cases whose age multiplied by 2 is less than 40.
Selecting cases using functions
Another means by which cases can be selected is through the use of the functions that appear in the area headed Functions: in the Select Cases: If dialog box. There are over 70 such functions so we cannot go through these in detail. SPSS will give a brief description of a particular function if you hold down the Shift key on your keyboard and click on the relevant function. But to give a sense of how we work with them we will illustrate one of the most useful functions, called ANY(test, value, value,…).
Suppose that we are interested in the occupational category variable (occcat80) in the 1991 U.S. General Social Survey data set. We are not, however, interested in all occupational categories. Instead we want to compare those cases coded as Managerial and Professional Specialty (= 1) with those cases coded as Service (= 3) and with those coded as Operation, Fabrication, and General Labor (= 6). One way is to use the techniques we looked at above, and type the following expression into the
Select Cases: If dialog box.
occcat80 = 1 | occcat80 = 3 | occcat80 = 6
A more efficient way to do this is to select ANY(test, value, value,…) from the Functions: list and paste it up into the expressions window. If we then highlight over test and type occcat80 (or else highlight over test, select occcat80 from the source variable list, and click )occcat80 will be entered into the function. We then highlight over value, value,… and type 1, 3, 6 which are the values for
occcat80 that we are interested in.
In short, we want to finish with the following Select Cases If dialog box (Figure 11).
will change to reflect this. If I then wanted to go back to the original selection criteria of all North East cases I would have to respecify this in the Select Cases: If dialog box.
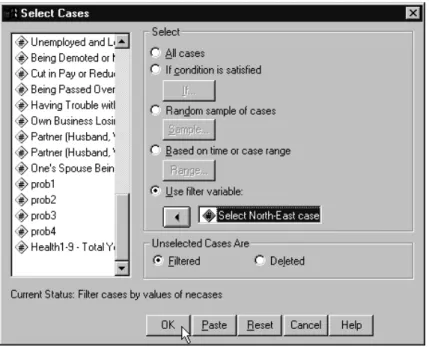
Similarly, I might construct a very elaborate and complicated select if statement that took a bit of trial and error to develop. Having used it I might feel that I may want to use it in the future but I am not completely sure. Rather than allowing it to be obliterated by any subsequent Select Cases commands which would overwrite the filter_$ variable, it would be more sensible to rename it, define its features, and save it. This new variable will then be permanently stored, and will appear in the variable list when I choose the Select Cases command. Rather than choosing If, as we did above and retyping the criteria, I simply paste the selection variable into the area headed Use filter variable.
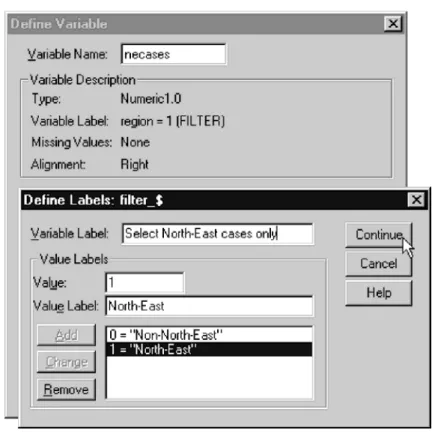
For example, when I generated the selection statement for North East cases only I could go into the Define Variables dialog box (by double-clicking on the shaded cell at the top of the column that contains filter_$). I could then follow the procedures detailed in Chapter 2 to give the variable a name, a variable label, and value labels (Figure 12), such as:
Variable name: necases
Variable label: Select all North East cases Values and Value labels: 0 = Non-North East
1 = North East
Figure 13 Selecting an existing filter variable
I could also use this variable, like any other variable, to generate frequencies, graphs, etc.
If I now use new selection criteria another column of data will appear, after the necases variable, with the filter_$ name.