NAVAL
POSTGRADUATE
SCHOOL
MONTEREY, CALIFORNIA
THESIS
SYMBOLIC EXECUTION OVER NATIVE X86
by Michael Hom
June 2012
Thesis Advisor: Chris S. Eagle
Second Reader: George W. Dinolt
REPORT DOCUMENTATION PAGE
OMB No. 0704–0188Form ApprovedThe public reporting burden for this collection of information is estimated to average 1 hour per response, including the time for reviewing instructions, searching existing data sources, gathering and maintaining the data needed, and completing and reviewing the collection of information. Send comments regarding this burden estimate or any other aspect of this collection of information, including suggestions for reducing this burden to Department of Defense, Washington Headquarters Services, Directorate for Information Operations and Reports (0704–0188), 1215 Jefferson Davis Highway, Suite 1204, Arlington, VA 22202–4302. Respondents should be aware that notwithstanding any other provision of law, no person shall be subject to any penalty for failing to comply with a collection of information if it does not display a currently valid OMB control number. PLEASE DO NOT RETURN YOUR FORM TO THE ABOVE ADDRESS.
1. REPORT DATE (DD–MM–YYYY)2. REPORT TYPE 3. DATES COVERED (From — To)
4. TITLE AND SUBTITLE 5a. CONTRACT NUMBER
5b. GRANT NUMBER
5c. PROGRAM ELEMENT NUMBER
5d. PROJECT NUMBER
5e. TASK NUMBER
5f. WORK UNIT NUMBER 6. AUTHOR(S)
7. PERFORMING ORGANIZATION NAME(S) AND ADDRESS(ES) 8. PERFORMING ORGANIZATION REPORT
NUMBER
9. SPONSORING / MONITORING AGENCY NAME(S) AND ADDRESS(ES) 10. SPONSOR/MONITOR’S ACRONYM(S)
11. SPONSOR/MONITOR’S REPORT NUMBER(S)
12. DISTRIBUTION / AVAILABILITY STATEMENT
13. SUPPLEMENTARY NOTES
14. ABSTRACT
15. SUBJECT TERMS
16. SECURITY CLASSIFICATION OF:
a. REPORT b. ABSTRACT c. THIS PAGE
17. LIMITATION OF ABSTRACT
18. NUMBER OF PAGES
19a. NAME OF RESPONSIBLE PERSON
19b. TELEPHONE NUMBER (include area code)
4–5–2012 Master’s Thesis 2010-03-26—2012-03-26
Symbolic Execution Over Native x86
Michael Hom
Naval Postgraduate School Monterey, CA 93943
Department of the Navy
Approved for public release; distribution is unlimited
The views expressed in this thesis are those of the author and do not reflect the official policy or position of the Department of Defense or the U.S. Government.IRB Protocol Number: N/A
Current approaches to program analysis largely rely on the use of an intermediate language to derive intermediate representations of source code or binaries under evaluation. This can simplify semantics when dealing with a complex instruction set such as the Intel Industry Standard Architecture (ISA) instruction set. However, a question that remains is whether these intermediate languages truly retain semantic fidelity or whether elements of the ISA instruction set get lost in translation. This thesis describes a framework that is being developed at NPS that accomplishes symbolic execution without the use of an intermediate language and symbolically executes ELF and WinPE binary programs over the native x86 ISA instruction set, and specifically discusses an approach to describing state mathematically using a formal algebra.
Program Analysis, Symbolic Execution, Theorem Proving, x86, SMT, SAT
Approved for public release; distribution is unlimited
SYMBOLIC EXECUTION OVER NATIVE X86
Michael Hom
Civilian, Department of the Navy B.S., University of California, San Diego, 2005
Submitted in partial fulfillment of the requirements for the degree of
MASTER OF SCIENCE IN COMPUTER SCIENCE
from the
NAVAL POSTGRADUATE SCHOOL June 2012
Author: Michael Hom
Approved by: Chris S. Eagle
Thesis Advisor
George W. Dinolt Second Reader
Peter J. Denning
ABSTRACT
Current approaches to program analysis largely rely on the use of an intermediate language to derive intermediate representations of source code or binaries under evaluation. This can sim-plify semantics when dealing with a complex instruction set such as the Intel Industry Standard Architecture (ISA) instruction set. However, a question that remains is whether these interme-diate languages truly retain semantic fidelity or whether elements of the ISA instruction set get lost in translation. This thesis describes a framework that is being developed at NPS that accomplishes symbolic execution without the use of an intermediate language and symboli-cally executes ELF and WinPE binary programs over the native x86 ISA instruction set, and specifically discusses an approach to describing state mathematically using a formal algebra.
Table of Contents
1 Introduction 1
1.1 Research Questions . . . 2
1.2 Significant Findings . . . 2
1.3 Thesis Structure . . . 2
2 Background and Related Work 3 2.1 Motivation . . . 3
2.2 Disassembly and Intermediate Language Limitations . . . 5
2.3 Symbolic Execution . . . 10
2.4 Computational Complexity Issues. . . 14
3 Symbolic Analysis Framework 19 3.1 Emulation Engine . . . 20
3.2 Algebra Engine . . . 22
3.3 Taint Engine . . . 22
3.4 The Theorem Prover . . . 24
4 Reasoning Over Native x86 27 4.1 Developing Reasoning Over x86 Architecture . . . 29
4.2 Establishing Semantics . . . 30
4.3 Applying the Math: A Worked Example . . . 37
5 Conclusions and Future Work 57 5.1 Conclusions and Discussions . . . 57
Appendices 61
A Program Listing: tree.c 61
B Disassembly Listing: tree 63
C Program Listing: simple-branch.c 69
D Disassembly Listing: simple-branch 71
E Program Listing: loop-branch.c 73
F Disassembly Listing: loop-branch 75
List of References 79
List of Figures
Figure 2.1 Disassembly of the Main Function to a Hello World Program (Taken
from IDA Pro) . . . 6
Figure 2.2 Part of a Disassembly to a Hello World Program Packed with the Ulti-mate Packer for eXecutables (UPX) (Taken from IDA Pro) . . . 7
Figure 2.3 A Simple Hello World Graph (Taken from IDA Pro) . . . 8
Figure 2.4 A Decidedly More Complicated Graph of Hello World with UPX (Taken from IDA Pro) . . . 9
Figure 2.5 A Simple Example of a CFG (Taken from IDA Pro) . . . 11
Figure 2.6 A Functionally Simple Program Visualized by Its CFG (Taken from IDA Pro) . . . 16
Figure 3.1 A Notional Diagram of Analysis Framework . . . 20
Figure 4.1 Instruction Encoding Definition . . . 31
Figure 4.2 Generic Basic Block ofnInstructions . . . 33
Figure 4.3 Basic Block Encoding Definition . . . 33
Figure 4.4 Basic Block of Instructions with Set Difference Break Out . . . 33
Figure 4.5 A Simple C Program with Branching (Taken from IDA Pro) . . . 34
Figure 4.6 Program Path Encoding Definition . . . 37
Figure 4.7 loop-branchOutput Example . . . 38
Figure 4.8 CFG of Programloop-branch(Taken from IDA Pro) . . . 39
Figure 4.10 Initialloop-branchProgram State . . . 40
Figure 4.11 push ebpInstruction Encoding . . . 41
Figure 4.12 Instruction Encodings for Basic Block 0 . . . 42
Figure 4.13 loop-branchBasic Block 1 (Taken from IDA Pro) . . . 43
Figure 4.14 loop-branchBasic Block 3 (Taken from IDA Pro) . . . 43
Figure 4.15 State that causes Basic Block 0 to Branch to Basic Block 1 . . . 43
Figure 4.16 State that causes Basic Block 0 to Branch to Basic Block 3 . . . 44
Figure 4.17 loop-branchBasic Block 5 (Taken from IDA Pro) . . . 44
Figure 4.18 State at Basic Block 1 Entrance . . . 45
Figure 4.19 loop-branchBasic Block 2 (Taken from IDA Pro) . . . 45
Figure 4.20 loop-branchBasic Block 4 (Taken from IDA Pro) . . . 45
Figure 4.21 State at Basic Block 2 Entrance . . . 46
Figure 4.22 State at Basic Block 4 Entrance . . . 46
Figure 4.23 loop-branchBasic Block 7 (Taken from IDA Pro) . . . 47
Figure 4.24 State at Basic Block 7 Entrance . . . 47
Figure 4.25 loop-branchBasic Block 6 (Taken from IDA Pro) . . . 48
Figure 4.26 State at Basic Block 6 Entrance . . . 48
Figure 4.27 loop-branchBasic Block 9 (Taken from IDA Pro) . . . 48
Figure 4.28 loop-branchBasic Block 8 (Taken from IDA Pro) . . . 49
Figure 4.29 State at Basic Block 8 Entrance At Beginning of Loop . . . 49
Figure 4.30 First-Order Logic Example 1 . . . 50
Figure 4.31 First-Order Logic Example 2—Axiomatic Enforcement . . . 50
Figure 4.32 loop-branchBasic Block 0 (Taken from IDA Pro) . . . 52
Figure 4.33 State that causes Basic Block 0 to Branch to Basic Block 1 . . . 52
Figure 4.35 SMT encoding ofψbb00 . . . 54
List of Acronyms and Abbreviations
BDD Binary Decision Diagram CFG Control Flow Graph
COTS Commercial-Off-the-Shelf
DART Directed Automated Random Testing GOTS Government-Off-The-Shelf
IDA Interactive Disassmbler IL Intermediate Language IR Intermediate Representation ISA Instruction Set Architecture
LFCS Labeled Formal Concurrent System LLVM Low Level Virtual Machine
NPS Naval Postgraduate School
SAGE Scalable Automated Guided Execution SAT Satisfiability
SCADA Supervisory Control and Data Acquisition SMT Satisfiability Modulo Theory
Acknowledgements
I would like to acknowledge the following people:
Chris Eagle for being a great thesis advsior and great mentor to me and countless others. Most of us are where we are because of your efforts to teach us and encourage deep thinking on technical subjects.
George Dinolt for his mentorship and guidance in my thesis topic and general academia. Our discussions are interesting and your insight into the history of our field provides context that few understand.
Simson Garfinkel for his mentorship during my time at NPS. Your dedication to your students is uncanny. The time I spent learning from you during my internship provided incredible insight to the world of forensic research and how to think differently to solve hard problems.
Cynthia Irvine for managing the Scholarship For Service program at NPS. You are providing an experience and subsequent opportunities for people that are hard to come by.
Valerie Linhoff for getting me through all phases of NPS and for being incredibly patient with me.
My wife for being an incredible person and making sure I stayed on track. My family for always being the anchor I need, whether I know it or not.
This material is based on work supported by the National Science Foundation under Grant DUE - SFS Scholarships.
CHAPTER 1:
Introduction
The ability to monitor the behavior of a computer program during execution has become a critical capability in computer security. The potential of being able to precisely determine the behavior of a computer program augments the efforts of a broad range of computer security research areas including:
• Memory Analysis
• Software Test Case Generation
• Software Vulnerability Assessments
• Software Optimization
• Software Verification
Symbolic execution is an abstraction of the concept of testing every possible input fed to a pro-gram by tracking symbolic values instead of actual values [1, 2]. Coupling symbolic execution and static program analysis allows us to derive a wealth of information about a binary program and offer insight into the behavior of the binary program and its supposed functionality. With symbolic execution, one can reason about all possible inputs that a binary program might accept when executing. It is not realistically feasible to test every possible input that can be generated and fed into a program. Conversely, it would be very useful to try to test every input possible instead of generating a subset of inputs to fuzz test [3–6] a program.
To generalize, we utilize symbolic execution to attempt to test specific properties of a program we are interested in. As such, employing symbolic execution to perform program analysis re-quires a precise representation of the constraints that will ultimately provide inputs that lead to satisfied test cases. For example, if the goal of performing symbolic execution for program analysis is to determine inputs that will result in stack-based or heap-based buffer overflows, then it is necessary to know the exact constraints on the inputs that led to the overflow.
Evaluating the flow of programs to determine whether a calculated input leads to a program that can be framed as a decision problem. That calculated input consists of a set of constraints that can lead to a potential vulnerability in that binary. To solve these decision problems, these con-straints must be formally represented and supplied to an evaluation engine that can accurately determine whether a given path reaches a potentially vulnerable function.
Capturing appropriate constraints is a critical issue when solving decision problems and associ-ated satisfiability because these constraints capture the state of a program at that exact point in execution. The language that describes the constraints for any program must be detailed enough to encompass what an input constraint can be foranygiven program. Simultaneously, the lan-guage must be concise enough so that the efficiency of solving satisfiability is maximized.
1.1
Research Questions
This thesis poses a primary question that is addressed in Chapter 4: Can an algebra be devel-oped to mathematically describe the state of binary code during execution? More specifically, can this algebra describe the behavior of each instruction in the x86 instruction set, pre- and postconditions of a basic block within binary code, and the overall state of the binary code under execution?
To answer this question, an algebraic framework will be developed to describe how the state of a program under execution can be represented as a set of constraints that will subsequently be tested for satisfiability in reaching a point of execution.
1.2
Significant Findings
Using native x86 Intel architecture, a framework was constructed to accurately model the state of binary code under execution through an algebra. Through this algebra, a basic methodology was constructed to mathematically represent program state at the instruction, basic block, and program level.
1.3
Thesis Structure
This thesis is organized as follows:
• Chapter 2 gives a background of symbolic execution, discusses some applications of sym-bolic execution in computer security research, and gives a survey of related work.
• Chapter 3 describes the development of the program analysis framework that utilizes constraint representation.
• Chapter 4 discusses the algebra that is used to mathematically describe the state of binary code under execution, and as a result, path constraint decision problems.
• Chapter 5 provides conclusions drawn from the previous chapters and recommended fu-ture work.
CHAPTER 2:
Background and Related Work
In this section, we provide the motivation behind the project, discuss some key concepts to provide a context for our approach, and provide a survey of related work in the field.
2.1
Motivation
Computing is now a ubiquitous part of today’s society and is deeply intertwined in day-to-day operations of the world. The majority of devices used on an everyday basis are powered by com-puters of various types and the underlying software that allows people to interact with them— whether they be desktop computers, smart phones, television, cars, or even household appli-ances. The importance of computing software has reached such a critical level that real-time systems such as Supervisory Control and Data Acquisition (SCADA) systems are the driving force behind large-scale industrial systems—such as power centers, water treatment plants, and gas pipelines—that operate continuously. Along with ever increasing usage and requirements of software, there has been a substantial growth of complexity [7].
With the many solutions software provides, there are just as many new problems that arise. Software bugs are prevalent through the lifecyle of any given piece of software and finding them can prove to be an arduous process. The necessity for finding bugs in the context of information security is of critical importance because of the dire consequence of not fixing them, whether it be economic, social, or worse.
There has been a growing trend for malicious software to be spread through the internet, whether it is to spread indiscriminately, or to be aimed at specific targets [8–10]. Researchers who en-counter these pieces of malicious software, or malware, in the wild have the job of analyzing them to understand how they behave and to possibly create countermeasures. There are two primary approaches to performing this analysis: static analysis and dynamic analysis [11]. Static analysis is the act of analyzing a piece of software, whether it is source code or a compiled binary without actually executing the program. With compiled binary programs, the analysis typically involves disassembling the program to recover the program’s assembly code instruc-tions, or to go further and attempt a decompilation of the program by turning the disassembly back into a high-level language (e.g., C/C++). Unfortunately, there are problems with trying to
fully decompile a program and Eagle [12] describes them well:
• The compilation process is lossy.
• Compilation can be a many-to-many operation.
• Decompilers are very language, compiler, and library dependent.
• A nearly perfect disassembly capability is needed in order to accurately decompile a binary.
Working with the disassembly may be more attractive than trying to decompile a program when performing an analysis since the disassembly is easier to obtain with some degree of accuracy but the problem remains that disassembly, by nature, is imperfect.
With tools like IDA Pro [13], a program analyst can disassemble a compiled binary and proceed to perform a manual static analysis of that program to ascertain the program’s behavior and possibly determine vulnerabilities that exist within the program. Depending on the skill level and experience of the analyst, this can be a very effective process for a single program, but may take a long time.
Dynamic analysis is the act of allowing a program to execute and within a carefully controlled environment, often known as a sandbox, while the analyst observes the behavior of the program through system instrumentation. In this scenario, the analyst instruments a binary in a sandbox environment such as a virtual machine to observe program behavior at several levels: the process level, the registry level, the network level, or the storage level, depending on theplatform. This offers some advantages over static analysis, most notably, savings in time to understand some of the behaviors of the program. Instead of poring over lines of disassembly, an analyst can execute a program and observe changes to the program environment as the program runs. Dynamic analysis can certainly provide cost-savings with time but may be subject to other disadvantages. Some malicious software will check for the presence of instrumentation or query the environment in which it is operating. If the software is being run under debugger control, for instance, the process may choose to exit on its own before any salient behavior can be observed. Such techniques are called anti-debugging techniques [14, 15].
2.2
Disassembly and Intermediate Language Limitations
2.2.1
Disassembly Limitations
By nature, disassembly of a program binary is imperfect. These imperfections can be catego-rized as follows [16]:
• False Positives: Misidentified instructions
• False Negatives: Non-disassembled instructions
A disassembler’s job is to determine whether an instruction should be disassembled or not based on whether it is referenced by another instruction [12]. The behavior of these instructions will determine how the program’s control flow is represented during the disassembly of a program. The accuracy and precision of a disassembler is predicated on its ability to recover data type information, distinguishing instructions from data, platform dependencies of the disassembler, and library function identification. The ability to accurately and precisely address these critical areas of a program are what drive results of a good disassembler [17]. Impediments to accurate disassembly include the following [16]:
• Data embedded in the code regions
• Variable instruction size
• Indirect branch instructions
• Functions without explicitCALLsites within the executable’s code segment
• Position Independent Code (PIC) sequences
• Hand crafted assembly code
Further, techniques exist that attempt to counter a disassembler’s ability to properly disassem-ble a program. These anti-disassembly techniques are methods that cause a disassembler to generate an incorrect or incomplete disassembly listing. Generally, programs that make use of anti-disassembly techniques contain instructions that, when interpreted by the disassembler, effectively confuse it and cause it to misidentify the correct instruction bytes at the time of disassembly [18]. This can lead to improperly identified instruction sequences, incomplete in-structions sequences, or cause the disassembler to miss sections of code altogether.
Malware authors commonly try to incorporate anti-disassembly techniques to thwart analysis of malicious software through obfuscation techniques. These techniques include, but are not limited to self-modifying code and virtual machine based obfuscation [14,19]. These techniques
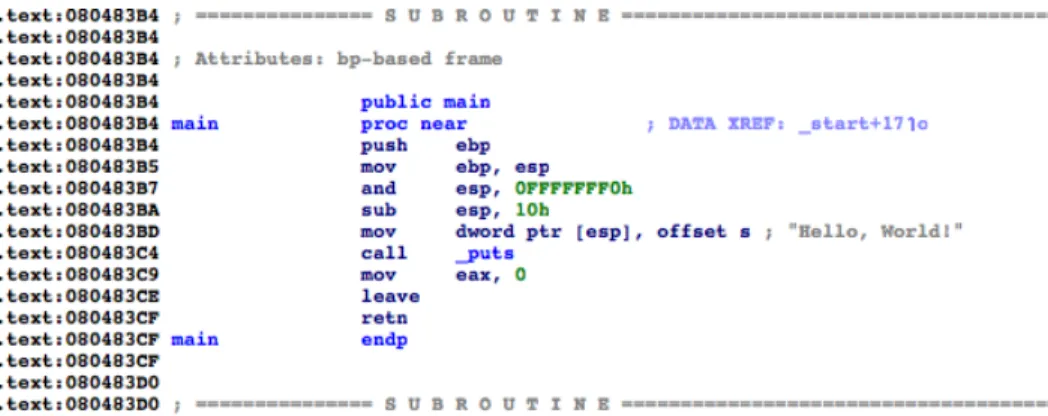
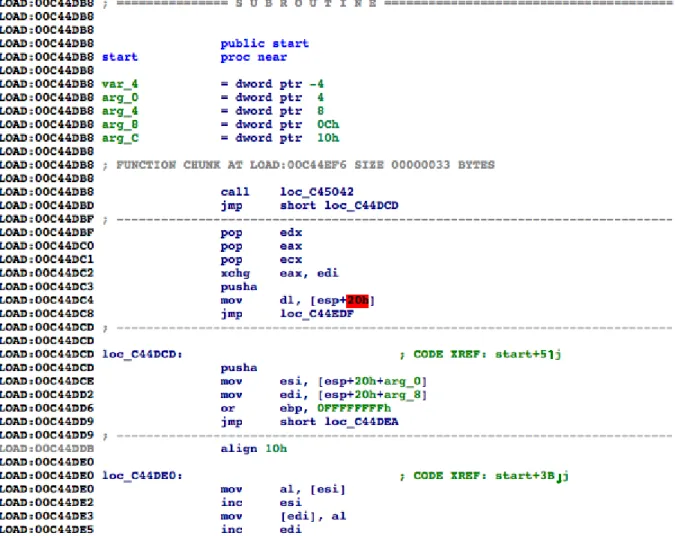
can obscure real code with code that visually may or may not make sense to an analyst but ultimately offers code that can lead to an incorrect analysis. A comparison can be made with Figure 2.1 and Figure 2.2. Figure 2.1 shows what IDA Pro displays of an unobfuscated binary (hello world) after initial analysis, whereas Figure 2.2 shows what IDA Pro displays of an obfuscated binary (hello world) after initial analysis. In this case, the obfuscation technique comes from using the Ultimate Packer for eXecutables (UPX) [20].
Figure 2.1: Disassembly of the Main Function to a Hello World Program (Taken from IDA Pro)
Additional comparisons can be made when inspecting a control flow call graph of both “hello world” iterations.
2.2.2
Intermediate Language Limitations
Intermediate languages are a ubiquitous part of program analysis because of their use in com-pilers [21]. One the main attractions of intermediate languages is how they:
• Reduce semantic complexity during analysis
• Allow code transformations for different architectures from one source
• Allow code analysis optimization
Intermediate language (IL) frameworks like LLVM (formerly standing for Low Level Virtual Machine) [22] are popular because of their ability to retain and honor the semantics of a piece of source code [21], though the extent to which each IL framework honors the original semantics differs based on the depth and complexity of the framework itself. This is advantageous for compilers at various stages of compilation since it allows developers to write compilers that can be used across different OS platforms. For program analysis frameworks [23, 24], an IL can simplify the semantic complexity of a CPU instruction set by abstracting away from mnemonic
Figure 2.2: Part of a Disassembly to a Hello World Program Packed with the Ultimate Packer for eXecutables (UPX) (Taken from IDA Pro)
operation details. However, the design of an IL language leads to issues including the following [21]:
• Depth level—In particular, how machine-dependent it is
• Structure of the language
• Expressiveness—How accurately does it honor original source program semantics
• The types of transformations that can be performed on the IL representation of a source program
It may be the case that IL frameworks dilute the semantics from the original source. An IL and its corresponding translators must be sufficiently rich to express all the behaviors in an instruction’s operation. This can be rather difficult since the behavior of x86 can occasionally
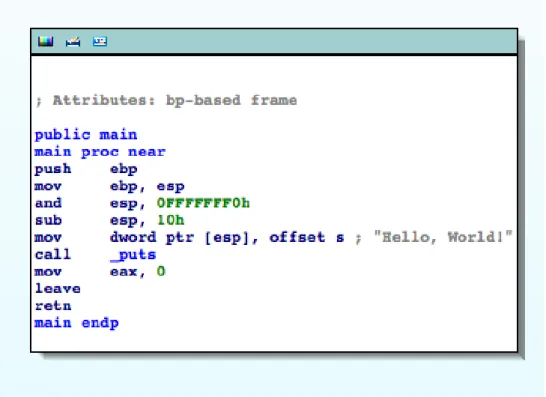
Figure 2.3: A Simple Hello World Graph (Taken from IDA Pro)
be undocumented or documented in an ambiguous manner, and not necessarily mathematically rigorous. Given this, our approach to analyzing a program is to do away with an IL altogether and consider the native x86 assembly as it is encountered during symbolic execution. This may lead to a higher level of complexity when reasoning over native Intel x86 architecture with no abstraction.
2.3
Symbolic Execution
Dynamic analysis is an attractive approach to performing program analysis because it offers the ability to monitor code and program state as it executes. Symbolic execution is an abstraction of normal program execution, where a program is symbolically executed not on a set of sample concrete inputs but rather a set of classes of inputs [2]. This can be interpreted as executing over a set of variables that eventually become bounded to sets of values, which leads to demonstrating desired program properties. Contemporary symbolic execution is a form of dynamic analysis used to constrain the reasoning of a symbolically executed program to logical constraints that are then fed into a model to solve for satisfiability [1].
Symbolic execution is a powerful tool to use when performing dynamic program analysis but there are advantages and disadvantages to the approach. Symbolic execution, by its nature has no runtime context. This is because the initial input, when symbolically executing a program, is unconstrained. In other words, the data domain is unbounded. This allows a complete and exhaustive exploration of all runtime state space in a given program. Since the input is uncon-strained, it can be “anything”, and code dependent on the symbolic input can be used to build logical path constraints that can be used to explore runtime states that may be of interest. In other words, symbolic execution operates on all possible sets of values, whereas normal (con-crete) execution operates only on a single possible set of concrete values that have been defined by the program’s author or inputted by the program user [25].
The first step in symbolic execution is to generate a Control Flow Graph (CFG). A CFG is an abstract representation of all possible paths that can be traversed through a program during its execution using a directed graph, or digraph. In a CFG, each node in the digraph represents a basic block of program instructions. A basic block is defined by Aho, Sethi, and Ullman [26]:
• The block of instructions has one entry point.
• The block of instructions has one exit point.
• Each instruction in a basic block executes before all succeeding instructions in later posi-tions in that same block.
• No other instruction executes between two instructions in the sequence.
• The first instruction in a basic block is known as aleader. The rule for finding leaders are: 1. The first instruction is a leader.
2. Any instruction that is the target of a conditional or unconditional jump is a leader. 3. Any instruction that immediately follows a conditional or unconditional jump is a
leader.
• A basic block consists of a leader and all instruction up to, but not including, the next leader or the end of the program.
In the CFG, directed edges represent jumps in the program execution, each edge is a boolean “truth value” for the condition. Figures 2.5, 2.3, and 2.4 illustrate what a CFG can look like.
Figure 2.5: A Simple Example of a CFG (Taken from IDA Pro)
In the context of finding bugs in a program, symbolic execution helps determine inputs that lead to memory corruption or unexpected paths. The reasoning here is we want to find inputs that will eventually lead to a certain point in the CFG so that we can backtrace to see whatconcrete inputs will cause us to go down that particular path, whether a memory corruption occurs or not. The CFG is used in the analysis to determine the path or paths that will indeed result in memory corruption of a given program. More precisely, we want to derive the set of classes of inputs that will lead us to reachable paths in a programs execution that result in memory corruption, by reasoning over the symbolic values assigned to the program being tested. When reasoning over the symbolic values during analysis, there are conditions (e.g., concrete values or sets of concrete values) that are derived as a result of a path being taken. These path conditions, or
path constraints, are the Boolean statements that form the conditional statements encountered at each node. Essentially, each set of path constraints can be associated with each digraph edge on a given path.
When a suitable path has been determined, the corresponding set of path constraints are used to determine path reachability with a theorem prover. That is, the set of path constraints are the set of classes of inputs that may lead to a memory corruption if they can be proven satisfiable with a theorem prover.
The approach to using symbolic execution to generate logical path constraints and solve the boolean satisfiability of the constraint formula is complete and exhaustive, but it is an NP-complete problem making it infeasible to be able to NP-completely solve all possible cases of satis-fiability [27]. This is because any non-trivial path constraint may consist of so many terms that iterating through every possible assignment for the Boolean variables would never complete. This is part of the state, or path, explosion problem that exists for symbolic execution. Any non-trivial program has an intractable number of execution paths. Because of this, there are many approaches to dealing with path selection as well as slicing portions [28] of the program that will be symbolically executed for analysis. Despite the difficulties of iterating through all possible results, solving such path constraints has been made tractable, in some cases, with the use of theorem provers, such as satisfiability (often abbreviated to SAT) solvers, in a reasonable amount of time1[27, 29].
Existing symbolic execution engines try to take into account external system and library calls made by the binary but their respective implementations are limited by design complexity or scope complexity [30]. Our engine analyzes the system of software that is associated with a binary program. This includes:
• The binary under analysis
• Any dynamic library code used by the program
Below, we describe related work on other program analysis platforms and work done in reducing the problem of state explosion.
BITBLAZE. BitBlaze [23] is a platform of binary analysis tools that combine different ap-proaches of analysis. The platform is made up of three primary components:Vine,TEMU, and
Rudder. Vine is the static analysis component of the platform that raises the binary machine code to an IL. TEMU is a program emulator that performs extensive traces of a program and outputs the trace to a file for later analysis. Rudder is used to provide both concrete and sym-bolic execution capabilities. In order to translate binary code into the IL, a disassembly output is created then passed toVEX, a third party library that is part of the Valgrind dynamic instrumen-tation tool [31]. Finally, the VEX IL output is translated to Vine IL. TEMU is a whole-system emulator based on QEMU [32] and used to instrument a binary for analysis. Rudder performs as a TEMU plugin and performs much of the navigation during binary instrumentation. It de-termines whether instructions should be symbolically or concretely executed, performs path selection at each branch, and encodes the path constraints for SAT solving.
BitBlaze was developed to analyze x86 binaries but work has begun to expand it to other plat-forms with the use of their Vine IL. It has been used academically and in industry to find bugs in binaries.
KLEE. Klee [24] is a symbolic execution platform that was redesigned from another tool origi-nally named EXE [33]. Klee was designed to perform deep checking of applications and max-imize code coverage across diverse classes of programs written in C. Klee is built upon LLVM to help with the symbolic execution of the intermediate representation (IR) of programs under testing. A program considered for testing is compiled into LLVM bytecode, the IL that provides the IR for analysis. Klee then runs on the IR to perform the symbolic execution using STP, an SMT-based constraint solver, [34] for solving path constraints.
Klee has been used both academically and in industry to conduct code coverage [24]. It has also been extended by users and subsequently had some of these extensible features integrated into the Klee core platform.
CODESURFER/X86. CodeSurfer/x86 [35–37] is a platform that utilizes abstract interpretation [38], a generalized case of symbolic execution to recover an IR of an executable. The recovered IR includes CFGs, information about the program’s variables, and data dependencies.
According to the Grammatech website [37], CoderSurfer/x86 is a research prototype and not a commercial product, but is known to be used for academic research.
DART. DART (Directed Automated Random Testing) [39] is a symbolic execution platform that aims to systematically test all feasible paths of a program. One if its key values is the ability to reduce imprecision and computation time in the symbolic execution on an application under
test by using concrete values at branch instructions that are of interest. DART was originally implemented at Bell Labs by Patrice Godefroid.
SAGE. SAGE (Scalable, Automated, Guided Execution) [4, 5] is a platform that uses symbolic execution to perform x86 instruction-level tracing and emulation. The main difference here, and hence why the authors refer to this analysis process as fuzzing, is because it uses a well-formed input as opposed to assuming an unconstrained input. This well-well-formed input is used to derive path constraints as each branch instruction is executed. SAGE is based on DART [39] but optimized for large applications.
SAGE is developed and maintained by Microsoft and is heavily used to find bugs in develop-ment and commercial releases of their software.
PINand DynamoRIO. Pin [40] and DynamoRIO [41] are both tools that allow dynamic binary instrumentation of a piece of software under test. This allows analysts to execute a program and perform transparent analysis. This means that you can, for instance, inject analysis code into a program during runtime execution. The platforms operate on single user-level processes and do not differentiate the runtime execution environment of each respective tool and the program under instrumentation.
Pin and DynamoRIO were both developed under industry and academic collaboration and have been applied to both fields.
VALGRIND. Valgrind [31] is a dynamic binary instrumentation platform, similar to Pin and Dy-namoRIO but is specific to UNIX/Linux variant OS environments, where Pin and DyDy-namoRIO are available for UNIX/Linux and Windows OS environments.
Valgrind has been used in both academic and industry work.
2.4
Computational Complexity Issues
With all these criteria that go into analyzing a binary, it is important to note that the com-putational complexity grows when dealing with the state explosion problem associated with program analysis. In order to provide some context, consider the state space of a program under execution. It is possible, theoretically, to explore all states in order to derive path constraints and check properties in question. In practice, this is realistically unfeasible because of the number of transitions that can occur at each conditional branch instruction. This challenge is known as
the state explosion problem and significantly complicates program analysis [42].
To provide some more context to this problem, imagine looking at a control flow graph of Microsoft’sword.exeexecutable. This binary can be considered fairly complex because of the number of calls to other libraries—we will call them libaries set A—it needs to function as well as other libraries—we will call them libraries set B—thatAmust call. Under evaluation, word.exe can execute hundreds of library calls on top of executing a number of functions in the start up procedure. These functions can lead to branch instructions that can result in a large number of realized transitions. If the program were to theoretically continue generating parallel transitions through its execution lifecycle, we can see that the number of states would expo-nentially increase. If were to attempt to explore each state in either a breadth-first or depth-first manner, we can see this become an intractable task.
Aside from the intractability issue associated with exhaustively exploring the state space of a program, we also need to consider current technology when trying to tackle this problem. Using theword.exeexample above, we also need to consider resources utilized during state ex-ploration. Ifword.exegenerates T number of threads and we are trying to evaluate this program symbolically with C number of processors, we can assume that T/C threads will be mapped onto each processor, assuming each processor receives an equal number of threads. Given a normal producer/consumer relationship among the threads (i.e., the threads can share common process resources), and assuming an amount M of system memory that is allocated per thread, we will require (T*M)/C amount of memory. If we consider C to be a very small number compared to T, and T can continually grow during a program’s execution (i.e., T can theoretically approach in-finite, and C stays finite), then the amount of memory required explodes and also tends towards infinite. This, however, is limited by current technology where the amount of memory can tend towards infinite but is bounded by address space limits. For example, a 32-bit x86 process is bounded by a 4GB process memory address space.
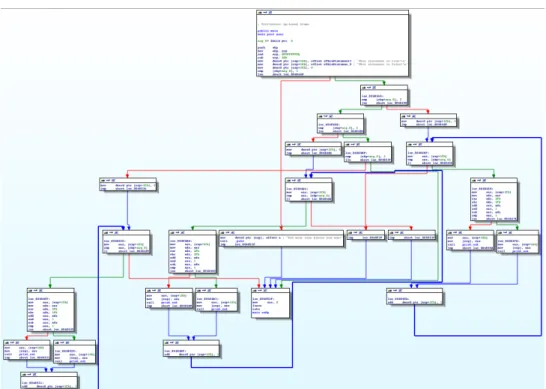
Figure 2.6 shows a simple program visualized by its CFG. It is interesting to note how complex a seemingly simple program can be after it has gone through the compilation process. Appendix A and Appendix B provide the source and disassembly listing from IDA Pro, respectively for further reference.
Figure 2.6: A Functionally Simple Program Visualized by Its CFG (Taken from IDA Pro)
2.4.1
State Explosion Research
Scalability issues illustrated above has been a topic of research for quite some time [43–46] and is an obstacle when dealing with the complexity of program analysis.
The task of complete code coverage in program analysis is realistically impossible as the state space of a program is generally too large to be exhaustively explored. Because of this funda-mental problem, there has been research related to managing and dealing with state explosion that attempts to create precision in code coverage and program slicing [28] to try to reduce the state space when analyzing source code or binaries.
Boonstoppel [47] proposed a technique for detecting and pruning large numbers of redundant paths while analyzing program source using EXE [33], an older variant of the KLEE [24] program analysis platform. The idea is to mark memory locations—that is, taint [1] those locations—during symbolic execution and truncate exploration of paths that are algorithmi-cally determined to produced effects that have been seen before. This dramatialgorithmi-cally reduces the state space since the symbolic execution engine is not revisiting duplicate states and repeatedly executing branch instructions that do not yield interesting results.
Godefroid [42] suggests he notion of state space exploration can be thought as the follow-ing: concurrent executions of branch instructions are partial orders where concurrent “inde-pendence” transitions should be left ordered. He asserts that transitions should be considered independent when the order of executions is irrelevant. Based on that idea, he uses this notion to determine possible “valid” dependency relations for branch executions of a given Labeled Formal Concurrent System (LFCS). Following that, he uses the logic that if a state is reachable by any sequence of transitions in a trace, it is sufficient to only explore one sequence in that trace, thus reducing the amount of state space required to visit during path exploration.
Godefroid and Khurshid [48] implemented a genetic algorithm framework to exploit heuris-tics for guiding search in the state space of concurrent reactive systems to find errors including deadlocks and assertion violations. The reasoning behind this is that a genetic algorithm will ex-ploit heuristics that simulate natural-evolution processes like selection and mutation. Mapping this back to state space exploration, the algorithm measures thefitnessof a path and determine whether that path is fit enough for exploration. Otherwise, a path deemed to be “fitter” for survival (i.e., net more interesting results) will be explored within a selection of branch instruc-tions. This approach appears to outperform random and systematic searches when exploring large state spaces.
Li [49] proposed a context-sensitive relevancy analysis algorithm that uses weighted pushdown model checking to derive memory locations in a program where symbolic values can be in-putted. The resulting output information is then utilized by a code instrumenter to transform relevant segments of a Java program with symbolic constructs. This creates a more precise path of execution by only executing branch instructions that appear to have more contextual rele-vancy to the function of the program.
Godefroid, Holzmann, and Pirottin [50] discussed the problem of storing states in the face of state explosion by describing states derived from branch executions that lead to the same state in subsequent state transitions. By determining those redundant states, and consequently determining that the most reachable states only get visited once during state exploration, the concept of state-space caching during program analysis can become a more viable option to reduce state space exploration and speed up analysis.
Despite all the claims made by academic researchers, Pelanek [51] reported in 2009 that many research papers make unjustified claims about respective techniques that attempt to manage the state explosion problem. Pelanek’s complaint is that the research does not consider realistic
eva-lution scenarios and includes poor experimental standards. As a result, this limits the practical application of the results.
CHAPTER 3:
Symbolic Analysis Framework
When applying program analysis techniques, the primary technical challenge is approaching the analysis of a compiled binary itself and working with the machine code that makes up the binary. It is logical to assume that a typical analyst does not have access to source code for many of the Commercial-Off-the-Shelf (COTS) programs that are run on a computer. For example, a typical analyst would not have access to Microsoft’s source code for the Windows OS or for Microsoft Word. If this analyst were astute enough to try to analyze the Word program binary code, it would quickly become clear to the user that the sheer volume of machine code to sift through would be overwhelming. Malware authors do not simply provide source code to the programs that are being distributed. As alluded to earlier in Chapter 2, malware authors frequently attempt to create countermeasures to program analysis by applying various anti-analysis techniques to raise the cost of time and resources for an analyst or analysis engine to correctly ascertain the behavior and function of the malware binary.
To that end, a symbolic analysis framework offers a logical method for analyzing machine code taken from a binary. Machine code is what the CPU fetches, decodes, and executes, therefore the logical conclusion is machine code will provide the ground truth for tests, evaluations, and applications. The following chapter is dedicated to providing some insight into the architecture of the framework and discuss the goals of the framework.
The architecture for the framework, is a modular and tightly integrated analysis suite. This suite consists of four core pieces:
1. The Core Emulation/Analysis Engine 2. The Algebra Engine
3. The Taint Engine 4. The SAT Solver
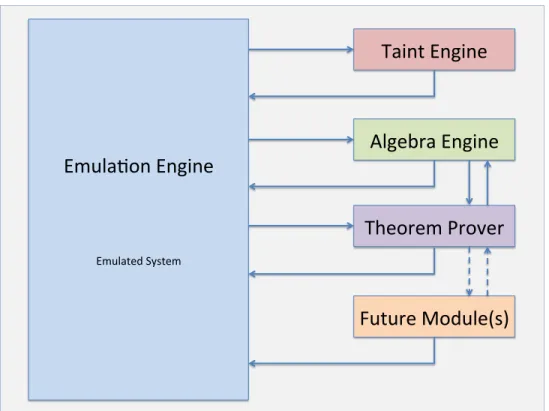
Emula&on Engine
Emulated System
Algebra Engine
Taint Engine
Theorem Prover
Future Module(s)
Figure 3.1: A Notional Diagram of Analysis Framework
3.1
Emulation Engine
The emulation engine of is the brain of the framework. It drives all other functionality and provides the information for the other framework elements to function. Functionally speaking, the emulation engine performs the program-wide symbolic execution, which allows granular monitoring and instrumentation.
The symbolic execution engine is consideredpartial-system because a user space environment exists for binary code to be executed. This includes the provision of a minimal set of OS ser-vices, virtual memory address space, system and application libraries, and even actual applica-tions, allowing us to observe behavior from the application-layer down to the actual machine code being executed. There are several motivating factors that drive this approach:
• Analyzing software, particularly malware, requires introspection at the machine code and instruction level to discern interesting behavior.
• Like COTS virtual machine software, a platform that allows partial-system emulation offers realism for sandboxing during an analysis. In general, virtual environments can be
viewed as native operating environments to garner precise and accurate observations2.
• Like COTS virtual machine software, there is generally good isolation between the anal-ysis environment (sandbox), and the host machine, providing a safer environment to con-duct analyses.
• An environment that allows instrumentation of the binary under test provides an environ-ment conducive to isolating the analysis tools from the binary code under test to guard against interference during analysis or bad results.
• Analyzing binary code, for our purposes, requires software-level introspection to derive accurate and precise results. We need to be able to observe application-level interactions while concurrently observing instruction cycles as the program executes.
• We also require an ability to mark, or taint data—specifically, user-supplied data—and observe how it propagates through an application’s state space.
The emulation engine acts as a virtual machine that has its own CPU, and its own allocated memory. When a 32-bit program is run with the engine, a 4GB virtual address space is mapped for a binary code under test. Associated libraries are mapped and monitored, which is critical for keeping track of how the control flow of a program progresses as the program state is explored. The approach for our symbolic execution is just-in-time execution, where there is no apriori knowledge of the program before execution, and calculations are done as demanded. This idea is taken from the business concept where objectives are met through intelligently signaling differ-ent points of the workflow process to indicate when an evdiffer-ent should occur [52]. The motivation behind this is that we endeavor to create an accurate depiction of how a program would execute on a system. The omniscient view requires apriori knowledge which, in most cases for a given framework, are derived from a disassembly. The problem with disassembly representations were mentioned in Chapter 2; Indeed, the primary concern is the accuracy of the disassembly output. If a program has anti-analysis techniques applied including anti-disassembly techniques, then the disassembly output may not be useful. Given this, we opted to eliminate the dependency on any type of omniscient view of a program for the time being.
During a program’s symbolic execution, each instruction cycle is interpreted by the engine’s CPU and the corresponding operation is performed against the current program state. The fetch-decode-execute cycle is performed by retrieving a program instruction, interpreting the action(s) required by decoding, and then executing the interpreted action(s). Within this process, the
symbolic execution engine will signal other modules to perform analysis operations during each instruction cycle.
3.2
Algebra Engine
The name of the engine is taken from the fact that we are attempting to mathematically compute invariants of binary code under test by calculating the pre- and postconditions of a basic block of instructions. To summarily provide context, a basic block is a sequence of instructions with a single entry point and a single exit point. This means that the first instruction of the basic block denotes the start of the sequence of instructions, there is no jump instruction anywhere into or out of the sequence, and the last instruction of the block denotes the end of the sequence of instructions. When a basic block executes and the first instruction is executed, the rest of the instructions in the sequence must execute exactly once, in the exact order of the sequence. We base the foundation of the algebra engine on the work of Reinbacher and Jörg [53]. Our goal is to build upon the foundations of their paper to accomplish the following objectives:
• Simplify re-calculation for redundant instructions.
• Allow the pausing and resuming of analysis. If a given basic block is already has pre-and postconditions calculated for a given set of inputs, then re-calculating over identical inputs is unnecessary.
• Assist with abstracting up for analysts to see the beginning and end results for a given basic block. This helps avoid “getting lost in the weeds”.
• Help with SAT-based operations to maintain soundness.
The algebra engine will run as a instrumentation tool that is signaled by the execution engine. Using logic built into the emulation engine, it will perform control flow and data flow analysis. Generated results from both the control flow and data flow analyses will be fed to the algebra engine where state will be recorded for each instruction that is retrieved.
Further discussion and exploration of the algebra engine will be discussed in Chapter 4.
3.3
Taint Engine
The taint engine is the framework module that will track and mark input that appears to come from a user. The reasoning behind taint analysis is that any input that comes from user-supplied data and modifies, or has the potential to modify, the flow of execution poses a risk to the binary that is being executed. For instance, a basic stack-based buffer overflow can occur if
user-supplied data is able to write past the end of an allocated data buffer, resulting in the overwrite of a function return address. This can lead to the execution of user-supplied code which can lead to major security risks to the underlying operating system.
Common vulnerabilities such as stack-based buffer overflows, heap overflows, and format string vulnerabilities allow attackers to overwrite critical values in a program such as return addresses or function pointers that should not be derived from user input [54]. Based on such observations, dynamic taint analysis has gained popularity as it allows the tracking of user input and other untrusted data as it flows through a program at runtime and determines whether untrusted data is being used in an unsafe manner [1, 55].
Our taint engine aims to follow the basic taint workflows many other taint analysis frameworks contain:
Taint Tagging The process of defining what sources are untrusted and what should be tagged as tainted. This is determined before binary code execution and is usually associated with registers and program memory. These registers and memory space are initialized as untainted to begin with.
Taint Propagation The process of defining what computations allow the spreading of taint tags and how they propagate through the control flow of a binary code under execution. As an example, assignment operations such asmov, add, sub, or, etc. are x86 instructions that might help propagate tainted data, though there are edge cases where tainted data can be overwritten by untainted data. For example,xor eax, eaxwould result in tainted data residing in registereaxto be zeroed out. Taint propagation runs concurrently with taint checking as each instruction will go through a taint propagation and taint check process. Taint Checking The process where tainted data is being checked to see if it is being misused to
alter program control by identifying “critical” computations or operation. Taint checking and taint propagation run concurrently since each instruction needs to be checked to see if it is unsafe. If an instruction is identified to be unsafe and is about to be executed, the taint status of all operands, registers, and memory are checked. That is, thestateat that instruction is checked for taint. For example, an unconditional jmp instruction may be identified as a critical instruction.
Most taint methods simply track whether a bit in memory or in the general registers is tainted and provide no further information regarding where tainted data comes from. Our method aims to more precisely monitor the source of tainted data, rigorously specify what x86 instructions
should propagate taint, and what instructions need to be monitored for misuse so that we can clearly delineate what values need to be tracked in order to characterize a potential vulnerability.
3.4
The Theorem Prover
The theorem prover is a module that takes path constraints that are derived from the pre- and post-conditions that the algebra engine generates and checks to see if path reachability is possi-ble for a given set of inputs. Essentially, path constraints are a formula of Boolean variapossi-bles that are calculated to see if it evaluates toTRUE(orSAT, short forsatisfied). If the formula is not sat-isfiable, then the evaluation returnsFALSE(orUNSAT, which stands forunsatisfied). The goal here is to determine whether a particular path taken in a program’s execution control flow is ac-tually reachable or not. The results are then provided back to the rest of the framework to derive other information that will further the analysis of binary code under test. One primary question surrounding the reachability of a path concerns the steps taken during symbolic execution to reach that path and what data was supplied during execution to get there. If there is potential for tainted (user-supplied) data to be provided to reach a path of interest, then it is possible to repeatedly generate the path conditions that lead to interesting actions of binary code under test. Current theorem proving tools utilize Boolean Satisfiability (SAT) decision procedures or Satisfiability Modulo Theories (SMT) decision procedures [34, 43, 56].
Theorem proving can also be understood as a decision problem. The Boolean formula is in-putted into the solver which uses an algorithm to determine a “Yes” or “No”. Symbolic exe-cution is complemented by this approach to solving a decision problem from a formal system given how closely related they are. These algorithms, or decision prcedures [57, 58], allow for practical applications in the case of program verification. Most theorem prover decision procedures are based on the DPLL algorithm, developed by Davis, Putnam, Logemann, and Loveland [29, 59]. Contemporary decision procedures take advantage of SMT techniques, since SMT builds on SAT solving techniques and offers a more expressive modeling language using first-order logic [56, 58].
In the context of our framework, the theorem prover will be signaled by the algebra engine to solve a path condition for a basic block where the pre- and postconditions have been calculated by the algebra engine and translated into a model for the theorem prover to work with. Results will be recorded for the symbolic engine to bias itself towards paths that have yet to be explored. Our goal is to provide soundness to the path constraints we calculate in order to determine
reachability and derive a set of path conditions we can use to reconstruct concrete inputs to reach interesting paths of execution and observe program behavior.
CHAPTER 4:
Reasoning Over Native x86
Reasoning over the Intel native x86 instruction set presents a significant challenge but presents some clear advantages. First, we do not have an intermediate language (IL), so we do not deal with the potential for losing information in translation. Intermediate languages are certainly useful as compiler front-ends use them when analyzing a piece of source code that gets passed to the compiler back-end to generate machine code for a given target platform [26]. Traditional approaches to symbolic analysis of binary code leverage aspects of the compilation process by using facets of it to semantically approximate the reasoning of the binary code. In other words, intermediate languages assist in the symbolic analysis process to approximate the decompilation process of the binary code as close as possible to the original source code.
Indeed, researchers in the field gravitate toward ILs because they reduce semantic complexity during analysis. Frameworks such as LLVM [22] have gained tremendous popularity because of their usefulness in the compilation process. ILs have several applications. One example is generating an intermediate representation (IR) of a piece of source code and performing code transformations. This is a critical highlight when discussing interoperability since this means compilers can be used across different OS platforms. By using an intermediate language that is common among different compiler platforms, a piece of source code may have the semantics retained and honored when the back-end compiler produces the machine code for a given target platform.
As mentioned earlier, the advantages of using an IL are accompanied by some disadvantages. The depth level of an IL is critical when dealing with machine dependence. For example, high level ILs are used almost entirely in the earliest stages of the compilation process, or in prepro-cessors before compilation [21]. In some ways, a high level IL can be thought of as a pseudocode representation of source code before the actual source program is written [21]. A medium level IL is generally designed to reflect the range of features in a set of source languages, but in a language-independent manner. They are designed to be good bases for generating efficient ma-chine code for at least one architecture [21]. With languages such as C/C++, medium-level ILs are the de facto standard level since they are appropriate for most of the optimizations done in compilers, such as common-subexpression elimination, code motion, and algebraic simplifica-tion [21]. Low-level ILs often provide a nearly one-to-one mapping to target machine
instruc-tions and can generally be considered architecture-dependent. The IRs derived from low-level ILs allow maximal optimization to be performed on the intermediate code and in the final stages of compilation to either expand intermediate-code instructions into code sequences or to com-bine related ones into more powerful instructions [21]. There exists multi-level intermediate languages that consider a piece of source code and the need to represent it at different levels through the compilation process in order to best transform it into platform-dependent machine code [21]. Regardless of level, intermediate languages are still approximating the semantics of source code to binary code. This can lead to fidelity loss in the precision of expression when trying to simplify the instruction semantics of an architecture such as the Intel ISA.
The expressiveness of an IL is dependent on how extensive its syntax is to express every in-struction. It is generally thought that simplifying seemingly identical instructions makes sense. However, when analyzing binary code such as the Intel instruction set, it is not possible since operations and operands can vary in length, from one to twelve or more bytes. Using an IL to simplify or encompass all movinstructions, for instance, may help abstract away some of the need for precision but, using a catch-all instruction may lead to an over-approximation or im-proper approximation of what may be a completely different instruction [53]. The precision of any IL is subject to this problem. Our goal is to maintain the highest level of fidelity possible when looking at an instruction by maintaining a contextual look at native x86 and do away with an IL.
The types of transformations that can be done using an intermediate language are not as impor-tant for binary code analysis as the expressiveness or the depth level of the IL, but it is imporimpor-tant to understand how compiler ILs perform transformations to understand why they can dilute the fidelity of binary code. IL transformation algorithms consider the depth level and the expression syntax that are part of the language design. The transformation described generally tend toward the simplification of the source as it is being translated into machine code or the optimization of the aforementioned code by reducing the complexity. For example, a level of optimization may determine that converting certain arithmetic loop operations may be more efficient by either converting the loop into a long sequence thereby eliminating the loop, converting the arithmetic operation itself into another operation, or both. By the time the machine code has been gen-erated, much of the code may not resemble the actual source code. If we were to analyze this same optimized binary code, and translate it back into an intermediate language fit for analysis, the semantics of this code would further have to be simplified, which could lead to a dilution of fidelity. As it is, binary code analysis is difficult enough without having to work with lossy
results. To that end, we maintain that an intermediate language is not a desirable “extra” step we want to take when performing analysis something like malware, for example.
4.1
Developing Reasoning Over x86 Architecture
To begin developing the algebra we need to reason over the x86 instruction set, it needs to be understood that there are different levels ofprogram context we are trying to develop. Program context is the representation of our state at different levels during execution and is the container for all of our analysis information. Taking inspiration from Fahringer and Scholz [60], we need to define what ourprogram context is and how the different levels of context tie together. We want to develop context at three levels:
1. At each instruction 2. At each basic block
3. Through the entire program during execution
We now need to understand how path conditions propagate in accordance with the x86 archi-tecture and become path constraints. We understand that path constraint derivation will largely be a product of our program context but will also require understanding the behavior of key assembly-level operations and the mnemonics of the Intel ISA.
In this thesis, we limit our discussion to the following instruction categories:
• Branching
• Flag Setting
• Arithmetic
• Logic
• Data Transfer
These instruction categories represent a base of common instructions that are regularly encoun-tered for OS and library call operations.
Instruction categories that are considered outside the scope of this thesis include the following:
• Floating Point
• MMX
4.2
Establishing Semantics
Based on work by Reinbacher and Tseitin [53, 62], we begin with establishing the semantics that will be used to derive our program context. Following this, we will apply these semantics to a single line instruction, then lift these techniques up to a basic block level, and then finally use the pre- and postconditions we have generated to describe the state of a program at a given point in the program.
We have several ingredients that we will use to derive our instruction-level program contextS, based on [60]. We can define the program state as the following:
• The 32-bit address space a running process is allocated. This includes: – Addressable memory locations
• The set of registers: – eax
– ebx – ecx – edx – edi – esi – esp – ebp – eip
• The set of segment registers that hold 16-bit selectors: – cs
– ds – ss – es – fs – gs
• The 32-bit EFLAGS register (holds status flags): – OF(bit 11)—Overflow Flag
– SF(bit 7)—Sign Flag – ZF(bit 6)—Zero Flag – AF(bit 4)—Adjust Flag
– PC(bit 2)—Parity Flag – CF(bit 0)—Carry Flag
• Static Single Assignment (SSA) Form Variables [21, 63]
The SSA variables have the property that each variable is assigned exactly once during the anal-ysis of a program. This provides the advantage of being able to distinctly verify every variable that is created during analysis. Since there is no variable reuse, it is possible to determine which variables were used during a back or forward trace of an execution path [21, 53].
Next, we will formulate the algebra that mathematically describes instruction state, basic block state, and program state.
4.2.1
Instruction Encoding
With the established semantics, we can proceed to transform each instruction, based on work by Reinbacher and Tseitin [53, 58, 62].
Definition: Instruction Encoding
A single instruction encoding is described as a mnemonicM followed by its one or two operands.
[[Mβ[,α] ]] := (Smem_addr\ {β})∪ {β0} = n−1
^
i=0
operationmem_addr (4.1)
where:
• Smem_addr is the set that describes the program context upon entrance of the instruc-tion.
• α andβ are operands.β can be considered thedestinationandα can be considered
thesourceto stay consistent with Intel-style semantics.
• (Smem_addr\ {β})∪ {β0}is the set difference subtracting β from the set and adding β0to the set. This describes the derived program state as a result of the instruction’s
operation.
• V
represents the conjunction of Tseitin-encoded clauses.
• iis the bit counter.
• nrepresents the number of bits for the operand.
• operationmem_addr is the instruction operation that is derived from the Intel ISA.
Figure 4.1: Instruction Encoding Definition
arbitrary memory address, say,0xbffffdc0, we would express it as follows:
[[ADD a,b]] := (S0xb f f f f dc0\ {a})∪ {a0} =
n−1
^
i=0
a0 ↔ a+b
(4.2)
wherea’is the result upon exit of the completed instruction.
Single operand expressions, such as anincoperation, over an arbitrary valuecat some memory location (we will re-use0xbffffdc0) can be expressed as follows:
[[INC c]] := (S0xb f f f f dc0\ {c})∪ {c0} =
n−1
^
i=0
c0 ↔ c+1
(4.3)
For bitwise operations, such as anxoroperation at memory location bffffdc0, we would ex-press it as follows:
[[XOR d,e]] := (S0xb f f f f dc0\ {d})∪ {d0} =
n−1
^
i=0
d0[i] ↔ d[i] ⊕ e[i]
(4.4)
Similar instruction encodings can be derived for the entire Intel ISA. As each instruction is encoded in this set and bitwise fashion, we can extend it to the basic block level by constructing a basic block formula φ that is a conjunction of all the instruction contexts within that given
block. This can be generically represented as follows:
4.2.2
Basic Block Encoding
Consider a generic basic block ofninstructions. We can say that the resulting output from an instructionIiis stateSi+1that will be used as input to instructionIi+1. Figure 4.2 describes this
calculation process:
Equations (4.5) and (4.6) describe how to mathematically describe basic block state with respect to the instructions contained in a basic block.
This can be elaborated further by showing the set operations between each instruction as shown in Figure 4.4.
I0= [[M0β0,α0]] =S1
I1= [[M1β1,α1]] =S2
I2= [[M2β2,α2]] =S3
.. .
In−1= [[Mn−1βn−1,αn−1]] =Sn=ψbb
Figure 4.2: Generic Basic Block of n Instructions
Definition: Basic Block Encoding
The resulting state derived by the nth instruction operation provides the final state for the basic block indicated bySmem_addrand can be written as the following sequence:
ψbb=
n−1
^
i=0
[[Miβi,αi]] (4.5)
where:
• V
denotes a sequence of instruction that results in the final state computed from the nthinstruction,In−1.
• The computation to deriveSi+1is derived from Equation (4.1). and can be re-written with the set operation from Equation (4.1) as follows:
ψbb=
n−1
^
i=0
(Si\ {βi})∪ {β0i} (4.6)
Figure 4.3: Basic Block Encoding Definition
I0= [[M0β0,α0]]:= (S0\ {β0})∪ {β00}=S1
I1= [[M1β1,α1]]:= (S1\ {β1})∪ {β01}=S2
I2= [[M2β2,α2]]:= (S2\ {β2})∪ {β02}=S3
.. .
In−1= [[Mn−1βn−1,αn−1]]:= (Sn−1\ {βn−1})∪ {β0n−1}=Sn =ψbb
4.2.3
Program Path Encoding
Raising our semantics up to the program level presents issues we must now strongly consider. One of the primary concerns is how to maintain state at instructions that create branching. When a program branches, there are at least two paths that the program can take during execution. For example, consider Figure 4.5
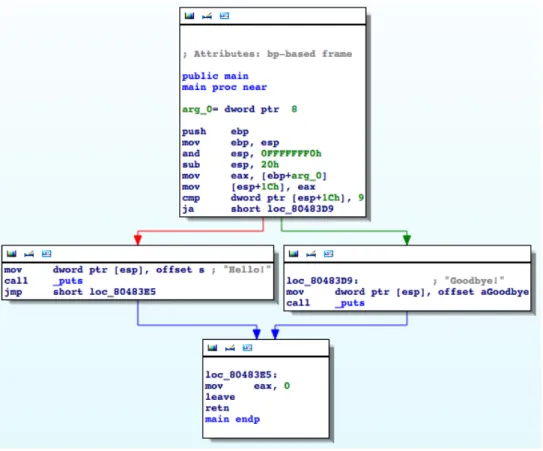
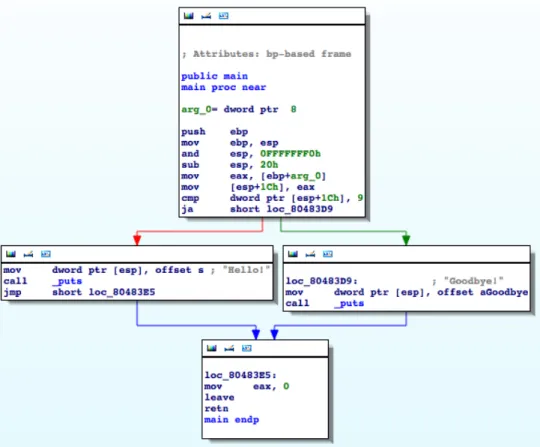
Figure 4.5: A Simple C Program with Branching (Taken from IDA Pro)
For a particular pathp0, the values contained in our program state will change and be different from the state that they will be inp1. Using the example above, we can see that in order for the program to print out “Hello!”, the user-supplied input must contain between 0 and 8 arguments, since the name of the program being executed is also part of the argument vector, which adds 1 argument. The program outputs “Goodbye” for any other argument count (anything that is not between 0 and 9 total arguments).
Up until the state reaches the instruction 0x080483c9: ja short lo_80483D9, our basic block state—and our program state up to this point of ‘execution—will be a result from the out-put derived from not the compare instruction,0x080483c4: cmp dword ptr [esp+1Ch], 9,