© 2006 Biometrika Trust
Printed in Great Britain
Adaptive linear step-up procedures that control the false
discovery rate
B YOAV BENJAMINI
Department of Statistics and Operations Research, T he Sackler Faculty of Exact Sciences, T el University, T el Aviv, Israel
ABBA M. KRIEGER
Department of Statistics, T he W harton School of the University of Pennsylvania, Philadelphia, Pennsylvania 19104, U.S.A.
DANIEL YEKUTIELI
Department of Statistics and Operations Research, T he Sackler Faculty of Exact Sciences, T el University, T el Aviv, Israel
S
The linear step-up multiple testing procedure controls the false discovery rate at the desired level q for independent and positively dependent test statistics. When all null hypotheses are true, and the test statistics are independent and continuous, the bound is sharp. When some of the null hypotheses are not true, the procedure is conservative by a factor which is the proportionm
0/mof the true null hypotheses among the hypotheses.
We provide a new two-stage procedure in which the linear step-up procedure is used in stage one to estimate m
0, providing a new level q∞ which is used in the linear step-up
procedure in the second stage. We prove that a general form of the two-stage procedure controls the false discovery rate at the desired levelq. This framework enables us to study analytically the properties of other procedures that exist in the literature. A simulation study is presented that shows that two-stage adaptive procedures improve in power over the original procedure, mainly because they provide tighter control of the false discovery rate. We further study the performance of the current suggestions, some variations of the procedures, and previous suggestions, in the case where the test statistics are positively dependent, a case for which the original procedure controls the false discovery rate. In the setting studied here the newly proposed two-stage procedure is the only one that controls the false discovery rate. The procedures are illustrated with two examples of biological importance.
Some key words: False discovery rate; Multiple testing; Two-stage procedure.
1. I
The traditional concern when testing m hypotheses simultaneously is to control the familywise error rate, the probability of making any false discovery. The restrictiveness of
the familywise error rate criterion leads to multiple testing procedures that are not powerful in the sense that the probability of rejecting null hypotheses that are false must also be small. At the other extreme lies the strategy of ignoring the multiplicity issue altogether, and testing each hypothesis at level a. This is a popular approach which increases the probability of rejecting null hypotheses that are false, but ignores the increased expected number of type I errors.
The false discovery rate criterion was developed by Benjamini & Hochberg (1995) to bridge these two extremes. The false discovery rate is the expectation of the proportion of rejected true null hypotheses among the rejected hypotheses. When the null hypothesis is true for all hypotheses, the false discovery rate and familywise error rate criteria are equivalent. However, when there are some hypotheses for which the null hypotheses are false, a procedure that controls the false discovery rate may reject many more such hypotheses at the expense of a small proportion of erroneous rejections.
The linear step-up procedure, or so-called Benjamini & Hochberg procedure, controls the false discovery rate at a desired level qm
0/m when the test statistics are independent
(Benjamini & Hochberg, 1995) or positively dependent (Benjamini & Yekutieli, 2001). Even though this procedure rejects false null hypotheses more frequently than procedures that control the familywise error rate, if we knew m
0 the procedure could be improved
by using q∞=qm/m
0, to achieve precisely the desired level q. In this paper we develop
and compare some adaptive false discovery rate controlling procedures that begin by estimating m
0. In § 2, we recall the formal definition of the false discovery rate criterion,
the linear step-up procedure, and review the background for the problem at hand.
2. B 2·1. T he false discovery rate LetH
0i(i=1, . . . , m)be the tested null hypotheses. Fori=1, . . . , m0the null hypotheses
are true, and for the remaining m
1=m−m0 the null hypotheses are false. Let V denote
the number of true null hypotheses that are erroneously rejected and let R be the total number of hypotheses that are rejected. Now define the proportion of false discoveries by Q=V /RifR>0 andQ=0ifR=0. The false discovery rate is=E(Q)(Benjamini & Hochberg, 1995).
A few recent papers have illuminated the false discovery rate from different points of view, namely asymptotic, Bayesian, empirical Bayes, as the limit of empirical processes and in the context of penalised model selection; see Efron et al. (2001), Storey (2002), Genovese & Wasserman (2004) and Abramovich et al. (2006). Some of the studies emphasised variants of the false discovery rate, such as its conditional value given that some discovery is made (Storey, 2002), or the distribution of the proportion of false discoveries itself (Genovese & Wasserman, 2004). Procedures were developed for specific settings (Troendle, 1999), and the applicability of existing procedures have been studied; see for example Sarkar (2002).
The linear step-up procedure makes use of the m p-values, P=(P
1, . . . , Pm). Let
p
(1)∏. . .∏p(m) be their ordered observed values.
D 1(T he one-stage linear step-up procedure) Step 1. L et k=max{i : p
(i)∏iq/m}.
Step 2. If such a k exists, reject the k hypotheses associated with p
(1), . . . , p(k); otherwise
Benjamini & Hochberg (2000) provide a detailed historical review. For the purpose of practical interpretation and flexibility in use, as well as for comparison with other approaches, the results of the linear step-up procedure can also be reported in terms of the -adjusted p-values. Formally, the -adjusted p-value of H
(i) is
p(i)LSU=min{mp
(j)/ j|ji}. Thus the linear step-up procedure at level q is equivalent to
rejecting all hypotheses whose -adjustedp-value is at mostq.
The linear step-up procedure is quite striking in its ability to control the false discovery rate under independence at precisely qm
0/m, regardless of the distributions of the test
statistics corresponding to false null hypotheses, when the distributions under the simple null hypotheses are continuous.
Benjamini & Yekutieli (2001) studied the procedure under dependence. For some type of positive dependence they showed that the above remains an upper bound. Even under the most general dependence structure, where the false discovery rate is controlled merely at levelq(1+1/2+1/3+. . .+1/m), it is again conservative by the same factorm
0/m.
2·2. T he role of m
0in testing
Knowledge ofm
0 can therefore be very useful for improving upon the performance of
the controlling procedure. If m
0 were given to us by an ‘oracle’, the linear step-up
procedure with q∞=qm/m
0would control the false discovery rate at precisely the desired
level q in the independent and continuous case, and would then be more powerful in rejecting hypotheses for which the alternative holds. In a well-defined asymptotic context, Genovese & Wasserman (2002) showed it to be the best possible procedure in that it minimises the expected proportion of the hypotheses for which the alternatives hold among the nonrejected ones, minimising the false nondiscovery rate.
The factor m
0/m plays a role in other settings as well. It is a ‘correct’ prior for a
full Bayesian analysis (Storey, 2002, 2003). Estimating this factor is also an important ingredient in the empirical Bayes approach to multiplicity (Efron et al., 2001).
Even when we are controlling the familywise error rate in the frequentist approach, knowledge of m
0 is useful. Using a/m0 is a more powerful procedure than the standard
Bonferroni, which usesa/m, yet also controls the familywise error rate. Holm’s procedure and Hochberg’s procedure have been similarly modified by Hochberg & Benjamini (1990) to construct more powerful versions. It is thus interesting to note that estimation of m
0
from the data is needed from the points of view of different schools of thought. Moreover, estimating m
0becomes easier as more parameters are tested.
3. A
Adaptive procedures first estimate the number of null hypothesesm
0, and then use this
estimate to revise a multiple test procedure. The following adaptive approach is based on the linear step-up procedure.
D 2(Generalised adaptive linear step-up procedure) Step 1. Compute m@
0.
Step 2. If m@
0=0 reject all hypotheses; otherwise, test the hypotheses using the linear
step-up procedure at level qm/m@
0.
Schweder & Spjøtvoll (1982) were the first to try to estimatem
0, albeit informally, from
the quantile plot of the p-values versus their ranks. This plot will tend to show linear behaviour for the larger p-values which are more likely to correspond to true null
hypotheses. Thus one can inspect the plot and choose the largestk p-values for which the behaviour seems linear, and estimate the slope of the line passing through them. Its reciprocal was used as an estimate of m
0, rejecting the hypotheses corresponding to the
m−m
0 smallest p-values. Hochberg & Benjamini (1990) formalised the approach and
incorporated the estimate into the various procedures that control the familywise error rate.
Benjamini & Hochberg (2000) incorporated their proposed estimator for m
0 into the
generalised adaptive linear step-up procedure as follows.
D 3 (T he adaptive linear step-up procedure of Benjamini & Hochberg)
Step 1. Use the linear step-up procedure at level q, and if no hypothesis is rejected stop; otherwise, proceed.
Step 2. Estimate m
0(k) by (m+1−k)/(1−p(k)).
Step 3. Starting with k=2 stop when for the first time m
0(k)>m0(k−1).
Step 4. Estimate m@
0=min{m0(k), m} rounding up to the next highest integer.
Step 5. Use the linear step-up procedure with q*=qm/m@
0.
The choice in Step 2 was justified as follows. Let r(a)=#{p
(i)∏a}. Then m−r(a) is
potentially the number of true null hypotheses except that m
0a true null hypotheses are
expected to be among ther(a)rejected. Hence, solvingm
0jm−{r(a)−m0a}form0yields
m
0j{m−r(a)}/(1−a). Usea=p(k)to obtain approximately m0(k).
The adaptive procedure was shown by simulation to provide tighter control of the false discovery rate than the linear step-up procedure. Not surprisingly, the simulation also showed it to be much more powerful (Benjamini & Hochberg, 2000; Hsueh et al., 2003; Black, 2004). It is of interest to note that this adaptive procedure was the original -controlling procedure suggested by Y. Benjamini and Y. Hochberg in an unpublished Tel Aviv University technical report. Later the authors used the conservative bound of 1 for the m
0/m factor, which enabled the proof of the -controlling property of the linear
step-up procedure.
An estimator of the above form evaluated at a single prespecifiedaquantile ofp-values P
(i), wherei=am, is easier to study. Such an estimator form0 is mentioned in passing in
Efron et al. (2001) and goes back to earlier versions of Storey (2002), although their interest in the estimator was for different purposes. Using an estimate such as the median of the {p
(i)}, loosely denoted byp(m/2)within the linear step-up procedure, we obtain the
following procedure.
D 4(Median adaptive linear step-up procedure) Step 1. Estimate m
0 by m@0=(m−m/2)/(1−p(m/2)).
Step 2. Use the linear step-up procedure with q*=qm/m@
0.
For estimatingm
0, Storey (2002) and Storey & Tibshirani (2003a) recommended using
a fixeda,lin their notation, such asa=1
2in the above. This yields the following procedure.
D 5(T he adaptive linear step-up procedure with Storey’s estimator) Step 1. L et r(l)=#{p
(i)∏l}.
Step 2. Estimate m
0 by m@0={m−r(l)}/(1−l).
Step 3. Use the linear step-up procedure with q*=qm/m@
0.
The above procedure, and the special case withl=1
2, are also incorporated in recent
estimated by resampling. Subsequently, in Storey et al. (2004), the above procedure was modified by replacing {m−r(l)} by {m+1−r(l)} and further requiring that p
(i)∏l for
a hypothesis to be rejected. These modifications stemmed from theoretical results in their paper, in that they ensure -control in problems where a finite number of hypotheses are tested.
Mosig et al. (2001) suggested a procedure involving an iterated stopping rule which uses the number of p-values falling within some arbitrary cell boundaries over the range (0, 1). The motivation is correct and similar in spirit to the above, but the procedure as published is far from controlling the false discovery rate at the desired level; see § 6.
Other computer-intensive adaptive procedures based on resampling and bootstrapping have also been suggested; see Yekutieli & Benjamini (1999), the resampling-based choice oflin Storey (2002) and Storey et al. (2004) and the cubic spline fit in Storey & Tibshirani (2003a).
4. T - The idea underlying the two-stage procedure is that the value of m
0 can be estimated
from the results of the one-stage procedure.
D 6(T he two-stage linear step-up procedure, )
Step 1. Use the linear step-up procedure at level q∞=q/(1+q). L et r
1 be the number of
rejected hypotheses. If r
1=0 do not reject any hypothesis and stop; if r1=m reject all m
hypotheses and stop; otherwise continue. Step 2. L et m@
0=(m−r1).
Step 3. Use the linear step-up procedure with q*=q∞m/m@
0.
The procedure can be motivated as follows. By definitionm
0∏m−(R−V ).The linear
step-up procedure used in the first stage ensures that E(V /R)∏qm
0/m, so that V is
approximately less than or equal to qm
0R/m. Hence,m0∏m−(R−qm0R/m), from which
we obtain
m
0∏
m−R 1−(R/m)q∏
m−R
1−q ∏(m−R)(1+q). (1)
The right-most bound is the one implicitly used in the above procedure. In § 5 it is proven that this two-stage procedure has a false discovery rate that does not exceedqfor independent test statistics.
This two-stage procedure uses the number rejected at the first stage to estimatem
0, it
controls the false discovery rate and it necessarily increases power. Hence, we may extend this approach using m−r
2 at the third stage, and so on. In the multiple-stage linear
step-up procedure, the steps of the two-stage linear step-up procedure are repeated as long as more hypotheses are rejected. This procedure can also be expressed in an elegant way using the sequence of constants ql/(m+1−j) at each stage. However, using (1+q) in the denominator does not suffice, since the effective level used is q*=qj/(m+1−j), which may be bigger than q. This suggests inflating the cut-offs to
q
q1+qj/(m+1−j )
r
lm+1−j (2)
D 7 (T he multiple-stage linear step-up procedure) Step 1. L et k=max{i : for all j∏i there exists lj so that p
(l)∏ql/{m+1−j(1−q)}}.
Step 2. If such a k exists, reject the k hypotheses associated with p
(1), . . . , p(k); otherwise
reject no hypothesis.
The last procedure has an interesting internal-consistency property. The number of hypotheses tested minus the number rejected, less the proportion q erroneously rejected, is also the number used in the denominator of the linear step-up procedure as the estimator of m
0. A simpler, more conservative procedure enjoying the same property is to require
l=j in the above definition, resulting in a multiple-stage step-down procedure.
5. A
In this section we derive an expression for the upper bound of the false discovery rate of the generalised adaptive linear step-up procedure for independently distributed test statistics. The distributions of the test statistics may be discrete, in which case the distributions of thep-values under the null hypotheses should be stochastically larger than uniform as usual. The estimatorm@
0ofm0 is assumed to be an increasing function of each
of the components of P.
It was shown in Benjamini & Yekutieli (2001) that the false discovery rate of any multiple comparison procedure can be expressed as
= ∑m0
i=1
∑m
k=1
1
kpr{k hypotheses are rejected one of which isH0i}
=m
0 ∑ m k=1
1
kpr{khypotheses are rejected one of which isH01}.
The second equality follows as the problem is exchangeable in thep-values corresponding to them
0true null hypotheses. LetP01be thep-value associated withH01. Note that there
must be at least one hypothesis that is null, that is m
01 because otherwise =0.
Let P(1) be the vector ofp-values corresponding to the m−1 hypotheses excludingH
01.
Conditioning on P(1) we can express as
=m
0EP(1)Q(P(1)), (3)
whereQ(P(1)) is defined by
Q(P(1))= ∑m
k=1
1
kprP01|P(1){khypotheses are rejected one of which isH01}. For each value of P(1), let r(P
01) denote the number of hypotheses that are rejected, as a
function of P
01, and let i(P01) be the indicator that H01 is rejected as a function of P01.
Then
Q(P(1))=E
q
i(P01) r(P01)
|P(1)
r
=P
i( p)where, by the assumed independence, we can take m
01 to be the marginal distribution
of P
01. In the continuous case, m01 is just the uniform distribution on [0, 1] and, in the
discrete case, it is necessarily stochastically larger than the uniform.
We make two claims, first thatr( p)is a nonincreasing function, and secondly thati( p) takes the form 1
[0,p*], where p*¬p*(P(1)) satisfiesp*∏qr( p*)/m@0( p*). If these claims are
true, then
Q(P(1))=
P
i( p)r( p)dm01( p)∏ p* r( p*)∏
q m@
0( p*)
. (4)
This follows immediately because pr(P
01∏p*)∏p*. The bound on follows, in the
form
∏qE
P(1)
q
m0
m@
0( p*)
r
. (5)
To prove the claims, note that, for anyP(1) and a P
01 such thati(P01)=1, that isH01
is rejected, there are exactly r(P
01) p-values below qr(P01)/m@0(P01), and for any k>r(P01)
there are strictly fewer than k p-values below qk/m@
0(P01), because otherwiser(P01) would
be larger by construction. Sincem@
0(P01) is increasing inP01, asP01increases all the critical
values qk/m@
0(P01) decrease; hence, the number of p-values below eachqk/m@0(P01) cannot
increase. It follows thatr(P
01) cannot increase, which proves the first claim. For the second
claim, note that i(P
01)=1 as long as P01∏qr(P01)/m@0(P01).
To prove control of the false discovery rate for a generalised adaptive linear step-up procedure we need to evaluate the right-hand side of (5), which is an expectation over m−1 p-values, m
1 of which are generated according to the distribution of alternative
hypothesis p-values and m
0−1 are independent and identically distributed Un[0, 1].
Since m@
0 is stochastically larger as p-values have stochastically larger distributions, the
right-hand side of (5) is maximised when the m
1 p-values corresponding to H1i are all
zero with probability one. It is interesting to note that, although setting these p-values to 0 maximises the bound in (5), this does not necessarily lead to the maximum value of
in (3).
We will derive bounds for the false discovery rates of some of the two-stage procedures discussed earlier. The following is necessary in this regard.
L1. If Y~Bi(k−1, p) then E{1/(Y+1)}<1/(kp). Proof.Elementary calculations give
E{1/(Y+1)}= 1
kp{1−(1−p)k}∏ 1
kp. %
T 1. W hen the test statistics are independent the two-stage procedure controls the false discovery rate at level q.
Proof.Recall that, in a two-stage procedure, the first stage is a linear step-up procedure at level q∞¬q/(1+q), r
1 is the number of hypotheses rejected at stage 1, and m@0 equals
m−r
1. Then m@0 can only be one of two values m@0(0) or m@0(1). For P01∏r1q∞/m, H01
is rejected at both stages of the two-stage procedure, and m@
0=m@0(0). For P01>r1q∞/m,
H
P
01∏r(P01)q∞/m@0(1), H01 is rejected at the second stage, and thus m@0( p*)=m@0(1) and,
according to (4),
Q(P(1))∏ q∞ m@
0(1)
. (6)
There is just one anomaly. If m@
0(1)=m then for P01>r1q∞/m the second stage of the
testing procedure is identical to the first stage; thus H
01 is no longer rejected and
m@
0( p*)=m@0(0). However, note that, asp*=r1q∞/mandr1∏r( p*), from the first inequality
in (4) we have
Q(P(1))∏ p* r( p*)∏
r
1q∞/m
r
1
=q∞ m=
q∞ m@
0(1)
.
Hence inequality (6) is still satisfied. Asm@
0(1) is stochastically larger thanY+1, whereY~Bi{m0−1, 1−q/(q+1)}, ifq is
replaced with q∞=q/(q+1)in Lemma 1, inequality (6) yields
∏m
0EP(1)Q(P(1))∏
q 1+qEP(1)
m
0
Y+1∏ q 1+q
m
0
m
0{1/(1+q)}
=q. %
A proof of the above was given in D. Yekutieli’s 2002 Ph.D. thesis from Tel Aviv University. The quantile-based estimator of m
0 is m@0=(m+1−k)/(1−P(k)) for an
arbitraryk (1∏k∏m). This is the estimator used in the adaptive linear step-up procedure of Benjamini & Hochberg, albeit at a prespecified quantile. Using this estimator in the generalised adaptive linear step-up procedure leads to the following theorem.
T 2. W hen the test statistics are independent the quantile adaptive linear step-up procedure controls the false discovery rate at level q.
Proof.Ifk∏m
1then according to (5) the false discovery rate of this two-stage procedure
is
∏E
P(1)
qm
0
(m+1−k)/(1−P
(k))
∏ qm0
(m
0+1)
E
P(1)(1−P(k))∏q.
Assume now that m
1<k. We will first compute the expected value of 1/m@0(0). Since
P
01=0, in addition to P01 there arek−1 p-values less thanP(k). The number of true null
p-values less than or equal to P
(k), not counting P01, is at least k−m1−1. Hence the
distribution of P
(k) is stochastically greater than the k−m1−1 ordered p-values out of
m
0−1 p-values that are independent Un[0, 1). Therefore, withP01=0,
E
P(1)P(k)∏
(k−m
1−1)+1
(m
0−1)+1
=k−m1
m 0 . Thus E P(1) 1 m@ 0(0)
∏
A
1−k−m1 m0
BN
(m+1−k)<1/m
0.
Finally, as m@( p*)m@
0(0), returning to (5) we have ∏E
P(1) qm
0
m@
0(0)
As an illustration we consider an upper bound for the adaptive linear step-up procedure with Storey’s estimator. The definition ofm@
0in Storey (2002) ism@0={m−r(l)}/(1−l)=
#{P
i>l}/(1−l). In this case, asP01varies, there are two distinct values of m@0:
m@
0=
q
#{P(1)>l}/(1−l), ifP
01∏l,
(#{P(1)>l}+1)/(1−l), ifP
01>l.
When used within a generalised adaptive linear step-up procedure, ifp*∏l, thenm@
0( p*)
is stochastically greater than W /(1−l), where W is Bi(m
0−1, 1−l). This causes a
technical problem, asE{1/m@
0( p*)} is infinite because there is a nonzero probability, albeit
very small for large m, that W is zero.
In Storey et al. (2004) two modifications were suggested to the original definition ofm@
0
when used in testing. First, no hypothesis is rejected with p-value>l. Secondly, m@
0 is
modified to (#{P
i>l}+1)/(1−l).With the second modification, (5) and Lemma 1 imply
that
∏ qm0
m
0(1−l)/(1−l)
=q. (7)
Remark 1. Lemma 1 showed that E{1/(Y+1)}={1−(1−p)k}/kp, where in our case k=m
0 and p=1−l. Substituting this result instead of its bound into (5) yields ∏(1−lm0)q, which agrees with the bound in Storey et al. (2004).
Remark 2. For illustration, we computed the bounds on for the original version based on the above analysis in two cases. For q=0·05 and l=0·05, in which case the conditionml/{q(1−l)} holds for allm, we obtain the following bounds: whenm=20,
∏0·054; whenm=100,∏0·051; and, whenm=500,∏0·05. Forq=0·05 and
l=0·5, the results are as follows: whenm=20,∏0·075; whenm=100, ∏0·058; and, when m=500, ∏0·052. Thus, in this case, as long as m is in the hundreds the modifications are essential.
6. S 6·1. T he procedures to be compared
A simulation study was performed to compare the-control and the power of various adaptive procedures for controlling the familywise error rate and the false discovery rate. The seven procedures that were investigated in some detail can be roughly divided into two types, namely newly suggested adaptive procedures, numbered 1–3 below, and previously suggested adaptive -controlling procedures, numbered 4–7 below. Three other procedures, numbered 8–10, serve as benchmarks for comparing performance.
Procedure 1.The two-stage linear step-up procedure, denoted by in the tables; see Definition 6. By Theorem 1, this procedure controls the false discovery rate at level q.
Procedure 2. The modified two-stage procedure, denoted by -. This procedure makes use ofqin stage 1, andq∞=q(1+q)in stage 2. Even though the proof requires the use ofq/(1+q) at both stages, we explore this procedure as well since it is more natural to useq at the first stage.
Procedure 3. The multiple-stage linear step-up procedure, denoted by ; see Definition 7.
Procedure 4. The adaptive linear step-up procedure of Benjamini & Hochberg (2000), denoted by ; see Definition 3.
Procedure 5.The adaptive linear step-up procedure with Storey’s estimator, denoted by
-; see Definition 5 with l=1 2.
Procedure 6.The adaptive linear step-up procedure as modified in Storey et al. (2004), denoted by --.
Procedure 7.The median adaptive linear step-up procedure, denoted by -. Procedure 8. The adaptive Hochberg procedure of Hochberg & Benjamini (1990), denoted by-. This adaptive step-up procedure is designed to control the familywise error rate.
Procedure 9. The linear step-up procedure, denoted by ; see Definition 1. This nonadaptive procedure controls the false discovery rate at levelm
0/m.
Procedure 10.The linear step-up procedure at level qm/m
0, denoted by.
The ‘Oracle’ procedure, number 10 above, which usesm
0/mto control the false discovery
rate at the exact level q, is obviously not implementable in practice as m
0 is unknown. It
serves as a benchmark against which other procedures can be compared. It also serves as a variance-reduction method in the simulation study under independence: a large reduction in variance is achieved by comparing the estimated difference in false discovery rates achieved by the procedure in question and that of procedure 10 to zero.
In the first part of the study, the number of testsmwas set atm=4, 8, 16, 32, 64, 128, 256 and 512. The fraction of the false null hypotheses was 0%, 25%, 50%, 75% and 100%. The P-values were generated in the following way. First, let, Z
0, Z1, . . . , Zm be
independent and identically distributed N(0, 1). Next, let Y
i=√rZ0+√(1−r)Zi−mi,
for i=1, . . . , m, and let P
i=1−W(Yi). We used r=0, 0·1, 0·25, 0·5 and 0·75, withr=0
corresponding to independence. The values of m
i are zero for i=1, . . . , m0, the m0
hypotheses that are null. In one case, we let m
i=5 for i=m0+1, . . . ,m. This leads to
P
ij0 for hypotheses that are not null; this is referred to as the ‘all at 5’ case. In the second
case, the value of m
i was mi=i for i=1, 2, 3, 4. This cycle was repeated to produce the
desiredm
1values underH1. This is referred to as the ‘1 2 3 4’ configuration. The resulting
p-values underH
1are clearly less extreme than those in the first case.
We also tested a few more procedures. The multiple-stage step-down procedure, a variation on Procedure 3, showed performance very similar in terms of -control and was, as expected, slightly less powerful. The advantage of the step-down version is that only the extremep-values are needed. The procedure of Mosig et al. (2001) did not control the false discovery rate at the desired level, the false discovery rate often exceeding 0·5. However, a slight modification of this procedure is similar to a modification of the procedure and performed similarly. The modified two-stage Procedure 2 is very similar to Procedure 1. It has the advantage that it is run at the first stage at level q. However, it can happen that at the first stage a hypothesis is rejected and at the second stage it is not. This is rare, and occurs only for large mand m
0 close tom.
The simulation results are based on 10 000 replications. The standard error of the estimated false discovery rate is of the order of 0·002 for all the procedures. As mentioned above, the standard error of the performance of a procedure relative to that of the Oracle
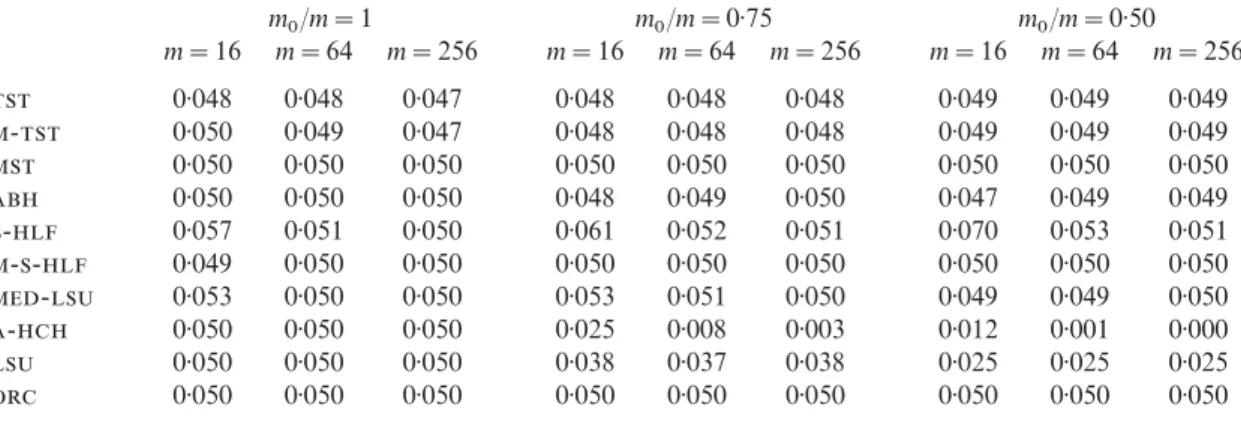
Table 1: Simulation study with independent test statistics. Estimated values of for selected values m
0 and m. T he value for the Oracle is set at its expected value 0·05, and the
others are estimated from the diVerences. T he standard errors are less than 0·002 in all cases m
0/m=1 m0/m=0·75 m0/m=0·50 m=16 m=64 m=256 m=16 m=64 m=256 m=16 m=64 m=256
0·048 0·048 0·047 0·048 0·048 0·048 0·049 0·049 0·049
- 0·050 0·049 0·047 0·048 0·048 0·048 0·049 0·049 0·049
0·050 0·050 0·050 0·050 0·050 0·050 0·050 0·050 0·050
0·050 0·050 0·050 0·048 0·049 0·050 0·047 0·049 0·049
- 0·057 0·051 0·050 0·061 0·052 0·051 0·070 0·053 0·051
-- 0·049 0·050 0·050 0·050 0·050 0·050 0·050 0·050 0·050
- 0·053 0·050 0·050 0·053 0·051 0·050 0·049 0·049 0·050
- 0·050 0·050 0·050 0·025 0·008 0·003 0·012 0·001 0·000
0·050 0·050 0·050 0·038 0·037 0·038 0·025 0·025 0·025
0·050 0·050 0·050 0·050 0·050 0·050 0·050 0·050 0·050
is even smaller. In Table 1 we used the fact that the expectation of the false discovery rate is exactly 0·05 to estimate the false discovery rate for the other procedures from the difference.
6·2. Independent test statistics
The results of the -control under independence for the 10 procedures were higher for the ‘all at 5’ case than for the ‘1 2 3 4’ case described above. Results are given in Table 1 for some of the configurations. Note that all procedures except-and-control the false discovery rate at levels very close to yet below 0·05 at all configurations. The results for the stated two are above 0·05 for smaller m. The modification in Storey et al. (2004) solves the problem for -. In both cases the values are very close to the theoretical upper bounds derived in § 5. The fact that the level of false discovery rate approaches 0·05 as mincreases supports the theoretical result in Genovese & Wasserman (2004) that, asymptotically in m, it controls the false discovery rate.
For the- procedure the overshoot is smaller and it decreases faster. Bym=64 it is within simulation-noise level. The source of this problem is the fact that - uses (m−k) in the numerator, while the theorem that the false discovery rate is controlled is for the estimator with (m+1−k). The ratio of the two decreases as m increases. It is important to emphasise that, in the three procedures-, --and-, unlike in the other two-stage procedures, there is no restriction that m@
0∏m. It is important
not to add such a requirement in the implementation step, because it will harm the
-controlling properties. In the other procedures m@
0cannot exceedm.
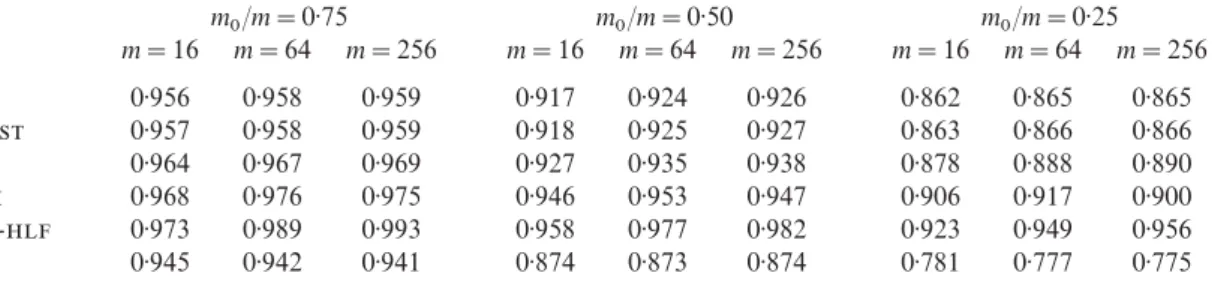
Power comparisons are made at the more realistic configuration of ‘1 2 3 4’; see Table 2. The results are only reported for the procedures that control the false discovery rate. The power of each procedure is divided by the power for the oracle to yield an efficiency-like figure. For example, consider the configuration with m
0=32 and m=64,
where all procedures control the false discovery rate. The regular linear step-up has power of 0·873, and all-controlling adaptive procedures raise the power to within the range of 0·924 to 0·977. It is clearly worth the extra effort to take the second stage in the two-stage procedure whenm
0/mis as large as12. Table 2 shows that-- is most powerful
in all situations. When m
Table 2: Simulation study with independent test statistics. Power relative to the Oracle procedure for selected values of m
0 and m
m
0/m=0·75 m0/m=0·50 m0/m=0·25 m=16 m=64 m=256 m=16 m=64 m=256 m=16 m=64 m=256
0·956 0·958 0·959 0·917 0·924 0·926 0·862 0·865 0·865
- 0·957 0·958 0·959 0·918 0·925 0·927 0·863 0·866 0·866
0·964 0·967 0·969 0·927 0·935 0·938 0·878 0·888 0·890
0·968 0·976 0·975 0·946 0·953 0·947 0·906 0·917 0·900
-- 0·973 0·989 0·993 0·958 0·977 0·982 0·923 0·949 0·956
0·945 0·942 0·941 0·874 0·873 0·874 0·781 0·777 0·775
false and m increases takes second place. In summary, the real gain seems to be in using a two-stage procedure. Which of these two-stage procedures one uses is of lesser significance.
6·3. Positively dependent test statistics Ifm
0is known, the linear step-up procedure controls the false discovery rate even under
positive dependence, as expressed in Benjamini & Yekutieli (2001). Furthermore, if m
0is
estimated independently of the p-values used in, if for example it is estimated from a different sample, then, by simply conditioning, we have that ∏qE(m
0/m@0). Thus if
E(m
0/m@0)∏1 the two-stage procedure controls the false discovery rate.
To see how the bias and variance ofm@
0affectsE(m0/m@0) a straightforward Taylor series
expression yields E(m
0/m@0)=1−bias/m0+bias2/m20+variance/m20.From this we can see
that, if the bias is positive, then that helps to meet the condition E(m
0/m@0)∏1. If the bias
is negligible, then the variance of the estimator plays a key role. For independent tests, the variance of the estimator is of order m
0 so that the variance term goes to zero. For
dependent tests, the variance can also be of orderm2
0,in which case the size of the variance
can have a large effect. When the estimate of m
0 is independent of the p-values, even when the p-values
themselves are dependent, the above argument led to an inequality, which implied that it is sufficient to show that E(m
0/m@0)∏1 in order to obtain control of the false discovery
rate. Once the same set of dependent p-values is used in both stages, two issues arise: the inequality on the bound might not hold, and furthermoreE(Q|m@
0)∏(m/a)(m0q/m)=m0q/a
need not hold. It is difficult to study analytically the combined effect that may cause the false discovery rate of the two-stage procedure to be higher than expected, and we therefore resort to a simulation study.
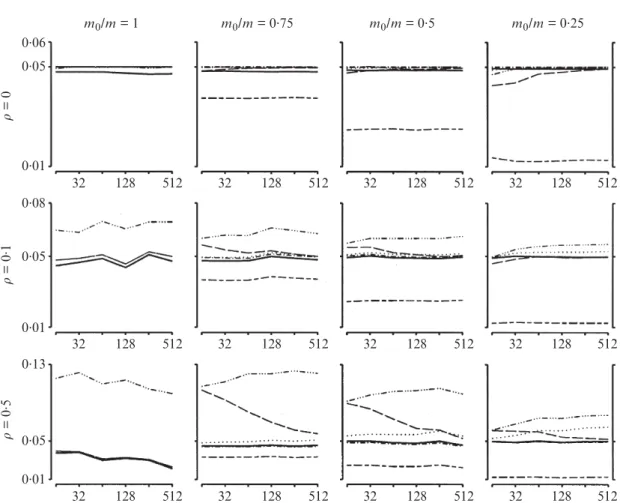
The simulation study allows us to explore the effect of constant positive dependence between the test statistics on the level of the false discovery rate achieved by the adaptive procedures. Figure 1 presents these results for r=0·1 and 0·5 in comparison to r=0. Obviously the Oracle and do control the false discovery rate, as follows from the theory in Benjamini & Yekutieli (2001), even though now at a level that is too low. The two-stage procedures control the false discovery rate well, below but close to the nominal level. All other procedures fail. The procedure controls the false discovery rate when the correlation is low, but fails at higher correlations. The-procedure does better when m becomes larger. The value for the -- procedure is sometimes more than twice the declared false discovery rate.
0.06 0.05
0.01 0.08 0.05
0.01 0.13
0.05 0.01
r
= 0
r
= 0
. 1
r
= 0
. 5
32 128 512 32 128 512
32 128 512
32 128 512
32 128 512
32 128 512
32 128 512
32 128 512
32 128 512
32 128 512 32 128 512
32 128 512
m0/m = 1 m0/m = 0.75 m0/m = 0.5 m0/m = 0.25
Fig. 1: Simulation study. Estimated values for m=16, . . . , 512 and r=0, 0·1, and 0·5. Results for procedure, solid line;, dotted line;, dotted-dashed;, dashed;--, dashed triple-dotted;
, short-dash long-dash.
Since many applications of the false discovery rate and theoretical results involve a large number of tests, simulations were also conducted for m=5000, 10 000 and 15 000. The p-values were generated in the same way except that the values of mwere chosen to be 5i/(m−m
0) for i=1, . . . , m−m0. In addition, the values 0, 0·01, 0·05 and 0·10 were
used for the fraction of false null hypotheses. The results that appear in Fig. 2 indicate that it does not seem that the false discovery rate level gets closer to 0·05 as m increases for the -- procedure.
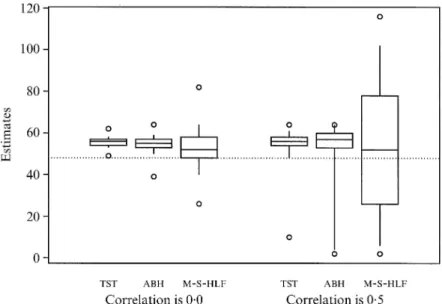
How can this difference be explained? Figure 3 presents the distribution of the estimators of m
0 that are used in the procedure, and -- procedures, both under
independence and underr=0·5. The figure shows that variability for-- relative to that for either or is only about two in the independence case. In the dependent case, however, this ratio increases to about ten; note that the biases are comparable. This results in--overshooting the nominal 0·05 false discovery rate level even for largem, stabilising at a level of 0·08, as is evident from Fig. 2. Note from Fig. 3 that more than a quarter of m
0 estimates obtained by -- are above the maximal possible value of
m=64. Thus the deviation from the desired false discovery rate will be even greater if in practice min(m@
r
= 0
r
= 0
. 1
r
= 0
. 25 0.06
0.05
0.04 0.08
0.05 0.04
0.09
0.05 0.03
5000 10000 15000
5000 10000 15000
5000 10000 15000
5000 10000 15000
5000 10000 15000
5000 10000 15000
5000 10000 15000
5000 10000 15000
5000 10000 15000 5000 10000 15000 5000 10000 15000 5000 10000 15000
m0/m = 1 m0/m = 0.99 m0/m = 0.95 m0/m = 0.9
Fig. 2: Simulation study. Estimatedvalues form=5000, 10 000 and 15 000 andr=0, 0·1 and 0·25. results for procedure , solid line; , dotted line; , dotted-dashed; , dashed; --,
dashed triple-dotted;, short-dash long-dash.
Fig. 3: The simulated distribution of the estimators m@
0 used in the ,
and-- adaptive procedures for estimating the number of true
hypotheses with independent and positively correlated statistics for the case ofm
0=48 andm=64. Each box displays the median and quartiles as usual. The whiskers extend to the 5% and the 95% quantiles. The circles are located
7. E
Example 1: Multiple endpoints analysis.Multiple endpoints analysis in clinical trials is one of the most commonly encountered multiplicity problems in medical research. This example on multiple endpoints illustrates the various procedures and shows the increased number of rejections when m
0 is estimated and accounted for as in our procedure. Since
the data represent multiple measurements on the same individual, an individual’s innate level can be viewed as latent. The assumption of constant positive dependence is arguably plausible, at least approximately. For the specific multiple problem described in detail in Benjamini & Hochberg (1995), the significance of the treatment effect on each of the 15 endpoints is given by the ordered p
(i)’s: 0·0001, 0·0004, 0·0019, 0·0095, 0·0201, 0·0278,
0·0298, 0·0344, 0·0459, 0·3240, 0·4262, 0·5719, 0·6528, 0·7590 and 1·000. Four hypotheses were rejected using the single linear step-up procedure at level 0·05. Four were also rejected at the first stage of the two-stage procedure run at level 0·05/1·05. At the second stage the linear step-up procedure is used at level (0·05/1·05)×15/(15−4)=0·06494, resulting in the rejection of the eight hypotheses whosep-values are less than or equal to 0·0344.
The multiple-stage procedure continues with the linear step-up procedure at level 0·0893, which is obtained from 0·0515/{15+1−8(1−0·05)}. In this case, the ninth hypothesis withp-value of 0·0459∏0·0893×9
15is also rejected. Interestingly all hypotheses
with p-values less than 0·05 were rejected, as if no correction had been made.
Another interesting observation is that all adaptive procedures considered here rejected either 8 or 9 hypotheses; the procedures , and - resulted in 9 rejections. However, since positive dependence may be present among the measured endpoints, taking the more conservative finding of the two-stage procedure is recommended.
Example 2: Quantitative trait loci analysis using false discovery rate.Genetic researchers considered control of the false discovery rate in this important biological area (Weller et al., 1998), and Mosig et al. (2001) pioneered the use of adaptive procedures in the context of quantitative trait loci analysis of milk production in cattle, although without considering analysis of this particular example (Mosig et al., 2001). However, they did not consider the theoretical properties of their procedure. The purpose of their analysis is to identify regions on the chromosomes containing genes which affect the level of some quantitative property of the milk that a cow produces, such as volume, fat content or protein content. This kind of analysis is based on testing the statistical linkage between genetic markers on the chromosomes and the quantity of interest. Since molecular genetic markers can now be identified on a very dense map, the issue of multiple testing and its increased type I error probabilty is of fundamental concern. Lander & Kruglyak (1995) discuss this issue and set out guidelines that emphasise the genome-wise control of the familywise error rate, and Benjamini & Yekutieli (2005) established the appropriateness of the linear step-up procedure for this purpose. Their result relies on the positive regression dependence structure within chromosomes, inherent in the genetic problem.
Using the linear step-up procedure on single-site data, Mosig et al. (2001) identified 34 markers, out of a total number of 138, to be significant at the 0·05 level of false discovery rate. Using their original adaptive two-stage procedure they identified 8 additional significant markers. However, as was shown here, this procedure need not control the false discovery rate.
With the new two-stage procedure, the same 34 markers were rejected at the first stage at the 0·05/1·05 level. At the second stage the linear step-up procedure is used at level
q*=0·05
1·05×138104=0·063. This increase identified a total of 37 markers, that is more than 34,
but fewer than the 42 found by Mosig et al. (2001). 8. D
Benjamini & Hochberg (2000) state, regarding adaptive procedures, that ‘in cases where most of the hypotheses are far from being true there is hardly any penalty due to the simultaneous testing of many hypotheses’. As carefully analysed and explained by Black (2004), introducing the adaptive component into the linear step-up procedure is also the reason for the power advantage of the direct approach to false discovery rate of Storey et al. (2004). It is demonstrated here that the differences in power among the various adaptive procedures are much smaller than the differences among all adaptive procedures and the linear step-up procedure. Adaptive procedures that control familywise error have even less power. Of course these advantages are not realised when m
0/m is close to 1.
The results of the simulation study raise interesting issues. Some procedures are more sensitive to the nature of the correlation structure, equal positive correlations that we impose in our simulation study, and other approaches, most notably our new procedure, seem to perform well even in the correlated case. In practice, tests tend to be correlated. Understanding how different procedures that perform equally well for independent tests behave in correlated environments that reflect important applications is critical, but remains to be investigated.
A
This research was partly supported by the Focal Initiatives in Research Science and Technology foundation of the Israeli Academy of Sciences and Humanities, and by a grant from the U.S. National Institutes of Health. We would like to thank the referees for their helpful suggestions.
R
A,F.,B,Y.,D,D.&J,I.M.(2006). Adapting to unknown sparsity by controlling the false discovery rate.Ann. Statist.34, 584–653.
B,Y.&H,Y.(1995). Controlling the false discovery rate: a practical and powerful approach to multiple testing.J. R. Statist. Soc.B57, 289–300.
B,Y.&H,Y.(2000). On the adaptive control of the false discovery rate in multiple testing with independent statistics.J. Behav. Educ. Statist.25, 60–83.
B, Y. & Y, D.(2001). The control of the false discovery rate in multiple testing under dependency.Ann. Statist.29, 1165–88.
B,Y.&Y,D.(2005). The false discovery rate approach to quantitative trait loci analysis.
Genetics171, 783–9.
B,M.A.(2004). A note on the adaptive control of false discovery rates.J. R. Statist. Soc.B66, 297–304. E,B.,T,R.J.,S,J.D.&T,V.(2001). Empirical Bayes analysis of a microarray
experiment.J. Am. Statist. Assoc.96, 1151–60.
G,C.&W,L.(2002). Operating characteristics and extensions of the false discovery rate procedure.J. R. Statist. Soc.B64, 499–517.
G,C.&W,L.(2004). A stochastic process approach to false discovery control.Ann. Statist.
32, 1035–61.
H, Y.&B,Y.(1990). More powerful procedures for multiple significance testing.Statist. Med.9, 811–8.
H,H.,C,J.J.&K,R.L.(2003). Comparison of methods for estimating the number of true null hypotheses in multiplicity testing.J. Biopharm. Statist.13, 675–89.
L,E.S.&K,L.(1995). Genetic dissection of complex traits: guidelines for interpreting and reporting linkage results.Nature Genet.11, 241–7.
M,M.O.,L,E.,K,G.,T,E., S,M.&F, A.A.(2001). Whole genome scan for quantitative trait loci affecting milk protein percentage in Israeli-Holstein cattle, by means of selective milk DNA pooling in a daughter design, using an adjusted false discovery rate criterion.Genetics157, 1683–98.
S,S.(2002). Some results on false discovery rate in stepwise multiple testing procedures.Ann. Statist.
30, 239–57.
S,T.&S,E.(1982). Plots ofp-values to evaluate many tests simultaneously.Biometrika
69, 493–502.
S,J.D.(2002). A direct approach to false discovery rates.J. R. Statist. Soc.B64, 479–98.
S,J.D.(2003). The positive false discovery rate: a Bayesian interpretation and theq-value.Ann. Statist.
31, 2013–35.
S,J.D.&T,R.(2003a). Statistical significance for genome-wide studies.Proc. Nat. Acad. Sci.
100, 9440–5.
S,J.D.&T,R.(2003b). SAM thresholding and false discovery rates for detecting differential gene expression in DNA microarrays. In T he Analysis of Gene Expression Data: Methods and Software, Ed. G. Parmigiani, E. S. Garrett, R. A. Irizarry and S. L. Zeger, pp. 272–90. New York: Springer. S, J.D., T, J.E. & S, D.(2004). Strong control, conservative point estimation, and
simultaneous conservative consistency of false discovery rates: A unifield approach. J. R. Statist. Soc.
B66, 187–205.
T,J.(1999). A permutational step-up method for testing multiple outcomes.J. Statist. Plan. Infer.
84, 139–58.
W,J.I.,S,J.Z.,H,D.W.,L,H.A.&R,M.(1998). A new approach to the problem of multiple comparisons in the genetic dissection of complex traits.Genetics150, 1699–706.
Y, D. & B, Y. (1999). Resampling based false discovery rate controlling procedure for dependent test statistics.J. Statist. Plan. Infer.82, 171–96.