Procedia Engineering 154 ( 2016 ) 1225 – 1230
1877-7058 © 2016 The Authors. Published by Elsevier Ltd. This is an open access article under the CC BY-NC-ND license (http://creativecommons.org/licenses/by-nc-nd/4.0/).
Peer-review under responsibility of the organizing committee of HIC 2016 doi: 10.1016/j.proeng.2016.07.439
ScienceDirect
12th International Conference on Hydroinformatics, HIC 2016
River Stage Forecasting Using Wavelet Packet Decomposition and
Data-driven Models
Youngmin Seo
a, Sungwon Kim
b*
aDepartment of Constructional Environmental Engineering, Kyungpook National University, Sangju, 37224, South Korea bDepartment of Railroad and Civil Engineering, Dongyang University, Yeongju, 36040, South Korea
Abstract
This study develops and applies hybrid models combining wavelet packet decomposition and data-driven models for forecasting river stage and investigating their accuracy. The hybrid models are wavelet packet-based artificial neural network (WPANN) and wavelet packet-based adaptive neuro-fuzzy inference system (WPANFIS). Wavelet packet decomposition splits an input time series into approximation and detail components, and the decomposed time series are used as inputs to artificial neural network (ANN) and adaptive neuro-fuzzy inference system (ANFIS) for WPANN and WPANFIS models, respectively. The forecasting performances of WPANN and WPANFIS models are compared with those of ANN and ANFIS models. Based on performance evaluation indexes and graphical comparison, the WPANN and WPANFIS models produce better performance than ANN and ANFIS models in terms of model efficiency, and WPANFIS-coif18 model is also found to yield the best performance among all other models. Therefore, wavelet packet decomposition improves the accuracy of ANN and ANFIS models for forecasting river stage. The results indicate that river stage forecasting models combining wavelet packet decomposition and data-driven models can be used as an effective tool for forecasting river stage accuracy.
© 2016 The Authors. Published by Elsevier Ltd.
Peer-review under responsibility of the organizing committee of HIC 2016.
Keywords: River stage forecasting; Wavelet packet decomposition; Artificial neural network; Adaptive neuro-fuzzy inference system
1. Introduction
The reliable forecasting of river stage is essential for enhancing reservoir operation, water supply, flood prevention and water resources management. Over the past year, data-driven models, including artificial neural network (ANN) and adaptive neuro-fuzzy inference system (ANFIS), have been applied as effective tools for modelling complex and nonlinear hydrologic systems [1, 2, 3, 4, 5, 6]. Although ANN and ANFIS have been widely applied for forecasting hydrological variables, they have also some problems when dealing with non-stationary data [7]. Since hydrological time series includes several frequency components and has nonlinear relationships, various hybrid model approaches [3, 5, 6, 8, 9, 10, 11, 12, 13] have been developed and applied to improve the performance of model forecasting [14]. Especially, the conjunction of wavelet decomposition and data-driven models has been successfully implemented in hydrological applications [14, 15, 16, 17, 18].
Wavelet decomposition is a mathematical technique used to analyse signals by decomposing them into various frequencies,
* Corresponding author. Tel.: +82-54-630-1241; fax: +82-54-637-8027.
E-mail address: [email protected]
© 2016 The Authors. Published by Elsevier Ltd. This is an open access article under the CC BY-NC-ND license (http://creativecommons.org/licenses/by-nc-nd/4.0/).
while wavelet packet decomposition (WPD) is a special wavelet transform where the original signal passes through more filters than wavelet decomposition [19]. In discrete wavelet transform (DWT), decomposition in each decomposition level is implemented by passing the previous approximation coefficients through high and low pass filters. However, in the WPD, both detail and approximation coefficients are decomposed in each level. The WPD is a generalization of wavelet decomposition that offers a richer range of possibilities for signal analysis and allows the best matched analysis to a signal [20]. The WPD can achieve a better frequency resolution from the decomposed signal, and mine much more features about the signal. Therefore, the WPD provides better check of frequency resolution and more features about signal than wavelet decomposition [21].
This study develops and applies two different hybrid models, wavelet packet-based artificial neural network (WPANN) and wavelet packet-based adaptive neuro-fuzzy inference system (WPANFIS), to improve model performance for forecasting river stage in the Gam Stream Watershed, South Korea. Performance measures are employed to evaluate the accuracy of the developed models. The performance of WPANN and WPANFIS models is compared with that of ANN and ANFIS models.
2. Materials and methods 2.1. Used data
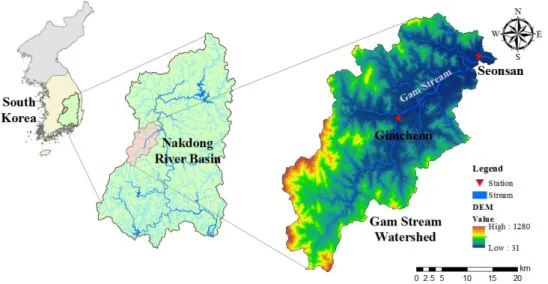
Daily river stage data of two streamflow gauging stations, Gimcheon and Seonsan, were collected from the observation archives of Water Management Information System (WAMIS), which is operated by the Ministry of Land, Infrastructure and Transport (MOLIT), South Korea. Figure 1 shows the locations of streamflow gauging stations. The collected data were prepared for the period between 2000 and 2012. The data were then divided into two parts, data of the first ten years for model training and the remaining three years data for model testing.
Fig. 1. Study region and locations of observations
2.2. Artificial neural network (ANN)
ANN is a parallel computing system which was originally developed based on the structure and functional aspects of biological neural networks. Feed-forward ANN comprises a system of units, analogous to neurons, which are arranged in layers [22]. Multilayer perceptron (MLP) is the most popular neural network architecture which is typically composed of several layers of nodes. The first layer is an input layer where external information is received. The last layer is an output layer where the problem solution is obtained. The input and output layers are separated by one or more intermediate layers called hidden layers. The nodes in adjacent layers are usually fully connected by acyclic arcs from an input layer to an output layers [23]. MLP with a hidden layer and J hidden neurons calculates the following function (1) [24].
0 0 0 0 1 1 1 ( ) J n J T j j ij i j j j j i j o f w¨§ w f w§¨ w x·¸¸· f w§¨ w f w ·¸ © ¹ ©¦
¦
¹ ©¦
¹ x w x (1)where w0=the intercept of the output neuron, w0j=the intercept of the jth hidden neuron, wj=the synaptic weight corresponding to the synapse starting at the jth hidden neuron and leading to the output neuron, wj=(w1j, …, wnj) is the vector of all synaptic weights corresponding to the synapses leading to the jth hidden neuron, and x=(x1, …, xn) is the vector of all covariants. The weights are obtained by backpropagation algorithm and training data.
2.3. Adaptive neuro-fuzzy inference system (ANFIS)
ANFIS is a neural network implementation of a Takagi-Sugeno fuzzy inference system. ANFIS uses the Takagi-Sugeno model on the consequent part of fuzzy IF-THEN rules. ANFIS applies the hybrid algorithm, which integrates backpropagation and least square estimation algorithm, so it has rapid learning speed [25]. ANFIS architecture consists of two processes, forward and backward stages. The forward stage has five layers as follows:
x Layer 1: The fuzzification process using membership function, x Layer 2: The inference stage using t-norm operator,
x Layer 3: Calculating the ratio of the strengths of rules, x Layer 4: Calculating the consequent parameters,
x Layer 5: Calculating overall output as the sum of all incoming signals.
The backward stage is a process of parameter learning. In this stage, the least squares method is used to obtain the parameters, which are coefficients of linear equations on the consequent part, and mean and variance on the antecedent part.
The outputs of layers are calculated by the following equations (2)-(7) [26].
1,i Ai( ), 1, 2, O M x i (2) 2 1,i Bi ( ) 3 , 4 O M y i (3) 2,i i Ai( ) Bi( ), 1, 2, O w M xM y i (4) 3, 1 2 , 1, 2, i i i w O w i ww (5) 4,i i i i( i i i), 1, 2, O w f w p x q y r i (6) 2 2 1 5, 2 1 1 i i i i i i i i i w f O w f w
¦
¦
¦
(7)where Oj,i is output associated with node i in layer j,Ai and Bi-2 are linguistic labels (e.g, LOW or HIGH) associated with node i
in layer 1, ijAand ijB are the Gaussian membership functions (MFs) for A and B,x and y are inputs to node i, and [pi,qi,ri] is the parameter set.
2.4. Wavelet packet decomposition (WPD)
Wavelet decomposition is a mathematical technique which transforms a signal to spectral data in both time and frequency. WPD is a generalization of wavelet decomposition. Wavelet decomposition splits a signal into an approximation and a detail in the first decomposition level. The approximation is then split into the second level of approximation and detail, and the process is repeated. Since the wavelet decomposition splits only the approximation at each level, the results of frequency resolution in higher-level decomposition are less desirable. It may cause problems during applying wavelet decomposition in applications where important information is located in higher frequency components. The frequency resolution of decomposition filter may not be fine enough to extract necessary information from the decomposed component of the signal [27]. On the other hand, the WPD splits the approximation as well as the detail in each level. The major difference between wavelet decomposition and WPD is that WPD splits both approximations and details. Therefore, WPD provides a richer range of possibilities for signal analysis and allows the best matched analysis to a signal [20].
3. Results and discussion
The selection of significant input variables is one of the most important steps in the development process of ANN and ANFIS models. This study determined the maximum lag-time for the input variables of ANN and ANFIS models based on cross
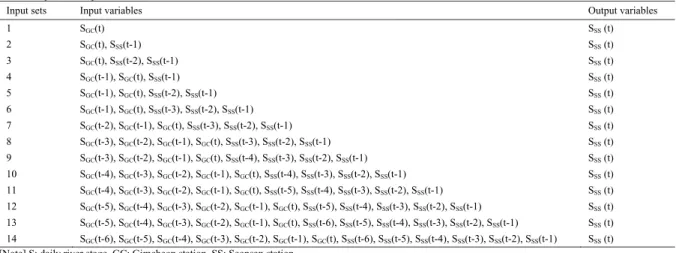
correlation function (CCF), autocorrelation function (ACF) and partial autocorrelation function (PACF) between the variables. Table 1 shows input and output variables for model configuration.
Table 1. Input and output variables
Input sets Input variables Output variables
1 SGC(t) SSS (t) 2 SGC(t), SSS(t-1) SSS (t) 3 SGC(t), SSS(t-2), SSS(t-1) SSS (t) 4 SGC(t-1), SGC(t), SSS(t-1) SSS (t) 5 SGC(t-1), SGC(t), SSS(t-2), SSS(t-1) SSS (t) 6 SGC(t-1), SGC(t), SSS(t-3), SSS(t-2), SSS(t-1) SSS (t) 7 SGC(t-2), SGC(t-1), SGC(t), SSS(t-3), SSS(t-2), SSS(t-1) SSS (t) 8 SGC(t-3), SGC(t-2), SGC(t-1), SGC(t), SSS(t-3), SSS(t-2), SSS(t-1) SSS (t) 9 SGC(t-3), SGC(t-2), SGC(t-1), SGC(t), SSS(t-4), SSS(t-3), SSS(t-2), SSS(t-1) SSS (t) 10 SGC(t-4), SGC(t-3), SGC(t-2), SGC(t-1), SGC(t), SSS(t-4), SSS(t-3), SSS(t-2), SSS(t-1) SSS (t) 11 SGC(t-4), SGC(t-3), SGC(t-2), SGC(t-1), SGC(t), SSS(t-5), SSS(t-4), SSS(t-3), SSS(t-2), SSS(t-1) SSS (t) 12 SGC(t-5), SGC(t-4), SGC(t-3), SGC(t-2), SGC(t-1), SGC(t), SSS(t-5), SSS(t-4), SSS(t-3), SSS(t-2), SSS(t-1) SSS (t) 13 SGC(t-5), SGC(t-4), SGC(t-3), SGC(t-2), SGC(t-1), SGC(t), SSS(t-6), SSS(t-5), SSS(t-4), SSS(t-3), SSS(t-2), SSS(t-1) SSS (t) 14 SGC(t-6), SGC(t-5), SGC(t-4), SGC(t-3), SGC(t-2), SGC(t-1), SGC(t), SSS(t-6), SSS(t-5), SSS(t-4), SSS(t-3), SSS(t-2), SSS(t-1) SSS (t)
[Note] S: daily river stage, GC: Gimcheon station, SS: Seonsan station
The input data were decomposed by WPD to develop and apply WPANN and WPANFIS models. The optimal decomposition level should be selected in advance to determine the performance of the models in the wavelet domain. In this study, the decomposition level was determined using the following empirical equation (8) [28].
int[log( )]
L N (8)
where L=the decomposition level, N=the number of time series data, and int[ͼ]=the integer-part function. In this study, three decomposition levels were obtained. Input times series were decomposed using different mother wavelets, including Haar wavelet (db1), Daubechies-2 (db2), Daubechies-4 (db4), Daubechies-6 (db6), Daubechies-8 (db8), Duabechies-10 (db10), Symmlet-2 (sym2), Symmlet-4 (sym4), Symmlet-8 (sym8), Symmlet-10 (sym10), Coiflet-6 (coif6), Coiflet-12 (coif12) and Coiflet-18 (coif18).
In this study, the performance of river stage forecasting models was evaluated using performance indexes, including the coefficient of efficiency (CE), the index of agreement (d), the coefficient of determination (r2), the root mean squared error
(RMSE), the mean absolute error (MAE), the mean squared error (MSE), the mean squared relative error (MSRE) and the mean higher order error (MS4E).
Table 2 summarizes the value of performance measures for the models. It can be seen from Table 2 that ANFIS model has higher CE, d and r2 values and lower RMSE, MAE, MSE and MSRE than those of ANN model. These indicate that the ANFIS
model produces better performance than the ANN model, based on performance evaluation indexes. It can be also seen from Table 2 that WPANN-sym10 and WPANFIS-coif18 models have higher CE, d and r2 values and lower RMSE, MSE, MSRE and
MS4E than those of the ANN and ANFIS models. The WPANFIS-coif18 model has the highest CE, d and r2 values and the
lowest RMSE, MAE, MSE, MSRE and MS4E values. These indicate that the WPANN-sym10 and WPANFIS-coif18 models yield better performance than the ANN and ANFIS models, and the WPANFIS-coif18 model produces the best performance among all models, based on performance evaluation indexes.
Table 2. Performance evaluation
Models CE d r2 RMSE MAE MSE MSRE
(106)
MS4E
(104) Remarks
ANN 0.9556 0.9886 0.9631 0.0846 0.0546 0.0072 6.6152 12.301 Input set 11
ANFIS 0.9623 0.9907 0.9638 0.0780 0.0306 0.0061 5.5400 22.000 Input set 14
WPANN-sym10 0.9776 0.9943 0.9885 0.0601 0.0467 0.0036 3.4059 0.5624 Input set 11
WPANFIS-coif18 0.9990 0.9998 0.9990 0.0124 0.0062 0.0002 0.1390 0.0050 Input set 14
Figure 2 shows scatter plots of the optimal models given in table 2 for the testing period. Standard deviations around the y=x line (blue line) for WPANN-sym10 and WPANFIS-coif18 models are lower than those for ANN and ANFIS models. The points of scatter plot for the WPANFIS-coif18 model are the closest around the line. That is, standard deviation around the line for WPANFIS model is the lowest among all models. It is clear from the figures that the forecasted values of the WPANN-sym10 and WANFIS-coif18 models are closer to the corresponding observed values than those of the ANN and ANFIS models. From the figures, it can be said that the wavelet packet decomposition can significantly improve the efficiency of the ANN and ANFIS
models for forecasting daily river stages. Especially, the WPANFIS-coif18 model is found to be more accurate than the other models.
(a) ANN (input set 11) (b) ANFIS (input set 14)
(a) WPANN-sym10 (input set 11) (b) WPANFIS-coif18 (input set 14) Fig. 2. Scatter plots
4. Conclusions
This study investigates the accuracy of two different hybrid models, wavelet packet-based artificial neural network (WPANN) and wavelet packet-based adaptive neuro-fuzzy inference system (WPANFIS), for forecasting daily river stages in the Gam Stream Watershed, South Korea. The specific objectives are to develop and apply the models for improving daily river stage forecasting, comparing with the single ANN and ANFIS models, and evaluate the performance of the models based on various performance indexes, including the coefficient of efficiency (CE), the index of agreement (d), the coefficient of determination (r2), the root mean squared error (RMSE), the mean absolute error (MAE), the mean squared relative error (MSRE) and the mean
higher order error (MS4E).
The WPANN and WPANFIS models produce better results than the ANN and ANFIS models, respectively. Comparison with wavelet packet-based models indicates that the WPANFIS models are superior to the WPANN model, and WPANFIS model yields the best performance among all other models in terms of model efficiencies. It is found that the conjunction of wavelet packet decomposition and data-driven models, including ANN and ANFIS models, can significantly improve the models’
32 33 34 35 36 37 Observed values (m) 32 33 34 35 36 37 32 33 34 35 36 37 Observed values (m) 32 33 34 35 36 37 32 33 34 35 36 37 Observed values (m) 32 33 34 35 36 37 32 33 34 35 36 37 Observed values (m) 32 33 34 35 36 37
accuracy in forecasting daily river stages. Therefore, the conjunction with wavelet packet decomposition and data-driven models can be a successful tool for forecasting daily river stages.
References
[1] K. Figueiredo, C.R.H. Barbosa, A. Da Cruz, M. Vellasco, M. Pacheco, R. Conteras, Neural networks for inflow forecasting using precipitation information, Lect. Notes Comput. Sci. 4570 (2007) 552-561.
[2] S. Kim, J. Shiri, O. Kisi, V.P. Singh, Estimating daily pan evaporation using different data-driven methods and lag-time patterns, Water Resour. Manage. 27(7) (2013) 2267-2286.
[3] Y. Seo, S. Kim, V.P. Singh, Flood forecasting and uncertainty assessment using bootstrapped ANFIS, Proceedings of 6th Conference of Asia Pacific
Association of Hydrology and Water Resources, Seoul, South Korea, 2013, 1-8.
[4] Y. Seo, K.B. Park, S. Kim, Comparative study on fuzzy rule-based systems for flood level forecasting, Proceedings of Korea Water Resources Association, South Korea, 2013, 421-425 (in Korean).
[5] Y. Seo, K.B. Park, S. Kim, V.P. Singh, Application of bootstrap-based artificial neural networks to flood forecasting and uncertainty assessment, Proceedings of 6th
International Perspective on Water Resources and the Environment, EWRI-ASCE, Izmir, Turkey, 2013, 1-10.
[6] C.L. Wu, K.W. Chau, Y.S. Li, Predicting monthly streamflow using data-driven models coupled with data-preprocessing techniques, Water Resour. Res. 45(8) (2009) W08432.
[7] Y. Seo, S. Kim, O. Kisi, V.P. Singh, Daily water level forecasting using wavelet decomposition and artificial intelligence techniques, J. Hydrol. 520 (2015) 224–243.
[8] D.S.K. Karunasinghe, S.Y. Liong, Chaotic time series prediction with a global model: artificial neural network, J. Hydrol. 323(1-4) (2006) 92-105. [9] H.F. Wang, W.J. Huang, W.S. Wang, Cuntan station of the Yangtze River annual runoff forecasting with set pair analysis method, J. Heilongjiang Hydraul.
Eng. Coll. 33(4) (2006) 3-5.
[10] H.K. Cigizoglu, O. Kisi, Flow prediction by three back propagation techniques using k-fold partitioning of neural network training data, Nord. Hydrol. 36(1) (2005) 49-64.
[11] S. Kim, Y. Seo, V.P. Singh, Assessment of pan evaporation modeling using bootstrap resampling and soft computing methods, J. Comput. Civ. Eng. 29(5) (2015) http://dx.doi.org/10.1061/(ASCE)CP.1943-5487.0000367.
[12] M.K. Tiwari, C. Chatterjee, Uncertainty assessment and ensemble flood forecasting using bootstrap based artificial neural networks (BANNs), J. Hydrol. 382(1-4) (2010) 20-33.
[13] M.K. Tiwari, C. Chatterjee, Development of an accurate and reliable hourly flood forecasting model using wavelet-bootstrap-ANN (WBANN) hybrid approach, J. Hydrol. 394(3-4) (2010) 458-470.
[14] U. Okkan, Using wavelet transform to improve generalization capability of feed forward neural networks in monthly runoff prediction, Sci. Res. Essays. 7(17) (2012) 1690-1703.
[15] R.H. Abiyev, Fuzzy wavelet neural network based on fuzzy clustering and gradient techniques for time series prediction, Neural Comput. Appl. 20(2) (2011) 249-259.
[16] J. Adamowski, H.F. Chan, A wavelet neural network conjunction model for groundwater level forecasting, J. Hydrol. 407(1) (2011) 28-40.
[17] V. Nourani, M. Parhizkar, T.R. Khanghah, A.H. Baghanam, E. Sharghi, Wavelet-based feature extraction of rainfall-runoff process via self-organizing map, Proceedings of the 12th WSEAS International Conference on Applied Computer Science, WSEAS, Greece, 2012, 101-106.
[18] S. Wei, J. Song, N.I. Khan, Simulating and predicting river discharge time series using a wavelet-neural network hybrid modelling approach, Hydrol. Process. 26(2) (2012) 281-296.
[19] H. Liu, H. Tian, D. Pan, Y. Li, Forecasting models for wind speed using wavelet, wavelet packet, time series and artificial neural networks, Appl. Energ. 107 (2013) 191-208.
[20] M.Y. Gokhale, D.K. Khanduja, Time series signal analysis using wavelet packet decomposition approach, Int. J. Commun. Network Syst. Sci. 3 (2010) 321-329.
[21] J. Lei, Y. Meyer, R.D. Ryan, A wavelet packet approach to transient signal classification, Appl. Comput. Harmon. Anal. 2 (1994) 265-278.
[22] C.E. Imrie, S. Durucan, A. Korre, River flow prediction using artificial neural networks: generalization beyond the calibration range, J. Hydrol. 233 (2000) 138-153.
[23] G. Zhang, B.E. Patuwo, M.Y. Hu, Forecasting with artificial neural networks: the state of the art, Int. J. Forecast. 14(1) (1998) 35-62. [24] F. Günther, S. Fritsch, Neuralnet: training of neural networks, R J. 2(1) (2010) 30-38.
[25] D.W. Chen, J.P. Zhang, Time series prediction based on ensemble ANFIS, Proceedings of the Fourth International Conference on Machine Learning and Cybernetics, Guangzhou, 18-21 August 2005, 6, 3552-3556.
[26] J.S.R. Jang, C.T. Sun, E. Mizutani, Neuro-fuzzy and soft computing: a computational approach to learning and machine intelligence, Prentice-Hall, New Jersey, 1997.
[27] G.G Amiri, A. Asadi, Comparison of different methods of wavelet and wavelet packet transform in processing ground motion records, Int. J. Civ. Eng. 7(4) (2009) 248-257.
[28] V. Nourani, M.T. Alami, M.H. Aminfar, A combined neural-wavelet model for prediction of Ligvanchai watershed precipitation, Eng. Appl. Artif. Intell. 22(3) (2009) 466-472.