c
ON QUERYING LARGE SCALE INFORMATION NETWORKS
BY
PEIXIANG ZHAO
DISSERTATION
Submitted in partial fulfillment of the requirements for the degree of Doctor of Philosophy in Computer Science
in the Graduate College of the
University of Illinois at Urbana-Champaign, 2 012
Urbana, Illinois
Doctoral Committee:
Abel Bliss Professor Jiawei Han, Chair and Director of Research Associate Professor Kevin Chen-Chuan Chang
Associate Professor Chengxiang Zhai
Abstract
Social and technical information systems usually consist of a large number of interacting physical, conceptual, and human/societal entities. Such individual entities are intercon-nected to form large and sophisticated networks, which, without loss of generality, are often refereed to as information networks. Examples of information networks include the Web, highway or urban transportation networks, research collaboration and publication networks, biological networks and social networks. Clearly, information networks are ubiquitous and form a critical component of modern information infrastructure.
Theoretically, information networks can be modeled and manipulated as large scale graphs, which have gradually become the first-class citizens in the data management and mining fields. However, it is extremely inefficient to process such graph-structured data in any existing data models or computational frameworks. Real world information networks are massive, whose sheer size may simply overwhelm a direct application of any conventional graph algorithms designed and implemented for small or medium-sized memory-resident graphs. In the mean time, information networks are not static but rapidly changing all the time. The massive and dynamic nature of information networks has posed special challenges to effective query processing especially in scenarios where real-time responses are desirable. In this thesis, we will consider a series of queries of practical value arising in real world network scenarios, and explore the effective and potentially scalable querying solutions for large scale information networks. All such queries have been found fundamental and critically important at the core of many advanced network applications. First of all,P-Rankis proposed to answer the structural similarity query: “which entities are (structurally) similar to a query
entity” in an information network. Second, SPath is proposed as a high performance graph indexing mechanism to address general subgraph queries on large scale information networks. Third,Graph Cube is designed as a new warehousing model that supports OLAP queries on large multidimensional information networks. Last, but not the least,gSketchis devised as a new sketch method that combines well-studied synopsis structures with a sketch partitioning technique in order to estimate and optimize the responses to basic queries on rapidly changing information networks. Our experimental studies demonstrate that our querying methods are highly efficient an scalable, and have achieved satisfactory performance for the fundamental queries on large scale information networks.
We should admit that the queries examined in the thesis are merely the tip of the iceberg. The marriage of information network analysis and query processing technology will bring many exciting opportunities for future study, which are briefed in the end of the thesis.
Acknowledgments
This thesis would not have been possible without the consistent support and careful guidance of my thesis advisor, Professor Jiawei Han. I am forever indebted to Jiawei, who is blessed with an astonishing combination of brilliance and patience. I will be grateful for both the research appreciation and the technical skills he has patiently taught me. I owe him my research career, which is one of the most rewarding pursuits in my life.
I would like to thank Dr. Charu C. Aggarwal, Professor Kevin Chen-chuan Chang and Professor Chengxiang Zhai, for taking their valuable time to be on my thesis committee and for providing many thought-provoking comments and helpful suggestions.
I would like to express my sincere gratitude to my (current and former) colleagues in both the DAIS (Data and Information Systems) group and the Data Mining Research group at UIUC: Deng Cai, Chen Chen, Hong Cheng, Marina Danilevsky, Hongbo Deng, Bolin Ding, Quanquan Gu, Jing Gao, Hector Gonzalez, Manish Gupta, Xin Jin, Sangkyum Kim, Xiaolei Li, Zhenhui Li, Xide Lin, Chao Liu, Yizhou Sun, Lu An Tang, Chi Wang, Tim Weninger, Tianyi Wu, Dong Xin, Xifeng Yan, Xiaoxin Yin, Zhijun Yin, Xiao Yu, Yintao Yu, Bo Zhao, Feida Zhu and other group members for their constructive discussions and insightful comments on research. My colleagues gave me enjoyable and unforgettable experiences through the years of study at the University of Illinois at Urbana-Champaign.
Finally, I am deeply indebted to my wife Zhe and my parents for their love, faith and encouragement. For any current or future success that I might have, they deserve more credit than I can possibly express in a few lines of text.
Table of Contents
List of Tables . . . ix
List of Figures . . . x
Chapter 1 Introduction . . . 1
Chapter 2 Preliminary Concepts . . . 9
2.1 Graphs . . . 9
2.2 Networks . . . 12
Chapter 3 Structural Similarity Computation in Information Networks . 14 3.1 Introduction . . . 14 3.2 Related Work . . . 18 3.3 P-Rank . . . 20 3.3.1 Preliminaries . . . 20 3.3.2 P-Rank Formula . . . 21 3.3.3 Derivatives of P-Rank . . . 25 3.3.4 Computing P-Rank . . . 27 3.4 Experiment . . . 31
3.4.1 A Heterogenous DBLP Information Network . . . 31
3.4.2 A Homogenous DBLP Information Network . . . 35
3.4.3 Synthetic Data Sets: R-MAT . . . 37
3.5 Conclusion . . . 39
Chapter 4 Graph Query Optimization in Information Networks . . . 40
4.1 Introduction . . . 40
4.2 Related Work . . . 43
4.3 Problem Definition . . . 46
4.4 The Pattern-based Graph Indexing Framework . . . 47
4.4.1 The Baseline Algorithmic Framework . . . 47
4.4.2 Structural Pattern Based Graph Indexing . . . 49
4.4.3 Structural Pattern Evaluation Model . . . 52
4.5 SPath . . . 53
4.5.1 Neighborhood Signature . . . 54
4.6 Graph Query Processing . . . 59
4.6.1 Query Decomposition . . . 59
4.6.2 Path Selection and Join . . . 61
4.6.3 Path Instantiation . . . 63
4.7 Experimental Evaluation . . . 66
4.7.1 A Yeast Protein Interaction Network . . . 66
4.7.2 Synthetic Disk-resident Graphs . . . 70
4.8 Conclusions . . . 72
Chapter 5 Warehousing and OLAP Multidimensional Information Net-works . . . 73
5.1 Introduction . . . 73
5.2 The Graph Cube Model . . . 79
5.3 OLAP on Graph Cube . . . 82
5.3.1 Cuboid Query . . . 83
5.3.2 Crossboid Query . . . 86
5.4 Implementing Graph Cubes . . . 91
5.5 Experiments . . . 94 5.5.1 Data Sets . . . 95 5.5.2 Effectiveness Evaluation . . . 96 5.5.3 Efficiency Evaluation . . . 99 5.6 Related Work . . . 101 5.7 Conclusions . . . 103
Chapter 6 Query Estimation in Streaming Information Networks . . . . 104
6.1 Introduction . . . 104
6.2 Related Work . . . 107
6.3 The Algorithmic Framework . . . 108
6.3.1 Problem Definition . . . 108
6.3.2 A Global Sketch Solution . . . 109
6.3.3 Broad Intuition for a Better Solution . . . 112
6.4 Sketch Partitioning . . . 113
6.4.1 Sketch Partitioning with Data Sample . . . 114
6.4.2 Sketch Partitioning with Data and Workload Samples . . . 121
6.5 Query Processing . . . 122
6.6 Experimental Results . . . 124
6.6.1 Data Sets . . . 125
6.6.2 Evaluation Methods . . . 126
6.6.3 Query Estimation with Data Samples . . . 128
6.6.4 Query Estimation with Data and Workload Samples . . . 131
6.6.5 Efficiency Results . . . 134
6.6.6 Effect of New Vertices . . . 135
6.6.7 Discussion on Experimental Studies . . . 136
Chapter 7 Conclusions and Future Directions . . . 139
7.1 Summary of Contributions . . . 140
7.2 Future Work . . . 141
7.2.1 Foundations and Models of Information Networks . . . 142
7.2.2 Efficient and Scalable Querying in Information Networks . . . 143
List of Tables
4.1 Qualitative Costs for Different Structural Patterns . . . 53 5.1 Major Conferences Chosen For Each Research Area . . . 95 5.2 Four Buckets of Publication Numbers for the Productivity Attribute . . . 95 6.1 Avg. Relative Error of gSketch and Outlier Sketch in GTGraph Data Set . . 136
List of Figures
1.1 Different Real World Information Networks . . . 2
3.1 A Heterogenous Information Network and Structural Similarity Scores of Sim-Rank (C= 0.8) andP-Rank (C = 0.8, λ= 0.5) . . . 15
3.2 A Homogeneous Information Network and Structural Similarity Scores of Sim-Rank (C= 0.8) andP-Rank (C = 0.8, λ= 0.8) . . . 17
3.3 Structural Similarity Matrix for Information Networks . . . 25
3.4 The Schema of Heterogeneous DBLP Information Networks. (The Number Represents the Number of Vertices in the Corresponding Category) . . . 32
3.5 Compactness of P-Rank and of SimRank in Heterogeneous DBLP . . . 33
3.6 Similarity Measures on Author Pairs in Heterogeneous DBLP . . . 34
3.7 Top-10 Ranking Results for Author Vertices in DBLP by P-Rank . . . 35
3.8 Compactness of P-Rank and of SimRank in Homogeneous DBLP . . . 36
3.9 Vertex Pair Distributions w.r.t. Similarity Scores in Homogeneous DBLP . . 36
3.10 Vertex Pair Distributions w.r.t. Similarity Scores in Synthetic Data Set . . . 37
3.11 P-Rank v.s. Different Parameters . . . 38
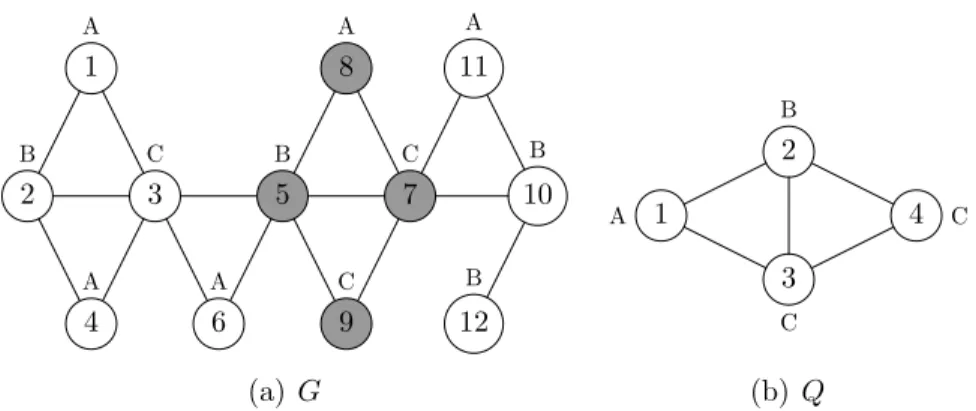
4.1 A Network G and a Query GraphQ . . . 46
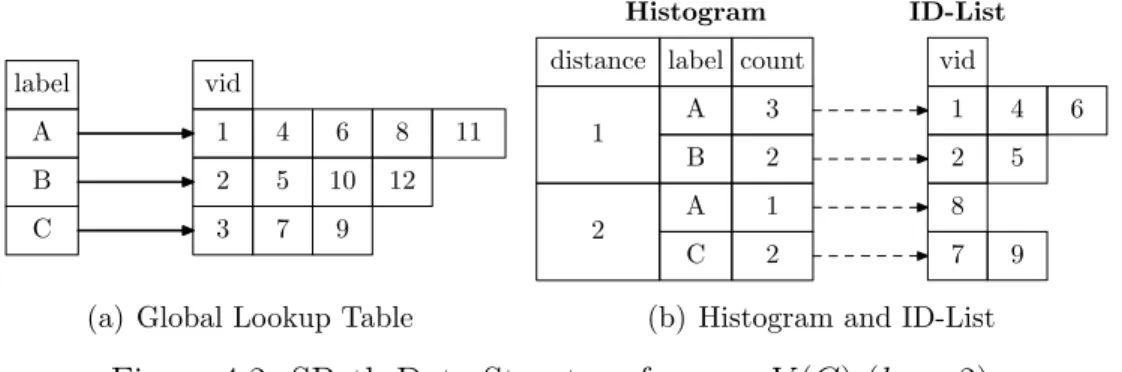
4.2 SPath Data Structure for u3 ∈V(G) (k0 = 2) . . . 58
4.3 Index Construction Cost of SPath . . . 67
4.4 Query Response Time for Clique Queries . . . 68
4.5 Query Response Time for Path Queries . . . 69
4.6 Query Response Time for Subgraph Queries . . . 70
4.7 Index Construction of SPath . . . 70
4.8 Query Response Time for Subgraph Queries in the Synthetic Graph . . . 71
5.1 A Sample Multidimensional Network with a Graph and a Multidimensional Vertex Attribute Table . . . 74
5.2 Multidimensional Network Aggregation vs. RDB Aggregation (Group by Gender) . . . 75
5.3 Multidimensional Network Aggregation vs. RDB Aggregation (Group by Gender and Location) . . . 76
5.4 The Graph Cube Lattice . . . 81
5.5 The Aggregate Network between a User (ID=3) and Various Locations . . . 86
5.7 Crossboid Queries Straddling Multiple Cuboids . . . 88
5.8 Aggregate Network to the Crossboid Query Straddling (Gender) and (Loca-tion) Cuboids . . . 88
5.9 Cuboid Queries of the Graph Cube on DBLP Data Set . . . 96
5.10 Crossboid Queries of the Graph Cube on DBLP Data Set . . . 98
5.11 Full Materialization of the Graph Cube for DBLP Data Set . . . 99
5.12 Full Materialization of the Graph Cube for IMDB Data Set . . . 100
5.13 Average Respond Time w.r.t. Different Partial Materialization Algorithms . 101 6.1 A CountMinSketch . . . 110
6.2 Average Relative Error of Edge Queries Qe w.r.t. Memory Size (Bytes) . . . 129
6.3 Number of Effective Queries for Qe w.r.t. Memory Size (Bytes) . . . 130
6.4 Query Estimation Accuracy of Graph Queries Qg w.r.t.Memory Size (Bytes) in DBLP . . . 130
6.5 Average Relative Error of Edge Queries Qe w.r.t. Memory Size(Bytes) (Zipf Skewness α= 1.5) . . . 131
6.6 Number of Effective Queries for Edge Queries Qe w.r.t. Memory Size (Bytes) (Zipf Skewnessα = 1.5) . . . 132
6.7 Query Estimation Accuracy of Graph Queries Qg w.r.t.Memory Size (Bytes) in DBLP Data Set (α= 1.5) . . . 132
6.8 Average Relative Error of Qe w.r.t.Zipf Sampling Skewness α . . . 133
6.9 Number of Effective Queries for Edge Queries Qe w.r.t. Zipf Sampling Skew-ness α . . . 133
6.10 Query Estimation Accuracy of Graph Queries Qg w.r.t. Zipf Sampling Skew-ness α in DBLP Data Set . . . 134
6.11 Sketch Construction Time Tc (Seconds) w.r.t.Memory Size (Bytes) . . . 135
Chapter 1
Introduction
Social and technical information systems usually consist of a large number of interacting physical, conceptual, and human/societal entities. Such individual entities are intercon-nected with relationships to form large and sophisticated networks. Without loss of general-ity, we call these interconnected networks asinformation networks. Examples of information networks include the Web [72, 96], highway or urban transportation networks [63], research collaboration and publication networks [47], biological networks [98] and social networks [84]. Clearly, information networks are ubiquitous and form a critical component of modern in-formation infrastructure.
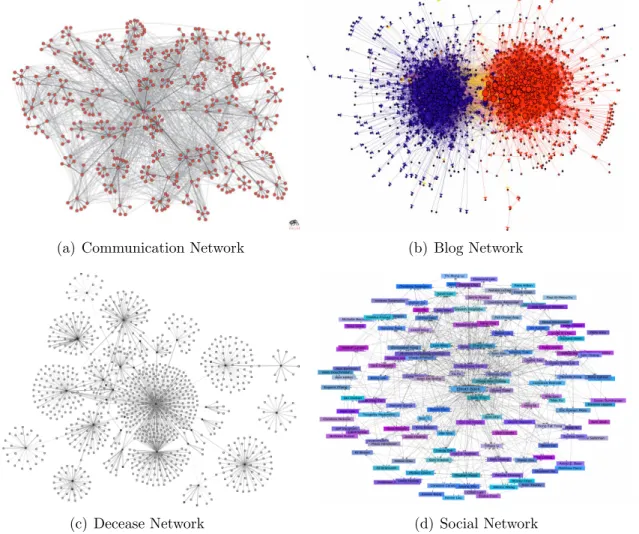
An information network can be naturally modeled and represented as agraph [7, 28]. En-tities of the information network are depicted asvertices, while relationships among entities are illustrated as edges, thus forming a large scale interconnected graph structure. Recent years have witnessed a rapid proliferation of information networks that keep growing in an astounding speed in various application domains. Some noteworthy examples of information networks are illustrated in Figure 1.1:
• Figure 1.1(a) represents an email communication network among 436 employees, de-picted as red vertices in the graph, of Hewlett Packard Research Lab [3]. Two individ-uals are linked, illustrated as grey edges between vertices, if they exchanged at least 6 emails in either direction within more than 3 months between Oct. 2002 and Feb. 2003;
(a) Communication Network (b) Blog Network
(c) Decease Network (d) Social Network
Figure 1.1: Different Real World Information Networks
revealing two natural and well-separated clusters [2]. There were 1,494 blogs in total, 759 liberal, depicted as blue vertices, and 735 conservative, depicted as red vertices. If there is a URL on the page of one blog which references another political blog, an edge will be created accordingly. The colors of edges also reflect political orientation, red for conservative, and blue for liberal. Orange edges go from liberal to conservative, and purple ones from conservative to liberal. The size of each vertex reflects the number of other vertices (blogs) that link to it;
• Figure 1.1(c) represents a disease spread network containing 35 tuberculosis (TB) patients and their 1,039 contacts in southwest Oklahoma in 2002. TB patients are represented by black nodes. Contacts are represented by white boxes. Gray lines
represent the links between TB patients and contacts. Decreasing thicknesses of gray lines represent the strength of the relationship between patients and type of contacts: close, casual, or undetermined, respectively;
• Figure 1.1(d) represents a small social network from Facebook where the friendship connections from one individual, Elliott B¨ack, to his friends have been plotted1. Such
online social networks allow granular insights into how individuals behave and how they form and change their connections.
Despite their pervasiveness in the daily life, information networks, to our surprise, have been far not enough to be examined thoroughly and systematically. Past research has merely touched the tip of the iceberg of the studies and analysis of information networks. The significant variety and special characteristics of information networks have posed a series of serious challenges to model, manage and access such graph-structured data in an efficient and cost-effective way:
1. Although relational database theory and XML technology have been mature for decades, there still lack well-established methodologies and industry-strength solutions for newly emerging graph-structured information networks. Information networks, often mod-eled and manipulated as large scale graphs, have gradually become the first-class citizen in data management and mining fields. However, it is extremely inefficient to process such graph-structured data in any existing data models or frameworks;
2. While information networks are gradually becoming recognized as a rich and powerful repository with vast amounts of implicitly and explicitly embedded knowledge, the cor-responding analytical solutions designed in this context have been primitive so far with limited usage. Heterogeneous network contents such as text, images, spatial-temporal information and multidimensional metadata are usually treated independently of the
interlinked structure of the networks, therefore resulting in poor query or mining re-sults that are of little interest to users on the one hand, and with low interpretability and usability on the other.
3. Real world information networks are massive and their corresponding underlying graphs typically contain millions of vertices and billions of edges. For example, as of June 2012, the indexed Web graph contains at least 8.94 billion pages2. Facebook has more than
901 millions active users and 125 billions friendship relations3. Information networks in
other application domains, such as transportation networks and biochemical networks tend to grow massive as well [7]. The sheer size of such information networks may sim-ply overwhelm a direct application of the conventional graph algorithms which were designed and implemented for small or medium-sized memory-resident graphs. Mean-while, information networks are not static but expanding all the time. As of December 2011, eMarketer estimates just over 1.2 billion people around the world used social networking sites at least once per month. That represented 23.1% growth over 2010, and double-digit growth will continue throughout eMarketer’s forecast period4. The
massive and dynamic nature of information networks has thus posed a special challenge to algorithm design especially in scenarios where real-time responses are desirable. The burgeoning size and heterogeneity of information networks have inspired extensive interest in supporting effective and efficient querying methods in real applications that are centered on massive graph data. In this thesis, we will be focused on a series of queries of practical value arising in real world information networks, and explore effective and poten-tially scalable solutions in the case of large scale information networks. The queries picked for exploration are fundamental and critical at the core of many advanced information network operations, and have been found representative and extremely prevalent in a wide variety
2http://www.worldwidewebsize.com
3http://www.facebook.com/press/info.php?statistics 4http://www.emarketer.com
of information network applications. The primary goal of our research is to explore both principled methodologies and innovative applications for competent and high-performance query processing technology in large scale information networks that can be accessed and retrieved effectively in the context of the massive and ever-changing data conditions and application requirements.
In this thesis, we restrict ourselves to the information networks that can be modeled as large scale connected simple graphs. However, all our query processing methods can be easily generalized toward other disconnected, multi-graphs. Our current research progress is therefore formulated and reported based on the types of both the information networks and the various queries that arise frequently in information networks, as follows:
1. P-Rank: on structural similarity computation in information networks. In this work, we are focused on the query “how (structurally) similar are two entities in an information network?”. The structural similarity query is the cornerstone of many advanced operations of information networks, such as proximity query pro-cessing [112, 19], outlier detection [48], classification [62] and clustering [103]. We therefore propose a new structural similarity measure, P-Rank (Penetrating Rank), to evaluate structural similarities of entities in real world information networks. P-Rank enriches the well-knownSimRank [61] by jointly encoding both in- and out-link relationships of entities into structural similarity computation. P-Rank proves to be a unified structural similarity framework, under which most of the state-of-the-art structural similarity measures, including CoCitation, Coupling, Amsler and SimRank, are just its special cases. Based on the recursive nature ofP-Rank, we further design a fixed-point algorithm to reinforce structural similarity of entity pairs beyond the local-ized neighborhood scope toward a computation over the entire information network. Our experiments demonstrate the power of P-Rank in different information networks. Meanwhile, P-Rank outperforms SimRank as a more comprehensive and meaningful structural similarity measurement in real world information networks;
2. SPath: on graph query optimization in information networks. In this work, we consider a common and critical structural query primitive of information networks: how to find subgraph structures efficiently in a large information network? As a key ingredient of many network applications, this graph query has been frequently issued and extensive studied in pattern recognition, computer systems, social networks and bioinformatics. Unfortunately, the subgraph query is hard due to the NP-complete nature of subgraph isomorphism. It becomes even challenging when the information network examined is large and diverse. We thus devise a high performance graph indexing mechanism, SPath, to address the subgraph query problem in large scale in-formation networks. SPath leverages decomposed shortest path information in vertex neighborhood as basic indexing units, which prove to be both cost-effective in graph search space pruning and highly scalable in index construction and deployment. Via SPath, a subgraph query can be further optimized from the traditional vertex-at-a-time querying paradigm to a more efficientpath-at-a-time way: the graph query is first de-composed to a set of shortest paths, among which a subset of candidates with good selectivity is picked by a query plan optimizer. Candidate paths are joined together afterwards in the information network to help recover the query graph and finalize the graph query processing. We evaluate SPath with the state-of-the-art GraphQL [57] on both real and synthetic data sets. Our experimental studies demonstrate the effective-ness and scalability ofSPath, which proves to be a more practical and efficient indexing method in addressing general subgraph queries on large scale information networks; 3. Graph Cube: on warehousing and OLAP multidimensional information
net-works. In this work, we consider extending decision support facilities by way of resolv-ing OLAP (online analytical processresolv-ing) queries toward large sophisticated information networks, upon which multidimensional attributes are associated with network entities, thereby forming the so-called multidimensional information networks. As important
means of decision support and business intelligence, OLAP queries are advantageous in both network summarization [105, 115] and social targeting [12, 104]. We therefore introduce Graph Cube, a new data warehousing model that supports OLAP queries effectively on large multidimensional information networks. Taking account of both attribute aggregation and structure summarization from the networks, Graph Cube goes beyond the traditional data cube model that solely involves numeric value based group-by’s, thus resulting in a more insightful and structure-enriched aggregate net-work within every possible multidimensional space. Besides traditional cuboid queries, a new class of OLAP queries, crossboid, is introduced that is uniquely useful in mul-tidimensional information networks and has not been studied before. We implement Graph Cubeby combining special characteristics of multidimensional networks with the existing well-studied data cube techniques. We perform extensive experimental studies on a series of real world data sets and Graph Cube has proven to be a powerful and efficient tool for decision support on large multidimensional information networks; 4. gSketch: on query estimation in streaming information networks. Many
in-formation networks in real applications are actually graph streams, in which edges of the underlying graph are received and updated sequentially in a form of a stream. It is often necessary and important to summarize the behavior of graph streams in order to enable effective query processing on large-scale information networks. In this work, we propose a new graph sketch method,gSketch, which combines well studied synopses for traditional data streams with a sketch partitioning technique, to estimate and optimize the responses to basic queries, such as edge queries and aggregate subgraph queries, on streaming information networks. Despite being primitive, both the edge query and the aggregate subgraph query are nontrivial in streaming information neworks, and they serve as the building bricks of many advanced querying and mining operations of graph streams [13, 43, 33]. We consider two different scenarios for query
estima-tion: (1) A graph stream sample is available; (2) Both a graph stream sample and a query workload sample are available. Algorithms for different scenarios are designed respectively by partitioning a global sketch to a group of localized sketches in order to optimize the query estimation accuracy. We perform extensive experimental studies on both real and synthetic data sets and demonstrate the power and robustness of gSketchin comparison with the state-of-the-art global sketch method [31].
Graph has proven to be a powerful abstraction for interlinked complex and heterogeneous data, and the information network paradigm has posed a wealth of fascinating research problems and high impact applications. It is our strong belief that they will continue to play a key role in many widely encountered scenarios. Meanwhile, modern business and industrial infrastructures are collecting massive amounts of data (“big data”) at an unprecedented scale and pace. The ability to perform efficient and data-intensive query processing techniques on such large scale information networks now becomes a key ingredient of success. In the end of the thesis, we also envision some of the future opportunities that go beyond our current explorations.
The remainder of the thesis is organized as follows. In Chapter 2, the preliminary con-cepts and common definitions are first elaborated to facilitate the subsequent discussion. In Chapter 3, we present P-Rank for supporting structural similarity computation on in-formation networks. In Chapter 4, the subgraph queries are addressed in detail by SPath. Chapter 5 demonstratesGraph Cube for OLAP queries on multidimensional information net-works. In Chapter 6, gSketch is elaborated for query estimation in streaming information networks. We will brief the potential future work and conclude our thesis in Chapter 7.
Chapter 2
Preliminary Concepts
In this chapter we develop some of the basic concepts and common definitions behind infor-mation networks. This will allow us to formulate both the data of interest and queries to be examined in a unifying language for our thesis. The definitions here are generic enough that they can be applied unambiguously throughout the thesis if the context is not specified otherwise, while other advanced concepts related to complicated information networks and corresponding querying solutions will be defined in subsequent chapters respectively.
2.1
Graphs
The most natural and easiest way to represent an information network is by way of graph. Graph is a basic mathematical construct specifying relationships among a collection of en-tities. A graph G = (V, E) consists of a set V of entities, called vertices, with a set E of certain pairs of these entities connected by links, callededges. An edgeecan be represented as e= (u, v) where u,v are the pair of vertices of e. u (or v) is said to be adjacent tov (or
u), and u, v are neighbors. Both vertices and edges can be assigned with unique identifiers for ease of presentation and analysis.
The degree of a vertex uin a graph G, denoted d(u), is the number of edges adjacent to
u. If G contains m edges, it becomes evident 2m =Pu∈V d(u).
In some scenarios, the edges of a graph are used to model symmetric relationships: the edgee= (u, v) simply connectsuandv and the relative order ofuandv makes no difference in modeling such a symmetric relationship between u and v. For example, a friendship
relation connecting Alex and Bob in FaceBook is a symmetric relationship. Hence the graph in these scenarios is often referred to as anundirected graph. Likewise, in many other settings, the edges of a graph can be used to express asymmetric relationships: the edge e = (u, v) indicates thatupoints to v but not vice versa. For example, the adviser-advisee relationship between Chelsea (advisor) and David (advisee) in the Mathematics Genealogy Project1 is an
asymmetric relationship. We therefore refer to the graph modeling asymmetric relationships as a directed graph.
Besides interlinked relationships, both vertices and edges of a graph may bear attributes. The graph is therefore called labeled graph. For example, the city names of a road network are the labels of the vertices in the underlying graph, while the road/highway names are the labels of the edges, accordingly. Theoretically, both vertices and edges may have more complex labels, such as numeric values, strings, multidimensional vectors or even graphs themselves. Likewise, a graph may have no labels for vertices or edges, as the one defined in the beginning of the chapter. Such a graph is often referred to as an unlabeled graph indicating that only the interlinked relationships of entities are concerned. When edges of a graph are associated with numeric values, such a graph is calledweighted. For example, the Internet router graph has physical links between routers as the edges of the graph, and the bandwidth of each link in megabits per second (Mbps) is its weight.
There may exist multiple relationships between entities,i.e., there may be more than one edge between two vertices. For example, Edwin and Fred are friends, colleagues, roommates and members of ACM (Association for Computing Machinery), so there are four edges (bearing different semantic meanings) between the vertices Edwin and Fred. Meanwhile, a vertex can link to itself thus forming a loop edge. For example, in an email communication network, Grace may send an email to herself as a reminder. A graph is called simple if it contains no loops nor multiple edges between vertices. Otherwise, it is usually referred to as a multi-graph.
Given a graph, a path is simply a sequence of vertices with the property that each consecutive pair in the sequence is connected by an edge. we define the length of a path to be the number of steps it contains from beginning to end. A path without repetitive vertices is often referred to as a simple path. A cycle is a special path with at least three edges, in which the first and last vertices are identical, but otherwise all vertices are distinct. Cycles can be frequently found in communication and transportation networks allowing for redundancy. That is, they provide for alternate routings that go the “other way” around the cycle. With this in mind, we say that a graph isconnected if for every pair of vertices, there is a path between them. Otherwise, the graph is saiddisconnected. If a graph is disconnected, then it breaks apart naturally into a set of connected components. A connected component contains a group of vertices each of which has a path to all the others within the group. And such a group of vertices is not part of some larger group with the property that every vertex can reach every other. Dividing a graph into its connected components might be the first global way of describing its structure. Within a given connected component, there may be richer internal structure that is important to one’s interpretation of the network [34].
There are a lot of specialized graphs in real world applications. A bipartite graph G
contains two disjoint independent sets V1 and V2 of vertices with edges between V1 and V2.
In a recommender network, V1 is a set of users and V2 is a set of commodities. An edge
betweenu∈V1 and v ∈V2 means the userulikes and recommends the commodity v. Atree
is a connected graph with no cycles. For a tree Gwith n vertices, the following statements are equivalent: (1) G is connected and has (n−1) edges; (2) G has (n−1) edges and no cycles; (3) G has no loops and has, for each u, v ∈ G, exactly one path between u and v. An XML document can be represented as a tree with attributes attached upon vertices. In bioinformatics, a phylogeny tree is used to represent the evolutionary relationships among various biological species or other entities based upon similarities and differences in their physical and/or genetic characteristics. Aclique,a.k.a. complete graph, is a graph with a set of pairwise adjacent vertices. Clique usually represents a close community in social networks.
2.2
Networks
Graphs are useful mathematical models of information network structures. Although there are many differences between the information network structures, some common patterns or “laws” show up regularly, which together characterize the naturally occurring graphs in real world information networks. Such patterns or “laws”, if leveraged appropriately, can immensely improve the querying effectiveness for large scale information networks, as dictated in the following chapters.
1. Power Laws and Scale-free Networks. It has been witnessed and verified that the degree distribution of an undirect graph obeys the power law distribution [39]. Similarly, the eigenvalues of the adjacency matrix of a graph versus their ranks obey the same law. Power laws also show up in the distribution of “bipartite cores” and the distribution of PageRank values [93]. The significance of power law distributions lies in the fact that they are heavy-tailed, meaning that they decay very slowly. Indeed, power laws appear to be a definitive characteristic of almost all large scale networks, including social networks, protein-to-protein interaction networks, computer networks and the Web.
Definition 1. (POWER LAW) Two variables x and y obey the power law if their scatter plot is linear on a log-log scale: y(x) =cx−γ, where c and γ are positive constants.
γ is often referred to as the power law exponent.
Networks with power-law degree distributions are often referred to asscale-free networks.
2. Small World Phenomenon. A small-world network is a graph in which most vertices are not neighbors of one another, but most vertices can be reached from every other by a small number of hops or steps. Specifically, a small-world network is defined to be a network where the typical distance L between two randomly chosen vertices grows proportionally to the logarithm of the number of vertices n in the network, i.e., L ∝ logn. Many empirical graphs are well-modeled by small-world networks. Social networks, the
connectivity of the Internet, Wikipedia, and gene networks all exhibit small-world network characteristics.
Small-world networks tend to contain cliques, and near-cliques, meaning sub-networks have connections between almost any two vertices within them. Meanwhile, most pairs of vertices will be connected by at least one short path. Several other properties are often associated with small-world networks. Typically there is an over-abundance of hubs — vertices in the network with a high degree. These hubs serve as the common connections mediating the short path lengths between other edges. This property is often analyzed by considering the fraction of vertices in the network that have a particular number of connections going into them (the degree distribution of the network). Networks with a greater than expected number of hubs will have a greater fraction of vertices with high degree, and consequently the degree distribution will be enriched at high degree values. Specifically, if a network has a degree-distribution which can be fit with a power law distribution, it is taken as a sign that the network is small-world. Cohen etc. [27] showed analytically that scale-free networks are ultra-small worlds. In this case, due to hubs, the shortest paths become significantly smaller and scale as L∝loglogn.
3. Community Effects. A community is a set of vertices of a graph where each vertex is “closer” to the other vertices within the community than to vertices outside it. The com-munity effect has been found in many real world networks, especially social networks. The closeness of vertices within a community is often characterized by theclustering coefficient:
Definition 2. (CLUSTERING COEFFICIENT) For a vertexuwith edges (u, v) and (u, w), the local clustering coefficient ofu measures the probability of existence of the third edge (v, w). The global clustering coefficient of the entire graph is found by averaging over all vertices of the graph.
The networks with the large average clustering coefficient tend to have a modular struc-ture, and they have the small possible average distance among different vertices.
Chapter 3
Structural Similarity Computation in
Information Networks
3.1
Introduction
In this chapter, we consider the problem of similarity computation on entities of information networks. Our study is motivated by recent research and applications in proximity query processing [112, 19], outlier detection [48], classification [62] and clustering [103] over differ-ent information networks, which usually require an effective and trustworthy evaluation of underlying similarity among entities. It is desirable to propose a comprehensive similarity measure on information networks that can both map human intuition and generalize well under different information network settings.
However, it is nontrivial to systematically compute entity similarity in a general and effective fashion, and it becomes especially challenging when the information networks to be examined are massive and diverse. In the mean time, multiple aspects of entities in information networks can be exploited for similarity computation, and the choices are usually made domain-specifically.
In this chapter, we propose a new structural similarity measure, P-Rank (Penetrating
Rank), which solely explores the link structure of the underlying information network for similarity computation. Compared with traditional text contents, the link-based structural information is more homogenous and language independent, which is critical for similarity computation [80]. Concretely, within an information network, we computeP-Rank that says “two entities are similar if (1) they are referenced by similar entities; and (2) they refer-ence similar entities.” In comparison with the state-of-the-art structural similarity measure,
Figure 3.1: A Heterogenous Information Network and Structural Similarity Scores of Sim-Rank (C = 0.8) and P-Rank (C= 0.8,λ= 0.5)
SimRank [61], which considers the first aforementioned factor only, P-Rank encodes both in- and out-link relationships into computation toward a semantically complete and robust similarity measure. Moreover, similarity beliefs of entity pairs are propagated beyond local neighborhood scope to the entire information network, whose global structure is fully uti-lized in order to reinforce similarity beliefs of entities in a recursive fashion. P-Rank also proves to be a general framework for structural similarity of information networks and can be easily adapted in any information network settings wherever there exist enough inter-linked relationships among entities. For practical applicability, P-Rank can be effectively coupled with other non-structural domain-specific similarity measures, for example, textual similarity, toward a unified similarity measure for information networks.
Example 3.1.1: Consider a heterogeneous information network G in Figure 3.1 repre-senting a typical submission, bidding, review and acceptance procedure of a conference.
G is regarded as heterogeneous if vertices (entities) of G belong to different mutual ex-clusive categories, such as Conf erence = {c}, CommitterM ember = {m1, m2, m3} and
P aper = {p1, p2, p3, p4}. Directed edges represent the relationships between vertices in
dif-ferent categories. Two structural similarity measures, SimRank and P-Rank, for different vertex pairs of G are illustrated as well. As shown in Figure 3.1, the conferencec is consid-ered similar to itself, and the similarity scores (for both SimRank and P-Rank) are set to be 1. For committee member pairs{m1,m2},{m1,m3}, and{m2,m3}, as both vertices of each
c), we may infer that they are similar. However, SimRank cannot differentiate these three pairs. (They have the same SimRank score, 0.4). The main reason is that for committee member pairs, SimRank considers their in-link relationships with the vertex c only, while neglecting out-link relationships with paper vertices {p1, p2, p3, p4}. P-Rank, however, takes
into account of both in- and out-link relationships for similarity computation. As to {m1,
m2}, for example, because they both point to p2 (both m1 and m2 bid for paper p2), the
structural similarity between them is further strengthened (P-Rank score is 0.420, which is different from that of {m2, m3} (0.295), and that of {m1, m3} (0.380)). We generalize this
idea by observing that once we have concluded similarity betweenm1 and m2,p1 andp3 are
similar as well because they are pointed to by m1 and m2, respectively, although such an
inference is somehow weakened during similarity propagation. Continuing forth, for every comparable pair of vertices (in the same category) in G, we can inferP-Rank between them. 2
Example 3.1.2: Consider a homogeneous information networkGin Figure 3.2, representing a tiny literature graph. G is homogeneous if vertices of G, which represent scientific publi-cations in this example, belong to one category (“Publication”). Edges between vertices are references/citations from one paper to another. Different from heterogeneous information networks, any pair of vertices in homogenous information networks can be measured by their structural similarity because they all belong to the same category. We presentSimRank and P-Rank scores for some of them, as shown in Figure 3.2. SimRankcannot tell the differences between the vertex pair {P2, P3} and {P3, P4}, solely because SimRank considers partial in-link relationship information for similarity computation. More severely, SimRank is un-available for the vertex pairs{P4, P5}and {P2, P5}, mainly because these vertex pairs do not have shared in-link similarity factors. However,P-Rank can successfully infer structural similarity for all vertex pairs by considering both in- and out-link relationships into similarity computation, thus outperforms SimRankin homogeneous information networks. 2
Figure 3.2: A Homogeneous Information Network and Structural Similarity Scores of Sim-Rank (C = 0.8) and P-Rank (C= 0.8,λ= 0.8)
As its name dictates,P-Rankencodes both in- and out-link relationships of entities in sim-ilarity computation,i.e.,P-Rank scores flow from in-link neighbors of entities and penetrate through their out-link ones. Furthermore, this process is recursively propagated beyond the localized neighborhood scope of entities to the entire information network. The major mer-its ofP-Rank are its semantic completeness, generality and robustness. As a comprehensive structural similarity measure, P-Rank can be effectively adapted in information networks with different variety and scale, in which most up-to-date similarity measures, likeSimRank, may generate biased answers or simply fail due to the incomplete structural information considered in similarity computation, as illustrated in Example 3.1.1 and Example 3.1.2. In order to compute P-Rank efficiently, we propose an iterative algorithm converging fast to a fixed-point. The correctness of the algorithm is proven that this iterative algorithm always converges to its theoretical upper bound.
The contributions of our work are summarized as follows:
1. We propose a new structural similarity measure, P-Rank, applicable in information networks. We study its mathematical properties, its advantages over other state-of-the-art structural similarity measures, and its derivatives in different network settings. 2. We propose a fixed-point iterative algorithm to effectively computeP-Rankin informa-tion networks. We prove the correctness of the algorithm and discuss the optimizainforma-tion techniques to facilitate P-Rank computation in different scenarios.
which the well-known structural similarity measures,CoCitation,Coupling, Amsler and SimRank , are all its special cases.
4. We conduct extensive experimental studies on both real and synthetic data sets. The evaluation results demonstrate the power of P-Rank as a general structural similarity measure for different information networks.
The rest of the chapter is organized as follows. Section 3.2 discusses related work. In Section 3.3, we present our structural similarity measure, P-Rank, from both mathematical and algorithmic perspectives. We report our experimental studies in Section 3.4. Section 3.5 concludes this section.
3.2
Related Work
As common standards to determine the closeness of different objects, similarity (or proxim-ity) measures are crucial and frequently applied in clustering [103], nearest neighbor classifi-cation [54], anomaly detection [48] and similarity query processing [19]. Compared with traditional textual contents, link-based structural context of information networks is of special importance and exploited frequently in similarity computation. In previous stud-ies, SimFusion [111] aimed at “combining relationships from multiple heterogeneous data sources”. [77] proposed a similarity measure based on PageRank score propagation through link paths. [45] explored methods for ranking partial tuples in a database graph. Maguit-man et al. did extensive comparative studies for different similarity measures [80], and the results demonstrate that link-based structural similarity measures produce systematically better correlation with human judgements compared to the text-based ones.
In bibliometrics, similarities between scientific publications are commonly inferred from their cross-citations. Most noteworthy from this field are the methods of CoCitation [102], Coupling [70] and Amsler [10]. For CoCitation, the similarity between two papers p and q is based on the number of papers which reference bothp and q. For Coupling, the similarity is
based on the number of papers referenced by bothpandq. Amslerfuses bothCoCitation and Coupling for similarity computation. These methods have been efficiently applied to cluster scientific publications and Web pages [94].
SimRank[61, 41, 78, 11] is an iterative PageRank-like structural similarity measure for in-formation networks. It goes beyond simpleCoCitationmuch as PageRank goes beyond direct linking for computing importance of Web pages. The weakness ofSimRank, called thelimited information problem, is discussed in [61]. SimRankmakes use of in-link relationships only for similarity computation while neglecting similarity beliefs conveyed from out-link directions. Therefore, the structural information of information networks is partially exploited and the similarity computed is inevitably asymmetric and biased. In real information networks, those “unpopular entities”,i.e., entities with very few in-link relationships will be penalized by SimRank. More severely, SimRank can even be unavailable for entities with no in-link similarity flows (shown in Example 3.1.2). However, those entities with few or no in-links dominate information networks in quantity, as expressed by the power law and heavy-tailed in(out)-degree distribution [20]. Meanwhile, these entities are often not negligible because they are new, potentially popular, and interesting to most users. However, they tend to be harder for humans to find. To overcome the limited information problem, we propose P-Rank which refines the structural similarity definition by jointly considering both in- and out-link relationships of entity pairs. Furthermore, the similarity computation goes beyond the localized neighborhood so that the global structural information of information networks can be effectively leveraged to reinforce similarity beliefs of entities. As discussed afterwards, with the same time/space complexity asSimRank,P-Rankcan achieve much better similarity results and solve the limited information problem effectively. Heymans et al. [59] proposed similar ideas to model structural similarity of enzymes in metabolic pathway graphs in order for phylogenetic analysis of metabolic pathways. However, their similarity are defined on vertices in different graphs and if the factors of dissimilarity and absence of edges are not considered, their work can be regarded as a special case ofP-Rank (C = 1 and λ= 0.5).
Iterative fixed-point algorithms over the Web graph, like HITS [71] and PageRank [15], have been studied and applied to compute “importance” scores for Web pages. Results have shown that the usage of structural information of networks can greatly improve search performance versus text alone.
3.3
P-Rank
The basic recursive intuition of P-Rank can be expressed as “two entities of an information network are similar if they are related to similar entities”. More specifically, the two-fold meaning of P-Rank is elaborated as
1. two entities are similar if they are referenced by similar entities; 2. two entities are similar if they reference similar entities.
As the base case, we consider an entity maximally similar to itself, to which we can assign theP-Rankscore of 1. (If other entities are known to be similara-priori, their similarities can be pre-assigned as well.) For each pair of distinct entities, we take into consideration both their in- and out-link relationships for similarity computation. This similarity is then pene-trating from in-link neighbors to out-link ones and propagated toward the entire information network.
3.3.1
Preliminaries
We model an information network as a labeled directed graphG= (V, E,Σ;l) where vertex
v ∈V represents an entity of the domain and a directed edgehu, vi ∈Erepresents a relation-ship from entityuto entityv, whereu, v ∈V. Σ is an alphabet set andl:V →Σ is a labeling function. In heterogeneous information networks,V ={V1
S
V2· · · S
Vn}can be partitioned into n mutual exclusive vertex subsets, V1, V2,· · · , Vn, Vi
T
belong tondifferent domain-specific categories. In homogeneous information networks, how-ever, there is no distinction among vertices. Note that our definition of information networks can be naturally extended to undirect graphs or edge-weighted graphs.
For a vertex v in a graph G, we denote by I(v) and O(v) the set of in-link neighbors and out-link neighbors of v, respectively. Note that either I(v) and O(v) can be empty. An individual in-link neighbor is denoted as Ii(v), for 1 ≤ i ≤ |I(v)|, if I(v) 6= ∅, and an individual out-link neighbor is denoted as Oi(v), for 1 ≤i≤ |O(v)|, if O(v)6=∅.
3.3.2
P-Rank Formula
We denote the P-Rank score for vertex a and b by s(a, b) ∈ [0,1]. Following our aforemen-tioned intuition, P-Rank can be formalized recursively in Equation (3.1), when a6=b:
s(a, b) = λC |I(a)||I(b)| |IX(a)| i=1 |XI(b)| j=1 s(Ii(a), Ij(b)) + (1−λ)C |O(a)||O(b)| |OX(a)| i=1 |OX(b)| j=1 s(Oi(a), Oj(b)) (3.1)
Otherwise, P-Rank is defined as
s(a, b) = 1 (3.2)
In Equation (3.1), the relative weight of in- and out-link directions is balanced by parame-terλ ∈[0,1]. Cis set as a damping factor for in- and out-link directions,C ∈[0,1]1. The
rea-son is thats(a, b) will be attenuated during similarity propagation. WhenI(a)(or I(b)) =∅, the in-link part is invalidated and only the out-link direction takes into effect. Similarly, when O(a)(or O(b)) = ∅, only the similarity flows from in-link part are considered. If both
I(a)(or I(b)) =∅ and O(a)(or O(b)) = ∅, we define s(a, b) = 0.
Equation (3.1) is written for every pair of vertices a, b ∈ G, resulting in a set of n2
equations for a graph of size n (|V| =n). To solve the set of n2 equations, we rewrite the
recursive P-Rank formula (shown in Equation (3.1)) into the following iterative form
1For a more general form of P-Rank, C can be replaced by two different parameters C
in and Cout to
represent damping factors for in- and out-link directions, respectively. We omit the details as it is fairly easy to extend our work into that form.
R0(a, b) = 0 (if a6=b) 1 (if a=b) (3.3) and Rk+1(a, b) = λC |I(a)||I(b)| |IX(a)| i=1 |XI(b)| j=1 Rk(Ii(a), Ij(b)) +|O(1(a−)||λO)C(b)| |OX(a)| i=1 |OX(b)| j=1 Rk(Oi(a), Oj(b)) (3.4)
where Rk(a, b) denotes the P-Rank score between a and b on iteration k, for a 6= b and
Rk(a, b) = 1 for a =b. We progressively compute Rk+1(∗,∗) based on Rk(∗,∗). That is, on iteration (k+ 1), we update Rk+1(a, b) by the P-Rank scores from the previous iteration k.
This iterative computation starts withR0(∗,∗) whereR0(a, b) is a lower bound of the actual
P-Rank score, s(a, b).
Theorem 3.3.1: The iterative P-Rank equations (shown in Equation (3.3) and Equa-tion (3.4)) have the following properties
1. (Symmetry)Rk(a, b) =Rk(b, a)
2. (Monotonicity) 0 ≤Rk(a, b)≤Rk+1(a, b)≤1
3. (Existence) The solution to the iterative P-Rank equations always exists and
con-verges to a fixed point,s(∗,∗), which is the theoretical solution to the recursiveP-Rank equations.
4. (Uniqueness) the solution to the iterativeP-Rank equations is unique when C6= 1.
Proof:
1. (Symmetry)According to Equation (3.3) and Equation (3.4), it is obviousRk(a, b) =
Rk(b, a) for k ≥0
2. (Monotonicity) If a = b, R0(a, b) = R1(a, b) = . . . = 1, so it is obvious the
0. Based on Equation (3.4), 0 ≤R1(a, b) ≤ 1. So, 0 ≤R0(a, b) ≤ R1(a, b) ≤ 1. Let’s
assume that for all k, 0≤Rk−1(a, b)≤Rk(a, b)≤1, then
Rk+1(a, b)−Rk(a, b) = λC |I(a)||I(b)|× |XI(a)| i=1 |XI(b)| j=1 (Rk(Ii(a), Ij(b))−Rk−1(Ii(a), Ij(b))) + (1−λ)C |O(a)||O(b)|× |OX(a)| i=1 |OX(b)| j=1 (Rk(Oi(a), Oj(b))−Rk−1(Oi(a), Oj(b)))
Based on the assumption, we have (Rk(a, b)−Rk−1(a, b))≥0, ∀ a, b∈G, so the left
hand side Rk+1(a, b)−Rk(a, b)≥ 0 holds. By induction, we draw the conclusion that
for any k,Rk≤Rk+1. And based on the assumption, 0≤Rk(a, b)≤1, so
λC |I(a)||I(b)| |XI(a)| i=1 |XI(b)| j=1 Rk(Ii(a), Ij(b))≤ λC |I(a)||I(b)| |IX(a)| i=1 |XI(b)| j=1 1 =λ×C and (1−λ)C |O(a)||O(b)| |OX(a)| i=1 |OX(b)| j=1 Rk(Oi(a), Oj(b))≤ |O(1(a−)||λO)(Cb)| |OX(a)| i=1 |OX(b)| j=1 1 = (1−λ)×C
So Rk+1(a, b) ≤ λC + (1 −λ)C ≤ 1. By induction, we know that for any k, 0 ≤
Rk(a, b)≤1.
3. (Existence) According to Theorem 3.3.1-(2), ∀a, b ∈ G, Rk(a, b) is bounded and
nondecreasing as k increases. By the Completeness Axiom of calculus, each sequence
Rk(a, b) converges to a limitR(a, b)∈[0,1]. Note limk→∞Rk(a, b) = limk→∞Rk+1(a, b) =
R(a, b), So we have R(a, b) = lim k→∞Rk+1(a, b) = λC |I(a)||I(b)|klim→∞ |IX(a)| i=1 |XI(b)| j=1 Rk(Ii(a), Ij(b)) + |O(1(a−)||λO)C(b)| lim k→∞ |OX(a)| i=1 |OX(b)| j=1 Rk(Oi(a), Oj(b)) = λC |I(a)||I(b)| |IX(a)| i=1 |XI(b)| j=1 lim k→∞Rk(Ii(a), Ij(b)) + (1−λ)C |O(a)||O(b)| |OX(a)| i=1 |OX(b)| j=1 lim k→∞Rk(Oi(a), Oj(b))
= λC |I(a)||I(b)| |XI(a)| i=1 |IX(b)| j=1 R(Ii(a), Ij(b)) + (1−λ)C |O(a)||O(b)| |OX(a)| i=1 |OX(b)| j=1 R(Oi(a), Oj(b))
Note that the limit of Rk(∗,∗) with respect to k right satisfies the recursive P-Rank equation, shown in Equation (3.1).
4. (Uniqueness) Suppose s1(∗,∗) and s2(∗,∗) are two solutions to the n2 iterative
P-Rank equations. For any entities x, y ∈ G , let δ(x, y) = s1(x, y)−s2(x, y) be their
difference. LetM = max(x,y)|δ(a, b)|be the maximum absolute value of any difference.
We need to show thatM = 0. Let |δ(x, y)|=M for somea, b∈G. It is obvious that
M = 0 ifa=b. Otherwise, δ(a, b) =s1(a, b)−s2(a, b) = λC |I(a)||I(b)| |IX(a)| i=1 |XI(b)| j=1 (s1(Ii(a), Ij(b))−s2(Ii(a), Ij(b))) + (1−λ)C |O(a)||O(b)|× |OX(a)| i=1 |OX(b)| j=1 (s1(Oi(a), Oj(b))−s2(Oi(a), Oj(b))) Thus, M =|δ(a, b)| = ¯ ¯ ¯ λC |I(a)||I(b)| |IX(a)| i=1 |XI(b)| j=1 δ(Ii(a), Ij(b)) + |O(1(a−)||λO)(Cb)| |OX(a)| i=1 |OX(b)| j=1 δ(Oi(a), Oj(b)) ¯ ¯ ¯ ≤ ¯ ¯ ¯ λC |I(a)||I(b)| |IX(a)| i=1 |XI(b)| j=1 δ(Ii(a), Ij(b)) ¯ ¯ ¯+ ¯ ¯ ¯ (1−λ)C |O(a)||O(b)| |OX(a)| i=1 |OX(b)| j=1 δ(Oi(a), Oj(b)) ¯ ¯ ¯ ≤ λC |I(a)||I(b)| |IX(a)| i=1 |XI(b)| j=1 |δ(Ii(a), Ij(b))|+|O(1(a−)||λO)(Cb)| |OX(a)| i=1 |OX(b)| j=1 |δ(Oi(a), Oj(b))| ≤ λC |I(a)||I(b)| |IX(a)| i=1 |XI(b)| j=1 M + (1−λ)C |O(a)||O(b)| |OX(a)| i=1 |OX(b)| j=1 M =CM SoM = 0 when C 6= 1. 2
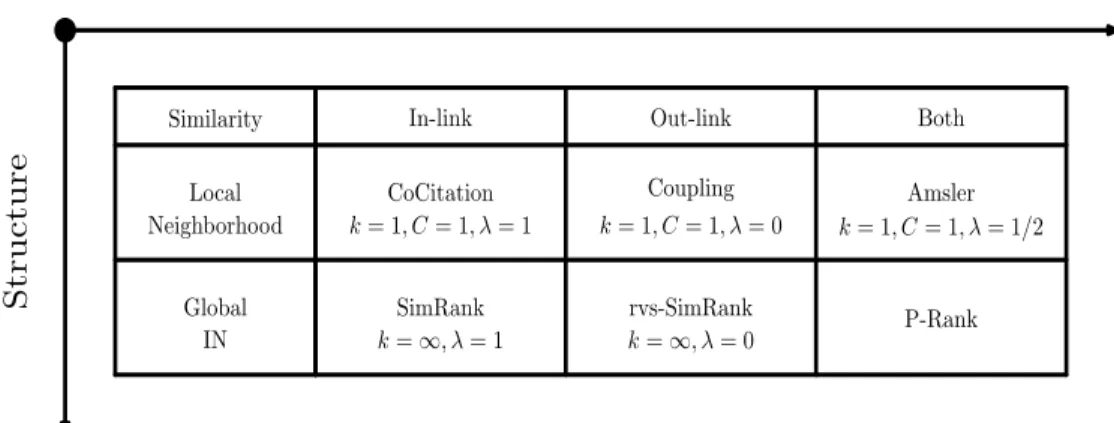
Relationship
Structure
Similarity In-link Out-link Both
Local Neighborhood CoCitation k= 1, C= 1, λ= 1 Coupling k= 1, C= 1, λ= 0 Amsler k= 1, C= 1, λ= 1/2 Global IN SimRank k=∞, λ= 1 rvs-SimRank k=∞, λ= 0 P-Rank
Figure 3.3: Structural Similarity Matrix for Information Networks
Theorem 3.3.1 demonstrates four important properties of P-Rank. For any verticesa, b∈
G, the iterativeP-Rank betweena and bis the same as that between b and a, i.e.,P-Rank is a symmetric measure, as mentioned in Property 1 (Symmetry). Property 2 (Monotonicity) shows that the iterative P-Rank is non-decreasing during similarity computation. However, the solution will not go to infinity. Property 3 (Existence) and 4 (Uniqueness) guarantee that there exists a unique solution to n2 iterative P-Rank equations, which can be reached
by iterative computation to a fixed point, i.e., the solution to iterative P-Rank converges to a limit which satisfies the recursive P-Rank equation, shown in Equation (3.1):
∀ a, b∈G, lim
k→∞Rk(a, b) =s(a, b) (3.5)
In real applications, iterative P-Rank converges very fast (details are shown in Section 3.4). Empirically, we can choose to fix a small number of iterations (k ≈5) to derive P-Rank for all pair of vertices in real world information networks.
3.3.3
Derivatives of P-Rank
Besides its semantic completeness with a consideration of both in- and out-link relationships in similarity computation, P-Rank outperforms other structural similarity measures by its generality and flexibility. As shown in Figure 3.3, most of the state-of-the-art structural
similarity measures proposed so far for information networks are illustrated in a structural similarity matrix. Among all measures shown in Figure 3.3,P-Rank enjoys the most general form, from both the semantic completeness perspective and the structure perspective. All other measures, such asCoCitation,Coupling,AmslerandSimRank, are just simplified special cases of P-Rank and can be easily derived from P-Rank. P-Rank therefore provides a unified framework for structural similarity computation in information networks. By analyzing the iterative P-Rank shown in Equation (3.4), we can draw the following conclusions:
1. When k = 1, C = 1 andλ= 1, P-Rank is reduced toCoCitation. 2. When k = 1, C = 1 andλ= 0, P-Rank is reduced toCoupling.
3. When k = 1, C = 1 and λ = 1/2, P-Rank is reduced to Amsler, which subsumes both CoCitation and Coupling. Amsler can be regarded as a one-step P-Rank without similarity propagation.
4. When k→ ∞ andλ = 1,P-Rank boils down toSimRank, which is an iterative form of CoCitation with no out-link similarity considered.
5. Whenk→ ∞andλ= 0,P-Rankis degenerated to a new structural similarity measure, which is an iterative form ofCouplingwith no in-link similarity involved. Since this new measure considers out-link relationships only and is the counterpart of SimRank, we name it rvs-SimRank, short for reverse-SimRank. In real world information networks, rvs-SimRank is more practical and useful than SimRank, because entities of a massive information network are usually widely distributed. It is prohibitive to maintain a global view of the whole information network for similarity computation. An entity may have a good knowledge of what entities are referenced by it, but it is hard to know what entities are referencing it without a full scan of the entire information network. For example, a Web page contains hyperlinks to other Web pages for its own sake, but it is impossible to know which Web pages are hyperlinking it without examining the
whole Web beforehand. This becomes even more severe when information networks are dynamically changing over time. So, rvs-SimRank is more robust and adaptive for measuring structural similarity over large yet dynamically changing information networks.
In real applications, P-Rank can be adapted flexibly to different information network settings, as long as there exist enough inter-linked relationships between entities. Even when the information network to be studied has sparse in-link information or biased edge distribution where SimRank may fail, P-Rank still can work well in modeling structural similarities.
Another important issue is to select appropriate values for parameters C, λ and k in P-Rank computation. C represents the degree of attenuation in similarity propagation, and λ expresses the relative weight of similarity computation between in-link and out-link directions. A priori knowledge of the information network usually helps select the values of
C andλ. By sampling a set of subgraphs from the original information network, we can also learn the characteristics of the underlying graph, so that C and λ can be set based on the sampled subgraphs as an approximation. The convergence of iterative P-Rank is fast with only several iterations of computation, so k is usually set empirically as a small constant number. In Section 3.4, we will systematically study the effects of different parameters on P-Rank computation.
3.3.4
Computing P-Rank
Based on Section 3.3.2, the solution to the recursive P-Rank formula (Equation (3.1)) can be reached by computing its iterative form (Equation (3.4)) to a fixed point. Algorithm 1 illustrates the iterative procedure for computing P-Rank in an information network, G. Let
n be the number of vertices in G and k be the number of iterations executed until P-Rank converges to its fixed point. For every vertex pair (a, b), an entry R(a, b) maintains the