Methodological approaches to
overcoming high dimensional barriers
This work was carried out in the ASCI graduated school. ASCI dissertation number: 386. This work is part of the research programme STW ImaGene with project number 12723, which is financed by the Netherlands Organisation for Scientific Research (NWO).
Financial support for the publication of this thesis the following organizations are gratefully acknowledged: NWO, the ASCI graduated school, the departments of Epidemiology, Radiol-ogy and Nuclear Medicine (Erasmus MC) and Quantib BV.
ISBN: 978-94-9301-450-3
Cover: Natalia Mishchenko
Layout: Ilse Modder, www.ilsemodder.nl
Printing: Gildeprint - Enschede, www.gildeprint.nl
© Gennady Roshchupkin, 2018
For all articles published, the copyright has been transferred to the respective publisher. No part of this thesis may be reproduced, stored in a retrieval system, or transmitted in any form or by any means, without written permission from the author or, when appropriate, from the publisher.
Methodological approaches to
overcoming high dimensional barriers
BEELDEN RELATEREN AAN GENETISCHE DATA
Methodologische benaderingen om hoog-dimensionale barrières te overwinnen
PROEFSCHRIFT
ter verkrijging van de graad van doctor aan de Erasmus Universiteit Rotterdam
op gezag van de rector magnificus Prof. dr. R.C.M.E. Engels
en volgens besluit van het College voor Promoties. De openbare verdediging zal plaatsvinden op
dinsdag 25 september 2018 om 13.30 uur
door
Gennady Vasilievich Roshchupkin geboren te Sergiev Posad, Rusland
Promotoren Prof.dr. W.J. Niessen
Prof.dr. M.A. Ikram
Overige leden Prof.dr.ir.B.P.F. Lelieveldt
Prof.dr. A.G. Uitterlinden
Prof.dr. M.W. Vernooij
1. Introduction
2. Searching for the best high-dimensional endophenotypes
2.1 Voxel-wise grey matter heritability in family-based and population-based studies.
2.2 Heritability of subcortical structures
3. High-dimensional phenotypes as a fine-mapping instrument 3.1 Fine-mapping the effects of Alzheimer’s disease risk loci on brain morphology 3.2 The neural substrate of cognition
4. Overcoming methodological issues
4.1 HASE: Framework for efficient high-dimensional association analyses
4.2 Sum ranking: a new method to quantify pleiotropic loci for multiple phenotypes 5. Application of the new imaging genetics approaches
5.1 Genetic architecture of the human anterior commissure
5.2 Genome-wide association study of cortical regions: thickness, surface area
and volume
5.3 Voxel-wise genome wide-association study of gray matter 6. General discussion 7. Summary Dutch Summary 8. Acknowledgements / Dankwoord List of Publications PhD portfolio About the author 11 19 21 49 69 71 103 135 137 157 175 177 195 217 229 247 250 253 261 267 271
Introduction
1
MANUSCRIPTS IN THIS THESIS
CHAPTER 2S. J. van der Lee *, G.V. Roshchupkin*, et al. (2017). “Gray matter heritability in fami-ly-based and population-based studies using voxel-based morphometry.” Human Brain Map-ping
G.V. Roshchupkin, B. A. Gutman, et al. (2016). “Heritability of the shape of subcortical brain structures in the general population.” Nature Communications
CHAPTER 3
G.V. Roshchupkin, H. H. Adams, et al. (2016). “Fine-mapping the effects of Alzheimer’s disease risk loci on brain morphology.” Neurobiology of Aging
H. I. Zonneveld*, G.V. Roshchupkin* et al “The neural substrate of cognition in general population.” Submitted
CHAPTER 4
G.V. Roshchupkin, H. Adams, et al. (2016). “HASE: Framework for efficient high-dimen-sional association analyses.” Scientific Reports
G.V. Roshchupkin et al “Sum Ranking, simple but powerful method for detecting pleiotro-pic loci.” In preparation
CHAPTER 5
H.H. Adams*, A. Teumer*, D.P. Hibar*, G.V. Roshchupkin* et al “Genetic architecture of the human anterior commissure.” In preparation
E. Hofer*, G.V. Roshchupkin*, et al. “GWAS of cortical thickness, surface area and vol-ume in cortical regions of interest.” Submitted
G.V. Roshchupkin et al „Genome-wide association studies of 1.5 million features of brain morphometry.“ In preparation
INTRODUCTION
Evidence that heredity, and later on genetics, shapes human brain structure and function has been accumulating for nearly two centuries1,2. However, the way in which this relation could be studied was quite limited for a long time. Many of the initial links that were observed be-tween genetics and brain structure arose from clinical observations of patients with a family history of diseases or observations during surgical interventions 3. In the last decades, through several revolutionary steps in both the field of imaging and genetics, our possibilities to study the relation between genetics and brain structure and function have dramatically increased. First, the development of magnetic resonance imaging (MRI) technology made it possible to observe human brain anatomy, function and pathology in vivo, and to study its changes during the lifespan. Subsequently, genotyping and other omics data technologies4 were devel-oped and became sufficiently cheap to allow to collect large datasets with sufficient statistical power to analyze genetic influence on the brain.
For a long time neuroimaging and genetics have developed independently, with most of brain related findings being driven by one of this field. A multitude of case-control genome-wide association studies (GWAS) have been conducted to screen the whole genome for causal loci of complex brain diseases5-7, without specifically using imaging information. At the same time, in the imaging domain, researchers compared MRI brain scans from healthy persons and pa-tients in an attempt to reveal spatiotemporal patterns of brain changes related to disease8-10. This has led to a situation where we have many genetic variants which have been linked to diseases, and knowledge which brain regions are affected by disease, but almost no clue if and how genetic variants, linked with disease, associate with brain structures.
Owing to the increasing availability of studies with both genetic and imaging data11, a new research domain has developed in the last decade, i.e. the field of imaging genetics. Within the neuro domain, this has become a very active and rich research field. By combining genetic and neuroimaging data we do not only have new opportunities to significantly improve our understanding of brain genetic architecture but we also have the potential to discover genetic disease factors, by directly linking variants to brain structures. For example, if a gene is found that influences hippocampus volume or shape, it is quite possible that this gene plays a role in illnesses associated with changes in the hippocampus (e.g., Alzheimer disease).
Recently, due to large-scale international efforts by researchers organized in different consor-tiums, such as CHARGE and ENIGMA, several large-scale GWAS studies of brain structures have been performed12,13 (the combined dataset includes more than 30.000 scans collected from all over the world). These studies have found new loci with potential links to
neurode-generation, Alzheimer’s disease, microcephaly, and schizophrenia. While this is a fantastic result, this is only the tip of the iceberg of how the field of imaging genetics can contribute to our understanding of brain genetics.
Like any emerging field, imaging genetics has its own challenges and issues. Despite the evidence that most of the neuropsychiatric disorders are to varying degrees genetically deter-mined14, unraveling which genetic variants are responsible for such effect remains difficult. One way to address this challenge is to use so-called endophenotypes in the analysis. An endophenotype is a phenotype which is assumed to have a simpler genetic architecture or reduced genetic complexity than other phenotypes, and which has a higher penetrance for genetic variants because they are biologically closer to the genes. The advantages of en-dophenotypes is not only in increasing statistical power in gene discovery studies, but also, especially for neuroimaging, in improved interpretability and insight into underlying degener-ative and developmental conditions.
Determining which the optimal imaging endophenotypes are is non-trivial. Currently, in neu-roimaging studies mainly aggregate measures such as volume, mean cortical thickness or surface area are mostly used. These are limited in the sense that they do not capture the complexity of brain structures. For example, the hippocampus is made up of several subfields, each with partially independent functional roles, as well as thalamus consist of multiple nu-clei. The same is known for the cerebral cortex, it has been shown that genetic influence and genetic correlation between different regions does not necessarily overlap with biologically defined boundaries15.
Using more-refined brain mapping techniques allows localizing genetic effects to specific tissue layers and sub-regions as opposed to using aggregate measures. Studying the relation between genetics and brain anatomy, at the higher resolution, would likely benefit research-es aimed to advance our understanding of the brain and of the underlying neurobiology of complex disorders.
Neuroimaging methods are now able to provide hundreds or even thousands of different types of high-dimensional (HD) phenotypes, and it is therefore critical to select the most appropriate for analysis. Not all of them have genetic architecture or provide additional in-formation beyond the standard measures.
Therefore, the overall aim of this thesis is to address a number of challenges in imaging ge-netics field. First, to demonstrate the utility of high-dimensional neuroimaging phenotypes for genetics analysis. Second, to develop methods and software which are able to handle
compu-tationally and data size wise the HD imaging genetics analysis. Third, to apply such technique on multi-center level and discover the genetic architecture of HD phenotypes.
In chapter 2, we explore two different HD endophenotypes and their relevance for genetic analysis. First, in chapter 2.1, using voxel-based morphometry (VBM), we study gray matter density on the voxel level (the highest level of possible resolution derived from MRI). We inves-tigate to what extent gray matter density at the voxel level is heritable (how much of variability can be explained by genetics) and analyze the consistency of results between different popu-lations. In chapter 2.2 we propose subcortical shapes as a new endophenotype for genetic analysis and study their genetic architecture in relation to volumetric measures.
Chapter 3 focuses on the application of these endophenotypes in population studies. In chapter 3.1 we describe the relation between brain gray matter voxels and genetic variants of Alzheimer Disease. We also introduce a novel technique which integrates 3D brain maps of genes expression with spatially localized associations from VBM results. In chapter 3.2, we demonstrate how HD phenotypes can help in mapping the relation between brain and cognitive functions.
Given the enormous potential of high-dimensional phenotypes and the increasing availabil-ity of large biobank initiatives with hundreds of thousands participants with both MRI and omics data, it becomes crucial to have methodology to be able to effectively analyze such large datasets. In chapter 4.1 I developed a framework (HASE) which dramatically reduces computational time for HD GWAS analysis from years to only hours and implemented a new meta-analytical approach, which requires just several gigabytes to be exchanged between collaborators, compare to terabytes in conventional methods.
At the same time, multi-center and consortia efforts make GWAS summary data more easily accessible for many different diseases and phenotypes. Therefore approaches to mine bio-logically meaningful information from such summary statistic, without access to the raw data, become indispensable. In chapter 4.2, I propose a new method for pleiotropy detection, the phenomena when one gene affects many outcomes. This method is very powerful for single loci pleiotropy detection and only requires GWAS summary data.
In chapter 5.2, 5.3, I apply the HASE framework for GWAS analyses of neuroimaging phe-notypes. In chapter 5.2 we performed GWAS analyses of cortical thickness, surface area and volume in the whole cortex as well as in 34 regions of interest in 22.000 individuals from 18 cohorts within the CHARGE consortium and UK Biobank. In chapter 5.3 we collected VBM data from several cohorts (more 18.000 subjects) and were able to perform HD
vox-el-wise genome-wide association study (1.5 million GWASes) just within 20 hours.
Finally, Chapter 6 provides a broader discussion of the main findings and results of this thesis, along with my opinion about the future perspective of the imaging genetics field and directions of further research.
1. Jacyna, S. The most important of all the organs: Darwin on the brain. Brain132, 3481-3487, doi:10.1093/ brain/awp283 (2009).
2. Cowan, W. M., Harter, D. H. & Kandel, E. R. The emergence of modern neuroscience: Some implications for neurology and psychiatry. Annu Rev Neurosci23, 343-391, doi:DOI 10.1146/annurev.neuro.23.1.343 (2000). 3. Tanzi, R. E. Genetic linkage studies of human neurodegenerative disorders. Curr Opin Neurobiol1, 455-461
(1991).
4. Karczewski, K. J. & Snyder, M. P. Integrative omics for health and disease. Nat Rev Genet 19, 299-310, doi:10.1038/nrg.2018.4 (2018).
5. Lambert, J. C. et al. Meta-analysis of 74,046 individuals identifies 11 new susceptibility loci for Alzheimer’s di-sease. Nature genetics45, 1452-1458, doi:10.1038/ng.2802 (2013).
6. Nalls, M. a. et al. Large-scale meta-analysis of genome-wide association data identifies six new risk loci for Parkin-son’s disease. Nature genetics056, 1-7, doi:10.1038/ng.3043 (2014).
7. Smoller, J. W. et al. Identification of risk loci with shared effects on five major psychiatric disorders: a genome-wide analysis. Lancet381, 1371-1379, doi:10.1016/S0140-6736(12)62129-1.Identification (2013).
8. Ellison-Wright, I. & Bullmore, E. Meta-analysis of diffusion tensor imaging studies in schizophrenia. Schizophrenia research108, 3-10, doi:10.1016/j.schres.2008.11.021 (2009).
9. Ikram, M. A. et al. Brain tissue volumes in relation to cognitive function and risk of dementia. Neurobiology of aging31, 378-386, doi:10.1016/j.neurobiolaging.2008.04.008 (2010).
10. Zhang, T. & Davatzikos, C. Optimally-Discriminative Voxel-Based Morphometry significantly increases the ability to detect group differences in schizophrenia, mild cognitive impairment, and Alzheimer’s disease. NeuroImage79, 94-110, doi:10.1016/j.neuroimage.2013.04.063 (2013).
11. Thompson, P. M. et al. The ENIGMA Consortium: large-scale collaborative analyses of neuroimaging and genetic data. Brain imaging and behavior8, 153-182, doi:10.1007/s11682-013-9269-5 (2014).
12. Adams, H. H. H. et al. Novel genetic loci underlying human intracranial volume identified through genome-wide association. Nature Neuroscienceid, doi:10.1038/nn.4398 (2016).
13. Hibar, D. P. et al. Common genetic variants influence human subcortical brain structures. Nature8, doi:10.1038/ nature14101 (2015).
14. Zheng, J. et al. LD Hub: a centralized database and web interface to perform LD score regression that maximizes the potential of summary level GWAS data for SNP heritability and genetic correlation analysis. Bioinformatics33, 272-279, doi:10.1093/bioinformatics/btw613 (2017).
15. Chen, C. H. et al. Hierarchical genetic organization of human cortical surface area. Science335, 1634-1636, doi:10.1126/science.1215330 (2012)
Searching
for the best
high-dimensional
endophenotypes
2
CHAPTER 2.1
Grey matter heritability
in family-based and
population-based studies
ABSTRACT
BackgroundThe combination of genetics and imaging has improved our understanding of the brain through studies of aggregate measures obtained from high-resolution structural imaging. Voxel-wise analyses have the potential to provide more detailed information of genetic in-fluences on the brain. Here we report a large-scale study of the heritability of grey matter at voxel resolution (1×1×1mm).
Methods
Validated voxel-based morphometry (VBM) protocols were applied to process magnetic re-sonance imaging data of 3239 unrelated subjects from a population-based study and 491 subjects from two familybased studies. Genome-wide genetic data was used to estimate voxel-wise gray matter heritability of the unrelated subjects and pedigree-structure was used to estimate heritability in families. We subsequently associated two genetic variants, known to be linked with subcortical brain volume, with most heritable voxels to determine if this would enhance their association signals.
Results
Voxels significantly heritable in both estimates mapped to subcortical structures, but also voxels in the language areas of the left hemisphere were found significantly heritable. When comparing regional patterns of heritability, familybased estimates were higher than popula-tion-based estimates. However, regional consistency of the heritability measures across study designs was high (Pearson’s correlation coefficient=0.73, p=2.6×10⁻¹³). We further show enhancement of the association signal of two previously discovered genetic loci with subcor-tical volume by using only the most heritable voxels.
Conclusion
Grey matter voxel-wise heritability can be reliably estimated with different methods. Com-bining heritability estimates from multiple studies is feasible to construct reliable heritability maps of grey matter voxels.
INTRODUCTION
The human brain shows large inter-individual variation, which could be explained by genetic and environmental influences. Studying these influences is essential in better understanding brain structure and function. The degree to which genetics explains phenotypic variation, in other words heritability, depends on many factors: the actual genetic contribution to the trait, environmental effects, measurement error, study design and sample characteristics.1-3 Recent-ly an overview was published of fifty years of worldwide heritability research in twins encom-passing thousands of traits, showing heritability studies are highly informative on how large the genetic contribution to a trait is.4 Heritability studies could aid future genetic research to focus on particular regions of interest in the brain. For example, large scale genetic studies of brain structures with the highest heritability typically yield the most findings.5 When studying the multitude of measures of voxel based magnetic resonance imaging (MRI), limiting genetic studies to the most heritable traits could be feasible in light of multiple testing. Recent studies have focused on heritability of detailed MRI measures at a voxel level.6-12 Different study designs showed comparably high estimates for white matter tract heritability in twin pairs,9,12 sib-pairs,7 and extended pedigrees (heritability = 50-90%).10 The heritability of grey matter was studied by voxel-based morphometry (VBM) previously,13-15 but the studies were relatively small and relatively large voxels were studied. Moreover, heritability of grey matter VBM has not been estimated in population-based studies.
Here, we perform a large multi-site study to estimate the voxel-wise heritability of grey matter. We calculate pedigree-based heritability in two family-based studies and heritability based on genome-wide genetic data in a large population-based study of unrelated subjects. Using these approaches, we created two grey matter heritability maps and described which regions contain significantly heritable voxels in both designs. We furthermore estimated overall regi-onal consistency of the heritability measures across study designs and explored if usage of our heritability maps could potentially enhance association signals of two genetic variations, previously discovered by genome-wide association studies.5,16,17
METHODS
STUDY SUBJECTS AND IMAGING PROTOCOL
Rotterdam Study – The Rotterdam Study is a population-based cohort study among inhabi-tants of a district of Rotterdam (Ommoord), The Netherlands, and aims to examine the de-terminants of disease and health in the elderly with a focus on neurogeriatric, cardiovascular, bone, and eye disease.18 In 1990 to 1993, 7983 persons participated and were re-examined every 3 to 4 years (RS-I). In 2000 to 2001 the cohort was expanded by 3011 persons who had not yet been part of the Rotterdam Study (RS-II). All participants had DNA extracted from blood at their first visit. In 2006-2008 a second expansion (RS-III) of 3,932 persons aged 45 and over was realized. Genotyping was performed at the Human Genotyping Facility, Ge-netic Laboratory Department of Internal Medicine, Erasmus MC, Rotterdam. Genotypes were imputed to the 1000 genomes phase I version 3 reference panel, using standard methods and software.19 From 2005 onwards MRI is part of the core protocol of the Rotterdam study.20 For this study a total of 4071 unique study participants had both MRI and genetic data and were available for analysis. The Rotterdam Study has been approved by the Medical Ethics Committee of the Erasmus MC and by the Ministry of Health, Welfare and Sport of the Nether-lands, implementing the Wet Bevolkingsonderzoek: ERGO (Population Studies Act: Rotterdam Study). All participants provided written informed consent to participate in the study and to obtain information from their treating physicians.
Erasmus Rucphen Family (ERF) – The ERF study is a family-based cohort study in a genetically isolated population from a community in the South-West of the Netherlands (Rucphen muni-cipality) including 3,000 participants. Participants are all descendants of a limited number of founders living in the 19th century, and all of Caucasian European descent. Extensive genea-logical data is available for this population. The study population is described in detail else-where.21 In a follow-up analysis, non-demented hypertensive (systolic blood pressure ≥ 160, diastolic blood pressure ≥ 100 or use of antihypertensive medication) subjects aged 55-75 years were included for a new battery of tests, including MRI scanning.22 These 122 partici-pants from the ERF were related to each other in one large pedigree. This large pedigree was split into multiple small pedigrees for heritability calculations (pedcut version 1.19 http://mga. bionet.nsc.ru/soft/). Participants related to each other in 27 families with in total 880 relatives. The average size of the pedigrees was 32.6 relatives (range 20-44) with on average 4.5 par-ticipants with MRI per family. All parpar-ticipants gave informed consent to participate in the study and to obtain information from their treating physicians. The study was approved by the medi-cal ethics committee at Erasmus MC University Medimedi-cal Center, Rotterdam, The Netherlands. MRI scanning for ERF and the Rotterdam Study was done on the same 1.5 T MRI unit (GE
Healthcare, Milwaukee, USA, Signa Excite software version 11×) fitted with a dedicated 8-channel head coil. The T1-weighted, proton density-weighted (PDw) and fluid-attenuated inversion recovery (FLAIR) sequences were used.20 For the purpose of segmentation, the T1w scan is acquired in 3D at high in-plane resolution and with thin slices (voxel size < 1 mm3).20 Austrian Stroke Prevention Study (ASPS) – The ASPS study is a single-center, prospective fol-low-up study on the effects of vascular risk factors on brain structure and function in the normal elderly population of the city of Graz, Austria. The procedure of recruitment and di-agnostic work-up of study participants has been described previously.23,24 Between 2006 and 2013 the study was extended for the Austrian Stroke Prevention Family Study (ASPS-Fam).25 Study participants of the ASPS and their first grade relatives were invited to enter ASPS-Fam. Inclusion criteria were no history of previous stroke or dementia and a normal neurological examination. In total 176 families connecting a total of 719 relatives, among which 369 were study participants with brain-MRI. The average size of the pedigrees was 4 (range 1-10) relatives with on average 2.4 participants with MRI per family. The diagnostic work-up was identical to the original study. The study protocol was approved by the ethics committee of the Medical University of Graz, Austria, and written and informed consent was obtained from all subjects. MRI scanning of the ASPS-Fam was done on a 3.0 T Tim Trio (Siemens, Erlangen).
T1-MPRAGE 1×1×1mm was used for image processing.25
IMAGE PROCESSING
Prior to analysis, a number of pre-processing steps were performed. For multispectral image analysis, the different scans were spatially registered using rigid registration 20. Subsequently, the brain was extracted from the scan. Hereto a manually segmented brain mask, which excludes cerebellum, eyes and skull, was non-rigidly registered to the T1-weighted image using Elastix.20 Finally, scans were corrected for intensity non-uniformity using the N3 method; non-uniformity correction was carried out within the brain mask.20 All T1-weighted images were segmented into supra-tentorial grey matter (GM), white matter (WM) and cerebrospinal fluid (CSF). For the Rotterdam Study and ERF, we used a previously described kNearest-Neig-hbor (kNN) algorithm, which was trained on six manually labeled atlases.26 For the ASPS-Fam study a Quantib BV tissue segmentation tool was applied (www.quantib.org). Quantib® soft-ware implements the same algorithm, which we then used for tissue segmentation in the Rot-terdam Study and ERF. There are thus no methodological differences between the methods, both of them based on kNN-based segmentation training on manually labeled subjects for segmenting GM, WM and CSF.
Voxel-based morphometry (VBM) was performed by the same optimized VBM protocol in all three studies27 and previously described.28 FSL software29 was used for VBM data processing.
First, all GM density maps were non-linearly registered to the standard GM probability tem-plate. For this study we chose the MNI152 GM template (Montreal Neurological Institute)
with a 1×1×1 mm voxel resolution.30 The MNI152 standard-space T1-weighted average
structural template image is derived from 152 structural images, which have been warped and averaged into the common MNI152 coordinate system after high-dimensional nonlinear registration. A spatial modulation procedure was used to avoid differences in absolute grey matter volume due to the registration. This involved multiplying voxel density values by the Jacobian determinants estimated during spatial normalization. To decrease signal to noise ratio, all images were smoothed using a 3 mm (FWHM 8 mm) isotropic Gaussian kernel. Thus all results are in MNI space. Brain regions were segmented using atlas-based segmentation based on the Hammer atlas.31 The modulation step in the VBM pipeline preserves the volume of a particular tissue within a voxel. The multiplication of the voxel values in the segmented images by the Jacobian determinants derived from the spatial normalization step allows us to calculate volumes by aggregating voxels. In total we estimated heritability for 1,405,508 grey matter voxels in all three studies.
REPRODUCIBILITY VBM MEASURES
We investigated the test-retest reliability of the VBM measures in a subset of 83 persons who were scanned twice within 1-9 weeks. We quantified the reproducibility by calculating the in-traclass correlation (ICC) of the gray matter density measures for every voxel (Online viewer, Supplementary Figure 1).32
HERITABILITY ANALYSIS
Population-based heritability estimates were calculated using Genome-wide Complex Trait Analysis (GCTA v1.24)33 (http://cnsgenomics.com/software/gcta/) in the population-based Rotterdam Study. GCTA implements REML (restricted maximum likelihood) analysis, this meth-od compares genotypic similarity between individuals to their phenotypic similarity. Formula’s underlying the GCTA method to determine heritability estimates are described elsewhere3
and thoroughly explained in a commentary by the authors.34 The 1000 Genomes imputed
genotypes (Imputation quality (Rsq) > 0.5 and minor allele frequency (MAF) > 0.01) were used to create a genetic relationship matrix (GRM) in GCTA.35 The power of GCTA analysis is determined by pair-wise genetic relationships in the studied population.3,34 Therefore the three cohorts of the Rotterdam study were combined and analyzed as one in the voxel-wise herita-bility analysis. Pairwise genetic relatedness between all individuals (N=4,071) was calculated and for pairs with more than 0.02 genotype similarity35 one person was removed (N
removed = 832). REML analysis was then performed in the remaining 3,239 unrelated subjects using the GRM correcting for age and sex. All grey matter heritability was estimated once.
Family-based heritability was estimated using maximum-likelihood variance components me-thods implemented in the SOLAR (version 6.6.2) software.36 Formulas for the calculation of heritability estimates are described in detail elsewhere.36 Briefly, the algorithms in SOLAR employ maximum likelihood variance decomposition methods. The covariance matrix Ω for a pedigree of individuals is given by:
where σ2
g is the genetic variance due to the additive genetic factors, Φ is the kinship matrix representing the pair-wise kinship coefficients among all individuals, σ2
e is the variance due to individual-specific environmental effects, and I is an identity matrix (under the assumption that all environmental effects are uncorrelated among family members). Narrow sense heritability is defined as the fraction of phenotypic variance σ2
P attributable to additive genetic factors:
The variance parameters are estimated by comparing the observed phenotypic covariance matrix with the covariance matrix predicted by kinship (Almasy and Blangero, 1998). Signi-ficance of heritability is tested by comparing the likelihood of the model in which σ2
g is con-strained to zero with that of a model in which σ2
g is estimated. Twice the difference between the loge likelihoods of these models yields a test statistic, which is asymptotically distributed as a ½:½ mixture of a χ2 variable with 1 degree-of-freedom and a point mass at zero. If the algorithm converges SOLAR outputs the heritability value, the significance value (p), and the standard error for each voxel.8,36
ERF study and ASPS-Fam were not jointly analysed because ERF subjects were scanned on a 1.5T MRI and ASPS-Fam subjects on a 3.0T MRI. Instead inverse variance meta-analysis using heritability and heritability standard errors was performed in METAL 37 to boost power and improve stability of heritability estimates 6. Heritability estimates were calculated in both studies with age and sex as covariates. Variance component methods implemented in SOLAR are vulnerable for inflation if phenotypes have a leptokurtic to distribution. Therefore we ap-plied inverse normal transformations in SOLAR to all voxels, but some voxels still violated the distribution of too high residual kurtosis (kurtosis >0.9) and were therefore excluded.38 Non converging heritability estimates of 0 without standard errors were also excluded from the meta-analysis. In the family-based studies some voxels had valid p-values and a heritability of 1, but missing standard errors. These voxels were located in the middle of voxel-clusters with high heritability (online viewer reference) (close to 1). Therefore standard errors for such voxels were imputed to retain these voxels for meta-analysis. This resulted in imputation of
the standard error for 6.4% of voxels in the ERF study and a negligible percentage of voxels in ASPS-Fam (<0.001%).
ENHANCEMENT OF ASSOCIATION SIGNAL
We explored whether voxel heritability information could enhance the association of genetic variants with brain structures. The genetic variants most significantly associated with hip-pocampal volume (rs77956314 on 12q24.22, near the gene HRK) and putamen volume (rs945270 on 14q22.3, downstream of the gene KTN1) were selected from a recently publis-hed genome-wide association study on subcortical structures 5. To select the most heritable voxels in the hippocampus and putamen, we ordered them using three approaches. First, we ranked the voxels from low to high family-based heritability estimates. Second, we ranked them from low to high population-based heritability estimates. In the third approach we sum-med the ranks obtained from both the family- and population-based estimates and used the sum of the ranks to prioritize the voxels. Using these three approaches we excluded the voxels in a step-wise manner by removing the 5% least heritable voxels. For each step we computed the volume by summing the values of the remaining voxels. As a voxel represents grey matter density in 1 mm3, the sum of voxels gives the volume of grey matter. We determined the asso-ciation of the two genetic variants in an additive model with the volumes in linear regression analyses (adjusted for age, sex, and the first three principal components) and compared this to association of the volume derived from all voxels mapped to the structure (i.e. the total VBM-volume of the hippocampus or putamen). The p-value of the association of the genetic variants with the subsets of voxels divided by the p-value of the association of the genetic variants with the total VBM-volume was calculated to measure change in the strength of the association. Genetic effects were calculated in the three cohorts of the Rotterdam study separately (RS-I = 844, RS-II = 1003, RS-III = 2190) and were combined using an inverse variance weighted meta-analysis in METAL.37
STATISTICAL ANALYSIS
Descriptive statistics were compared using one-way ANOVA and chi-squared tests. To correct for multiple comparisons we applied FDR p-value thresholds39 for both population and family heritability separately to declare which voxels are significantly heritable.
RESULTS
POPULATION CHARACTERISTICS
Characteristics of the study population are shown in Table 1. The spread of the age of sub-jects in the ERF study (age range 55-76) was smaller compared to ASPS-Fam (38-86) and the Rotterdam Study (46-98) due to the fact that inclusion criteria for scanning was restricted to midlife (Table 1). However, the average age at the time of MRI-scanning of the cohorts was very similar, ranging from 64.3 (± 4.5) years in the ERF study, 64.9 (± 10.7) years in ASPS and 64.9 (± 10.7) in the Rotterdam Study (p = 0.86). The percentage of women was 52.5% in ERF, 60.4% in ASPS-Fam and 55.3% in the Rotterdam study, these differences were non-significant (p = 0.13) (Table 1).
HERITABILITY ESTIMATES
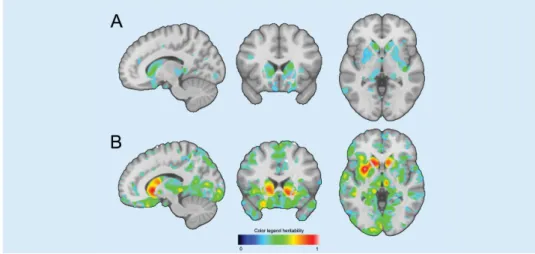
In total 454,184 (33.3% of all voxels) were FDR-significant in the family-based estimates. Mean heritability of significant voxels was 0.44 ± 0.12 SD (all voxels 0.29 ± 0.17 SD), with heritability estimates ranging from 0.23 to 1. In total 68,616 (4.9% of all voxels) were FDR-significant in the population-based estimates. Mean heritability of the significant voxels was 0.34 ± 0.04 SD (all voxels 0.11 ± 0.10), with heritability estimates ranging from 0.25 to 0.56. We found heritability of 44,349 voxels (3.2% of all voxels) to be FDR significant in the family- as well as the population-based heritability estimates. These significantly heritable voxels were clustered, mostly within subcortical brain structures (Figure 1). Table 2 shows the percentage of voxels that were significantly heritable of the total of voxels in a structu-re in both estimates, as well as the average structu-regional heritability, considering all voxel-wise heritability estimates. Highest percentage of significantly heritable in both estimates voxels were located in the caudate nucleus (right 72.4% and left 68.6%) followed by the putamen (right 57.5% and left 32.6%). Other subcortical structures with a large percentage of signi-ficantly heritable voxels were; left pallidum (32.2%), left nucleus accumbens (29.7%), right pallidum (28.5%), left amygdala (21.4%), left hippocampus (17.9%), left thalamus (14.4%), right amygdala (12.8%) and the right insula (11.4%). Apart from the subcortical structures, parts of the right lateral occipitotemporal gyrus (gyrus fusiformis) (10.4%), left straight gyrus (gyrus rectus) (10.4%), left subcallosal area (8.0%) and the left lingual gyrus (7.9%) harbored a proportion significantly heritable voxels (Figure 1 and Table 2).
FIGURE 1: Example of FDR-Significant voxels in both population-based (A) and family-based (B) estimates. Significant voxels cluster in subcortical structures, such as the caudate nucleus. All results can be interactive accessed ( www.ima-gene.nl/heritability) and downloaded from the website.
TABLE 1: Descriptive statistics
ERF ASPS-Fam RS p
Country Netherlands Austrian Netherlands Study type Family-based Family-based Population-based Field strength 1.5T 3.0T 1.5T Sequence T1-weighted T1-MPRAGE T1-weighted TR/TE (ms) 13.8/2.8 1900/2.19 13.8/2.8 TI (ms) 400 900 400 Flip angle (degrees) 20 9 20 Voxel size 1x1x1mm 1x1x1mm 1x1x1mm Minimum-maximum age 56-76 38-86 46-98
Age (± SD) 64.3 ± 4.5 64.9 ± 10.7 64.7 ± 10.7 0.86‡
Minimum-maximum age 56-76 38-86 46-98
Percentage females 52.5% 60.4% 55.3% 0.13†
N participants with MRI-scan 122 369 3239* Total relatives in pedigrees 880 718
-Descriptive statistics of the included studies.‡ p calculated with one-way ANOVA, † p chi-squared test. *The total number of
participants with brain magnetic imaging and genetics data in the Rotterdam study was 4071, but for pairs with more than 0.02 genotype similarity one person was removed (Nremoved = 832). MRI = Magnetic Resonance Imaging, ERF = Erasmus Rucphen
Family study, ASPS-Fam = Austrian Stroke Prevention Family Study, RS = Rotterdam Study, SD = standard deviation. T1-MPRAGE = T1 weighted 3D sequences with magnetization preparation, TR = repetition time, TE = echo time, TI inversion time.
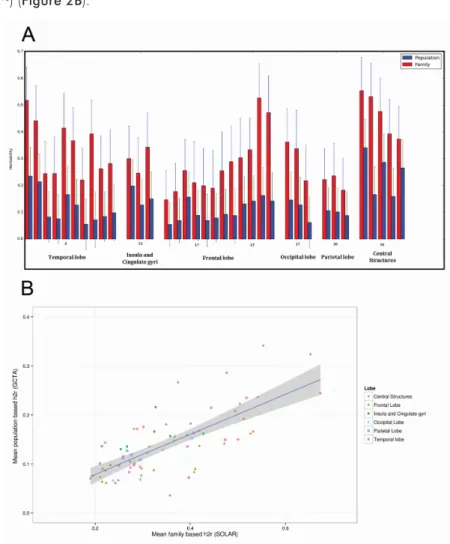
When comparing regional heritability, estimates calculated in families was always higher than the population-based estimates (p<0.001) (Figure 2A) and the difference in herita-bility between family-based estimates and population-based estimates was relatively stable (mean difference of regional heritability = 0.21 ± 0.08) (Table 2). Therefore, the regional heritability pattern of the family-based estimates significantly predicted the regional pattern of heritability in the population-based study (Pearson’s correlation coefficient = 0.73, p = 2.6 × 10⁻¹³) (Figure 2B).
FIGURE 2: A Barplot showing regional brain heritability. Structures that are in both the left as well as the right
hemi-sphere were averaged for this figure. It can clearly be seen that the heritability from family-based studies is higher than heritability form the unrelated population (P<0.001). B Scatter plot of the average regional heritability of all brain struc-tures. The correlation of the family-based and population-based estimates was high (Pearson’s correlation coefficient = 0.73, p = 2.6 × 10⁻¹³). Data points per structure correspond to family and population heritability in table 2.
FIGURE 3: Enhancement of the association signal of variants with the most heritable voxels of the hippocampus and putamen. A,B: Average heritability (y-axis) of the voxels in hippocampus (A) and putamen (B) given a percentage of the most heritable voxels in that region (x-axis) in steps of 5%. C,D: The -log(p-value) increase comparing the p-value of as-sociation with subsets of the most heritable voxels and all voxels in the region. The –log(p-value) increase for asas-sociation of hippocampal with rs77956314 (HRK gene) and putamen voxels with rs945270 (KTN1 gene) is shown. Associations were corrected for age, sex, and the first three principal components.
TABLE
2:
Regional heritability estimates
Lobe Structure N-vo xels P opulation significant (%) Family significant (%) Significant both (%) P opulation (±SD) Family (±SD) Δ h2 Temporal lobe Amygdala left 2328 21.4 79.6 21.4 0.21 (±0.09) 0.44 (±0.11) 0.23 Temporal lobe Amygdala right 2443 13 88.2 12.8 0.21 (±0.09) 0.49 (±0.10) 0.29 Temporal lobe
Anterior temporal lobe, lateral part left
5169 0.1 21.9 0.1 0.08 (±0.08) 0.27 (±0.16) 0.19 Temporal lobe
Anterior temporal lobe, lateral part right
5535 1.2 34.6 0.4 0.10 (±0.08) 0.27 (±0.14) 0.17 Temporal lobe
Anterior temporal lobe, medial part left
10427 3.3 33.9 0.9 0.09 (±0.09) 0.27 (±0.15) 0.18 Temporal lobe
Anterior temporal lobe, medial part right
11157 7.4 34.1 3 0.17 (±0.08) 0.29 (±0.10) 0.12 Temporal lobe
Gyri parahippocampalis et ambiens left
7411 10.7 66.5 6.8 0.17 (±0.10) 0.42 (±0.17) 0.25 Temporal lobe
Gyri parahippocampalis et ambiens right
7548 4.5 87.9 4.3 0.15 (±0.10) 0.50 (±0.12) 0.35 Temporal lobe Hippocampus left 3482 18.1 93.7 17.9 0.24 (±0.07) 0.52 (±0.15) 0.28 Temporal lobe Hippocampus right 3725 8.1 83.1 7.7 0.15 (±0.11) 0.47 (±0.16) 0.32 Temporal lobe
Lateral occipitotemporal gyrus (gyrus fusiformis) left
6603 0 69.5 0 0.07 (±0.07) 0.40 (±0.14) 0.32 Temporal lobe
Lateral occipitotemporal gyrus (gyrus fusiformis) right
6631 10.9 68.9 10.4 0.16 (±0.09) 0.41 (±0.15) 0.24 Temporal lobe
Medial and inferior temporal gyri left
23978 0 26.7 0 0.06 (±0.06) 0.24 (±0.14) 0.18 Temporal lobe
Medial and inferior temporal gyri right
24547 1.9 33.8 1.3 0.12 (±0.08) 0.26 (±0.17) 0.14 Temporal lobe
Posterior temporal lobe left
64214 3.5 28.5 2.3 0.10 (±0.10) 0.25 (±0.15) 0.15 Temporal lobe
Posterior temporal lobe right
64529 2.6 36.9 0.6 0.09 (±0.09) 0.29 (±0.16) 0.2 Temporal lobe
Superior temporal gyrus, anterior part left
6618 4.9 49.1 2.3 0.18 (±0.08) 0.30 (±0.09) 0.13 Temporal lobe
Superior temporal gyrus, anterior part right
6874 3 32.8 0.4 0.10 (±0.08) 0.28 (±0.12) 0.18 Temporal lobe
Superior temporal gyrus, central part left
17666 8.1 66.3 5.7 0.14 (±0.10) 0.39 (±0.12) 0.26 Temporal lobe
Superior temporal gyrus, central part right
18329 11.8 20.7 1.5 0.14 (±0.11) 0.22 (±0.13) 0.08 Parietal L obe
Postcentral gyrus left
39052 4 35 2.3 0.11 (±0.09) 0.29 (±0.17) 0.19 Parietal L obe
Postcentral gyrus right
34055 4.7 30 1.7 0.13 (±0.10) 0.27 (±0.15) 0.14 Parietal L obe
Remainder of parietal lobe left (including supramarginal and angular gyrus)
56090 8.3 21 2.4 0.14 (±0.11) 0.21 (±0.15) 0.08 Parietal L obe
Remainder of parietal lobe right (including supramarginal and angular gyrus)
55452 4 18 1.1 0.10 (±0.10) 0.21 (±0.15) 0.11 Parietal L obe
Superior parietal gyrus left
53683 3.6 28.9 2.3 0.11 (±0.09) 0.26 (±0.16) 0.15 Parietal L obe
Superior parietal gyrus right
59456 2.8 32.1 1.6 0.12 (±0.09) 0.28 (±0.16) 0.16 Occipital L obe Cuneus left 15193 3.2 40.6 2.5 0.12 (±0.09) 0.31 (±0.17) 0.19 Occipital L obe Cuneus right 14886 6.6 51.6 5.8 0.13 (±0.10) 0.34 (±0.15) 0.21 Occipital L obe
Lateral remainder of occipital lobe left
61105 0.6 35.3 0.3 0.07 (±0.07) 0.30 (±0.16) 0.23 Occipital L obe
Lateral remainder of occipital lobe right
61419 0.4 21.9 0.3 0.07 (±0.08) 0.24 (±0.15) 0.17 Occipital L obe
Lingual gyrus left
18574 8.3 65.7 7.9 0.15 (±0.10) 0.40 (±0.14) 0.25
TABLE 2 CONTINUED
:
Regional heritability estimates
Lobe Structure N-vo xels P opulation significant (%) Family significant (%) Significant both (%) P opulation (±SD) Family (±SD) Δ h2 Occipital L obe
Lingual gyrus right
19412 10.5 60.2 6.1 0.15 (±0.11) 0.37 (±0.14) 0.22
Insula and Cingulate gyri
Cingulate gyrus, anterior (supragenual) part left
12284 6.3 27.6 1.3 0.14 (±0.10) 0.27 (±0.09) 0.13
Insula and Cingulate gyri
Cingulate gyrus, anterior (supragenual) part right
13770 1.1 23.4 0.1 0.13 (±0.08) 0.25 (±0.11) 0.12
Insula and Cingulate gyri
Cingulate gyrus, posterior part left
12016 13.2 40.1 6.9 0.17 (±0.12) 0.32 (±0.14) 0.16
Insula and Cingulate gyri
Cingulate gyrus, posterior part right
12643 6.7 51.9 5.6 0.16 (±0.09) 0.36 (±0.14) 0.2
Insula and Cingulate gyri
Insula left 20040 8.5 62.5 4.5 0.16 (±0.10) 0.43 (±0.16) 0.27
Insula and Cingulate gyri
Insula right 20796 20.6 46.3 11.4 0.22 (±0.10) 0.33 (±0.15) 0.11 Frontal L obe
Anterior orbital gyrus left
9240 0.1 25 0.1 0.07 (±0.07) 0.25 (±0.14) 0.18 Frontal L obe
Anterior orbital gyrus right
8652 0 11.4 0 0.10 (±0.08) 0.23 (±0.20) 0.13 Frontal L obe
Inferior frontal gyrus left
26296 1.3 33.6 0.3 0.08 (±0.08) 0.30 (±0.19) 0.22 Frontal L obe
Inferior frontal gyrus right
24054 0.7 11.3 0.2 0.07 (±0.08) 0.21 (±0.16) 0.14 Frontal L obe
Lateral orbital gyrus left
5264 0 59.3 0 0.04 (±0.05) 0.36 (±0.11) 0.32 Frontal L obe
Lateral orbital gyrus right
5348 0.3 42 0.1 0.09 (±0.10) 0.30 (±0.15) 0.21 Frontal L obe
Medial orbital gyrus left
8408 3.4 40.2 3.3 0.09 (±0.10) 0.32 (±0.15) 0.24 Frontal L obe
Medial orbital gyrus right
8486 4.6 27.2 3.9 0.10 (±0.10) 0.28 (±0.21) 0.18 Frontal L obe
Middle frontal gyrus left
53570 0.9 12.4 0.2 0.06 (±0.08) 0.21 (±0.17) 0.15 Frontal L obe
Middle frontal gyrus right
56150 1.4 9.5 0.2 0.07 (±0.08) 0.19 (±0.15) 0.12 Frontal L obe
Posterior orbital gyrus left
7098 0 58.8 0 0.09 (±0.07) 0.41 (±0.20) 0.32 Frontal L obe
Posterior orbital gyrus right
7469 8.5 38.6 5.5 0.14 (±0.11) 0.31 (±0.20) 0.18 Frontal L obe
Precentral gyrus left
44289 0.3 18.1 0 0.06 (±0.07) 0.22 (±0.14) 0.16 Frontal L obe
Precentral gyrus right
45058 1.3 24.1 0.8 0.09 (±0.09) 0.22 (±0.16) 0.13 Frontal L obe Pre
-subgenual anterior cingulate gyrus left
1888 0 84.3 0 0.08 (±0.05) 0.41 (±0.08) 0.32 Frontal L obe Pre
-subgenual anterior cingulate gyrus right
1166 2.6 90 0.3 0.14 (±0.07) 0.47 (±0.10) 0.33 Frontal L obe
Straight gyrus (gyrus rectus) left
5397 16.6 69.7 10.4 0.18 (±0.11) 0.35 (±0.10) 0.17 Frontal L obe
Straight gyrus (gyrus rectus) right
6467 6.7 41.5 3.5 0.17 (±0.11) 0.28 (±0.12) 0.11 Frontal L obe
Subcallosal area left
527 8 87.7 8 0.19 (±0.07) 0.51 (±0.11) 0.32 Frontal L obe
Subcallosal area right
496 4.2 92.5 4.2 0.16 (±0.09) 0.53 (±0.08) 0.36 Frontal L obe
Subgenual anterior cingulate gyrus left
1932 1.1 73.3 1.1 0.14 (±0.08) 0.42 (±0.10) 0.28 Frontal L obe
Subgenual anterior cingulate gyrus right
2044 1.9 60.5 1.9 0.16 (±0.09) 0.37 (±0.13) 0.21 Frontal L obe
Superior frontal gyrus left
69674 0.9 13.4 0.3 0.08 (±0.08) 0.20 (±0.16) 0.12 Frontal L obe
Superior frontal gyrus right
73393 1.3 14.2 0.4 0.09 (±0.08) 0.22 (±0.19) 0.13 Central Structures
Caudate nucleus left
6042 68.6 96.4 68.6 0.32 (±0.10) 0.65 (±0.13) 0.33 TABLE 2 CONTINUED :
Regional heritability estimates
Lobe Structure N-vo xels P opulation significant (%) Family significant (%) Significant both (%) P opulation (±SD) Family (±SD) Δ h2 Central Structures
Caudate nucleus right
6172 75.6 91.7 72.4 0.34 (±0.09) 0.55 (±0.15) 0.21 Central Structures
Nucleus accumbens left
580 29.7 92.2 29.7 0.24 (±0.10) 0.54 (±0.15) 0.31 Central Structures
Nucleus accumbens right
443 6.1 94.6 6.1 0.17 (±0.08) 0.53 (±0.09) 0.37 Central Structures
Pallidum (globus pallidus) left
1893 32.2 89.2 32.2 0.22 (±0.09) 0.50 (±0.11) 0.28 Central Structures
Pallidum (globus pallidus) right
1812 39.8 70.3 28.5 0.27 (±0.07) 0.37 (±0.11) 0.11 Central Structures Putamen left 7819 32.6 96.2 32.6 0.24 (±0.07) 0.67 (±0.14) 0.43 Central Structures Putamen right 7325 59.2 90.8 57.5 0.29 (±0.07) 0.48 (±0.14) 0.19 Central Structures Thalamus left 11142 15.2 76.2 14.4 0.18 (±0.10) 0.40 (±0.11) 0.22 Central Structures Thalamus right 10774 6.8 68.9 6.6 0.16 (±0.09) 0.39 (±0.13) 0.23
The average voxel-wise heritability in 72 brain structures from family
-based and population-based estimates. N = total number of tested voxels, Significant P
opulation (%) = per
-centage of N which was significant at F
alse discovery R
ate threshold q=0.05 in the population-based estimates. Significant family (%) = percentage of N which was significant at
False discovery R
ate threshold q=0.05 in family
-based estimates. Significant both (%) = percentage of N which was significant at F
alse discovery R
ate threshold q=0.05 in both
family
-based as population-based estimates. F
amily = mean family
-based heritability estimates per brain structure, P
opulation = mean population-based heritability estimates
per brain structure.
Δ
h2 = difference in regional heritability (F
amily
-P
TABLE 2 CONTINUED
:
Regional heritability estimates
Lobe Structure N-vo xels P opulation significant (%) Family significant (%) Significant both (%) P opulation (±SD) Family (±SD) Δ h2 Occipital L obe
Lingual gyrus right
19412 10.5 60.2 6.1 0.15 (±0.11) 0.37 (±0.14) 0.22
Insula and Cingulate gyri
Cingulate gyrus, anterior (supragenual) part left
12284 6.3 27.6 1.3 0.14 (±0.10) 0.27 (±0.09) 0.13
Insula and Cingulate gyri
Cingulate gyrus, anterior (supragenual) part right
13770 1.1 23.4 0.1 0.13 (±0.08) 0.25 (±0.11) 0.12
Insula and Cingulate gyri
Cingulate gyrus, posterior part left
12016 13.2 40.1 6.9 0.17 (±0.12) 0.32 (±0.14) 0.16
Insula and Cingulate gyri
Cingulate gyrus, posterior part right
12643 6.7 51.9 5.6 0.16 (±0.09) 0.36 (±0.14) 0.2
Insula and Cingulate gyri
Insula left 20040 8.5 62.5 4.5 0.16 (±0.10) 0.43 (±0.16) 0.27
Insula and Cingulate gyri
Insula right 20796 20.6 46.3 11.4 0.22 (±0.10) 0.33 (±0.15) 0.11 Frontal L obe
Anterior orbital gyrus left
9240 0.1 25 0.1 0.07 (±0.07) 0.25 (±0.14) 0.18 Frontal L obe
Anterior orbital gyrus right
8652 0 11.4 0 0.10 (±0.08) 0.23 (±0.20) 0.13 Frontal L obe
Inferior frontal gyrus left
26296 1.3 33.6 0.3 0.08 (±0.08) 0.30 (±0.19) 0.22 Frontal L obe
Inferior frontal gyrus right
24054 0.7 11.3 0.2 0.07 (±0.08) 0.21 (±0.16) 0.14 Frontal L obe
Lateral orbital gyrus left
5264 0 59.3 0 0.04 (±0.05) 0.36 (±0.11) 0.32 Frontal L obe
Lateral orbital gyrus right
5348 0.3 42 0.1 0.09 (±0.10) 0.30 (±0.15) 0.21 Frontal L obe
Medial orbital gyrus left
8408 3.4 40.2 3.3 0.09 (±0.10) 0.32 (±0.15) 0.24 Frontal L obe
Medial orbital gyrus right
8486 4.6 27.2 3.9 0.10 (±0.10) 0.28 (±0.21) 0.18 Frontal L obe
Middle frontal gyrus left
53570 0.9 12.4 0.2 0.06 (±0.08) 0.21 (±0.17) 0.15 Frontal L obe
Middle frontal gyrus right
56150 1.4 9.5 0.2 0.07 (±0.08) 0.19 (±0.15) 0.12 Frontal L obe
Posterior orbital gyrus left
7098 0 58.8 0 0.09 (±0.07) 0.41 (±0.20) 0.32 Frontal L obe
Posterior orbital gyrus right
7469 8.5 38.6 5.5 0.14 (±0.11) 0.31 (±0.20) 0.18 Frontal L obe
Precentral gyrus left
44289 0.3 18.1 0 0.06 (±0.07) 0.22 (±0.14) 0.16 Frontal L obe
Precentral gyrus right
45058 1.3 24.1 0.8 0.09 (±0.09) 0.22 (±0.16) 0.13 Frontal L obe Pre
-subgenual anterior cingulate gyrus left
1888 0 84.3 0 0.08 (±0.05) 0.41 (±0.08) 0.32 Frontal L obe Pre
-subgenual anterior cingulate gyrus right
1166 2.6 90 0.3 0.14 (±0.07) 0.47 (±0.10) 0.33 Frontal L obe
Straight gyrus (gyrus rectus) left
5397 16.6 69.7 10.4 0.18 (±0.11) 0.35 (±0.10) 0.17 Frontal L obe
Straight gyrus (gyrus rectus) right
6467 6.7 41.5 3.5 0.17 (±0.11) 0.28 (±0.12) 0.11 Frontal L obe
Subcallosal area left
527 8 87.7 8 0.19 (±0.07) 0.51 (±0.11) 0.32 Frontal L obe
Subcallosal area right
496 4.2 92.5 4.2 0.16 (±0.09) 0.53 (±0.08) 0.36 Frontal L obe
Subgenual anterior cingulate gyrus left
1932 1.1 73.3 1.1 0.14 (±0.08) 0.42 (±0.10) 0.28 Frontal L obe
Subgenual anterior cingulate gyrus right
2044 1.9 60.5 1.9 0.16 (±0.09) 0.37 (±0.13) 0.21 Frontal L obe
Superior frontal gyrus left
69674 0.9 13.4 0.3 0.08 (±0.08) 0.20 (±0.16) 0.12 Frontal L obe
Superior frontal gyrus right
73393 1.3 14.2 0.4 0.09 (±0.08) 0.22 (±0.19) 0.13 Central Structures
Caudate nucleus left
6042 68.6 96.4 68.6 0.32 (±0.10) 0.65 (±0.13) 0.33 TABLE 2 CONTINUED :
Regional heritability estimates
Lobe Structure N-vo xels P opulation significant (%) Family significant (%) Significant both (%) P opulation (±SD) Family (±SD) Δ h2 Central Structures
Caudate nucleus right
6172 75.6 91.7 72.4 0.34 (±0.09) 0.55 (±0.15) 0.21 Central Structures
Nucleus accumbens left
580 29.7 92.2 29.7 0.24 (±0.10) 0.54 (±0.15) 0.31 Central Structures
Nucleus accumbens right
443 6.1 94.6 6.1 0.17 (±0.08) 0.53 (±0.09) 0.37 Central Structures
Pallidum (globus pallidus) left
1893 32.2 89.2 32.2 0.22 (±0.09) 0.50 (±0.11) 0.28 Central Structures
Pallidum (globus pallidus) right
1812 39.8 70.3 28.5 0.27 (±0.07) 0.37 (±0.11) 0.11 Central Structures Putamen left 7819 32.6 96.2 32.6 0.24 (±0.07) 0.67 (±0.14) 0.43 Central Structures Putamen right 7325 59.2 90.8 57.5 0.29 (±0.07) 0.48 (±0.14) 0.19 Central Structures Thalamus left 11142 15.2 76.2 14.4 0.18 (±0.10) 0.40 (±0.11) 0.22 Central Structures Thalamus right 10774 6.8 68.9 6.6 0.16 (±0.09) 0.39 (±0.13) 0.23
The average voxel-wise heritability in 72 brain structures from family
-based and population-based estimates. N = total number of tested voxels, Significant P
opulation (%) = per
-centage of N which was significant at F
alse discovery R
ate threshold q=0.05 in the population-based estimates. Significant family (%) = percentage of N which was significant at
False discovery R
ate threshold q=0.05 in family
-based estimates. Significant both (%) = percentage of N which was significant at F
alse discovery R
ate threshold q=0.05 in both
family
-based as population-based estimates. F
amily = mean family
-based heritability estimates per brain structure, P
opulation = mean population-based heritability estimates
per brain structure.
Δ
h2 = difference in regional heritability (F
amily
-P
ENHANCEMENT OF ASSOCIATION SIGNAL
We explored if applying our heritability map could enhance the statistical association signal of previously discovered genome-wide significant loci. As expected the T-allele of rs77956314 (HRK) associated with a smaller total volume of the hippocampus (p = 5.1 x 10⁻⁷) and the C-allele of rs945270 (KTN1) significantly associated with larger total volume of the putamen (p = 4.3 x 10⁻³). When excluding the less heritable voxels the average heritability in the re-maining voxels increased (Figure 3A and 3B). With rising average heritability we observed a gradual decrease in p-values (Figure 3C), and consequently a more significant association of HRK with the more heritable part of the hippocampus. The maximum enrichment of associati-on was reached when the 10% most significantly heritable voxels when combining heritability information from family-based and population-based studies was used. This increase corres-ponds to a 95.9 times more significant association, as the p-value decreased from p=5.1 x 10⁻⁷ to p = 5.4 x 10⁻⁹. Using only the family-based estimates the association was 12.9 times more significant. A less substantial decrease in p-value was observed for the association of KTN1 with the more heritable part of the putamen (Figure 3D). The p-value decreased when restricting to voxels that belong to the 25% most heritable voxels from the only the family-ba-sed study. This corresponds to a 5.5 times more significant association (p-value decrease from p = 4.3 x 10⁻³ to p = 7.9 x 10⁻⁴).
DISCUSSION
In this study we presented grey matter voxel heritability maps at resolution of 1×1×1 mm from population- and family-based studies. First we found that clusters of voxels that are significantly heritable in family-based heritability estimates as well as in an unrelated popula-tion-based study are predominantly located in subcortical regions. Second, when comparing the overall regional patterns of voxel-wise heritability the family-based estimates were always higher compared to population-based estimates and predicted the population-based herita-bility estimates. Lastly, we showed that the heritaherita-bility estimates from our studies could be used to enhance the association signal of two genetic variants with subcortical volumes.
Voxels with significant heritability formed clusters within mainly the subcortical structures. This is in line with the findings of previous studies that the volumes of subcortical structure are among the most heritable in the brain.40 There are multiple explanations for this consistent finding. First, subcortical structures probably are under tight genetic control as they exert vital functions within the brain. The percentage of significantly heritable voxels was relatively low in the frontal and parietal lobes. Although intra-individual measurability was high throughout the brain (Supplementary Figure 1), intra-individual differences in cortical folding patterns could explain the lower heritability in frontal and parietal regions. These might give a reliable measurability of the voxels, while it makes comparisons of voxel values between individuals less meaningful, thus yielding a lower heritability compared with the subcortical structures. Finally, environmental effects could have a larger effect on cortical grey matter compared to subcortical structures. As the effects of non-genetic factors (e.g. lifestyle factors) accumulate over an individual’s lifetime, the heritability of total brain volume and brain structures volume was found to reduce in adulthood up until old age41 in line with the accumulation of environ-mental influences over age. Their reported maximum age was 70 years. We studied relatively old participants (~65 years), therefore study participants might have reduced estimated her-itability because of their older age.
Apart from the subcortical structures, we found three cortical regions in the left hemisphere, the dominant hemisphere in over 95% of individuals, involved in speech production and word processing to have more than 5% significant voxels; the subcallosal area (also called Broca area), central part of the superior temporal gyrus (contains Wernicke’s area) and the lingual gyrus. Moreover, their right counterparts contained less significant voxels compared to the left side. Language skills42 and brain networks 43 are thought to be under tight genetic control and the left hemisphere language areas have been found more heritable than the right hemisphe-re befohemisphe-re.14 Regions with significant heritability could in theory be connected by white matter connections, which in turn then also are under high genetic control, suggesting a common
genetic architecture. In a recent report evidence for this theory was found.44 Cortical thickness in some regions with high heritability, were connected by heritable white matter connections. These connections and the cortical regions were anatomically distant but showed significant genetically correlation.44
We found a relatively stable difference in the regional patterns of the total additive genetic heritability. The heritability calculated from familial relations was always higher than the total additive variance explained by all autosomal variants calculated in unrelated subjects. This known difference between family and population-based heritability estimates has been exten-sively described.45,46 The difference can in part be explained by overestimation of heritability in families due to sharing of environmental factors within the family. These factors are inter-preted as genetic effects and cause the overestimation of heritability in twin and nuclear family studies.47 Subjects in multi-generational families share less environmental factors. Therefore multi-generational families, as ASPS-Fam and especially the ERF study, are more likely to yield an unbiased estimate of heritability. However, we assumed that all environmental factors affecting brain voxel volume are uncorrelated among family members (unique environmen-tal effects) therefore some unassessed common environmenenvironmen-tal effects might be causing the higher heritability in our family-based estimates. At the same time an underestimation of the heritability calculated from genetic data in unrelated populations could occur because of an incomplete coverage of the causal variants and exclusion of rare variants. We used impu-ted data to increase coverage of the causal variants. Impuimpu-ted data provide a much denser coverage of the genome than only genotyped variants, but we did exclude rare variants (MAF<0.01) which may in part be responsible for some missing heritability.
The overall regional patterns of heritability from families strongly predicted the popula-tion-based heritability. This suggests that the regional pattern of variance explained by addi-tive genetic effects is similar across populations, despite different ways to measure heritability, study design and scanner types. On the website (http://www.imagene.nl/heritability) both the population-based estimates and the family-based estimates can be viewed separately and can be downloaded. Combining current maps with results from other studies will further increase accuracy of the heritability estimates.
HERITABILITY IN GENETIC STUDIES
Within the putamen and hippocampus we observed highly heritable clusters of grey matter voxels alternating with parts of the subcortical structures that were less heritable. Differences in heritability within structures might be due to technical limitations (e.g. voxels that are diffi-cult to measure) or due to genetic or functional correlations. We hypothesized that studying the genetics of only highly heritable voxels could enhance signals in imaging genetics, either
through reducing signal to noise ratio or through studying a more genetically homogeneous trait. We picked two genetic variants with a proven and strongly replicated biological effect, identified through genome-wide association studies, on the subcortical structure volume (hip-pocampus, putamen) to explore if enhancement was possible 5. We show enhancement of the statistical signal of almost hundred-fold for the association of HRK (rs77956314) with hippo-campal volume and a five-fold increase for the association of KTN1 (rs945270) with putamen volume. Based on Figure 3 we can deduct that for future genetic studies in both examples a maximum power for association analyses was observed using voxels with a heritability over ~0.3 from the population-based heritability estimates and a heritability over ~0.7 from family-based heritability estimates. Despite these encouraging results there are limitations of our analysis. First, we only tested two genetic variants in two subcortical structures. While we expect that the increased signal of genetic variants with more heritable voxels will not be limited to the two variants tested in current study, future studies applying this method should be performed to determine whether this truly is the case. Second, we calculated heritability estimates and genetic association of HRK and KTN1 variants with voxels in the same subjects of the Rotterdam Study. As voxels with a large (technical) measurement error have lower heri-tability and therefore were excluded first in our analysis, the decreased measurement error of the more heritable voxels could result in the more significant association of genetic variants. In other words, the enhancement of signal is a reflection of a higher signal to noise ratio. Also a higher test re-test reliability of the highly heritable voxels, reduce signal to noise ratio. Third, we used the same data for the calculation of population-based heritability estimates and ge-netic testing, resulting in a possible inflation of the increase in signal due to non-independen-ce.48 However, when only the family-based heritability estimates were used to select the voxels for genetic associations (Figure 3C,D) the analyses were independent. In these analyses, we still observed an increase in the signal – and the enhancement was actually even stronger for the putamen – arguing against inflation due to non-independence. However, for the hippo-campus the best enhancement was achieved using the combined sample when restricting to less than 55% the most significant voxels. While this could be due to non-independence, this is contradicted by the fact that the population-only results (i.e., fully dependent) are in fact worse at this and lower percentages. An explanation other than non-independence could be that the combined sample provides more accurate heritability estimates and therefore results in a better enhancement. Last, highly heritable voxels which are in close proximity of each other could share their genetic background. However finding a cluster of heritable voxels does not directly prove genetic correlation.
STRENGTHS AND LIMITATIONS
Major strengths of this study are the large sample size of the population based study and unified imaging processing. Subjects from ERF and the Rotterdam Study subjects were
scan-ned using the same 1.5T scanner, identical MRI protocols and images were processed with exactly the same software. The ASPS-Fam was scanned on a 3T scanner, but segmented using similar protocols and VBM processing was performed in the same way as ERF and the Rot-terdam Study. Important to note is that softwares used for tissue segmentation are different, but both implement the same kNN algorithm.26 The ERF and the Rotterdam Study both are both from the Netherlands, a genetically homogeneous country.49 The ASPS-Fam study is from Austria, Austrians likely have slightly different genetic architecture than the Dutch. Maximum likelihood iterative optimization was used to estimation heritability. The iterations are prone to convergence failures when sample sizes are small. The percentage of voxels that did not converge was 9% in ASPS-Fam (Nparticipants = 369) and 36% in ERF (Nparticipants = 122). The methods used for population-based estimation of heritability always output an estimate. It has been shown that not converging occurs frequently in small datasets in SOLAR producing conservative estimates.47,50 We further note that using only VBM to assess heritability of brain morphology is a limitation of the current study. Cortical thickness, surface area and other MRI measures, including tensor-based (i.e. deformation) morphometry (TBM)51,52 and shape analysis are all potentially interesting for future heritability and genetic studies. The differen-ces between measures have been attributed both to biology53,54 and methodology.55,56 Most probably, these measures reflect a different genetic architecture53 and should therefore be studied separately.
FUTURE PERSPECTIVES
Genetic association with several voxels within an anatomical structure is biologically relevant as it shows an important genetic contribution to a sub region of the structure. Apart from the biological relevance, this sub region of voxels could have clinical significance. For example, it was shown previously that subfields of the anatomically defined hippocampus contributed differently to schizophrenia57 and β-Amyloid load.58If only highly heritability brain voxels are
studied in future voxel-wise genome-wide association studies we do not expect statistical signals to be uniformly enhanced. However, for the tested genetic variant that was identified for putamen volume, we did find statistical enhancement. High heritability estimates capture a variety of sources that can affect power to detect associations, including lower signal to noise ratios and higher genetic homogeneity (i.e. genetic correlation). Using these benefits to increase statistical signal is desirable, irrespective of the underlying cause. Ideally we envision selecting groups of voxels for genetic studies based on high heritability and measured high genetic correlation. Genetic correlation can be calculated for any of the commonly used MRI-measures, but it would still require genetic testing of sufficiently powered (large) studies. A promising future direction would be to enable the calculation of genetic correlations, ge-netic association (millions of voxels times millions of gege-netic variants) and meta-analyses of these associations. Programs which make the calculation of genetic correlation and genetic