STATISTICAL ANALYSIS AND MODELING OF INTERNET TRAFFIC
IP-BASED NETWORK FOR TELE-TRAFFIC ENGINEERING
Murizah Kassim1, 2, Mahamod Ismail1 and Mat Ikram Yusof2
1Faculty of Engineering and Built Environment, Universiti Kebangsaan MalaysiaUKM, Bangi, Selangor, Malaysia 2Faculty of Electrical Engineering, Universiti Teknologi MARA UiTM, Shah Alam, Selangor, Malaysia
E-Mail: [email protected] ABSTRACT
This paper presents a statistical analysis and best fitted distribution model of internet traffic IP-based Network for tele-traffic engineering. One IP-based campus network architecture is studied which support of 16Mbps Committed Access Rate (CAR) speed line to Wide Area Network (WAN). Solarwinds network monitoring traffic toolbox is setup at the gateway router from inside campus network to the WAN in collecting real live throughput internet traffics. Daily throughput flows in Mbyte are collected in every ten minutes inter-arrival time. Statistical method on fitted Cumulative Distribution Function (CDF) is evaluated on collected throughput with Matlab software. Maximum Likelihood Estimator (MLE) technique is used to identify the maximum MLE log-likelihood which characterized as best fitted CDF distribution. Normal, Lognormal, Exponential and Weibull CDF fitted on throughput are presented. Among the four distributions, CDF Weibull is identified as the best traffic characteristic based on MLE maximum log-likelihood. Day7 is identified as best
fitted that presents fitted 2-parameter Weibull which is Scale α =641.04 and Shape β =1.36 and fitted 3-parameter Weibull
which is Scale α =551.76, Shape β =1.15 and threshold θ=63. Detail characteristics on day 7 and day 1 are presented and
taken as benchmark model for future traffic algorithm.These results are valuable on modeling future tele-traffic engineering algorithm like policing, shaping, scheduling or queue which is based in real IP-based campus network environment. It is also useful for future prediction of tele-traffic models.
Keywords: traffic modeling, statistical analysis, cumulative distribution function, internet traffic, throughput, ip-based network, traffic characterization, normal, lognormal, exponential, Weibull.
INTRODUCTION
Current internet traffic analysis is an important task in tele-traffic and network engineering today. Traffic evaluation is a need to cater new problems and develop new algorithm in providing reliable QoS. Many research on analyzed internet traffics are done for the past years which presented different or changes of internet flow characteristics in many areas (Ibrahim, Nor, & Khammas, 2014). Thus, regular identifications of internet characteristic is being focus where more new tele-traffic engineering algorithm are developed from time to time in providing best Quality of service (QoS) or new development in network communication. Many different research area on measuring, analyzing or characterization of internet traffic are done such as internet traffic anomaly identification (Xiong et al., 2014), green internet (Huang, Meng, Gong, Liu, & Duan, 2014), internet traffic behavior(Kuai, Feng, & Lin, 2014), traffic modeling (Arfeen, Pawlikowski, Willig, & McNickle, 2014) and QoS in bandwidth management (Kassim, Ismail, Jumari, & Yusof, 2012). Many factors or parameters involved in internet traffic characteristics. Some characteristics may look into traffic size which is packets, traffic performance in speeds, type of applications used, throughput or traffic
flow, bandwidth, protocols and many other factors. The
characterization of internet traffic in all these factors are also depended on the setup network architectures either it is wired, wireless, mobile and others.
An IP-based network is identified as one of a consistent and good protocol standard in wired network
architecture. Based on the confirm standard then many new applications and internet technology tools are developed on IP-based network protocol. Internet applications which run on IP-based Internet protocol is growing fasters and most communication network today need this application and it is easy to set up. Because of the growing need, internet network faces of high traffic or bandwidth used from time to time. Although many new or enhanced algorithm, method or scheme are developed to control network traffic in an IP-based network but still, organizations faces high volume of traffic used (Kassim et al., 2012). Thus, precise traffic analysis and characterization is applied to handle the issue of traffic performance. Traffic analysis with statistical traffic distribution is one method in estimating precise parameters in internet traffic characters. Certain algorithms are based on assuming intrinsic traffic characteristics which produced an inaccurate traffic modeling on certain network implementation. Some internet traffic flows are not rate adaptable. Some are typical of conversational like streaming traffic such as audio or video. Statistical method traffic analysis proved better with distribution theories example like Cumulative Distribution Function (CDF) and Probability Distribution Function (PDF). With statistical traffic analysis, real traffic estimation is measured, future system estimation is predicted and error function is evaluated. Details understanding on internet traffic like certain characteristics and estimated parameters statically would help engineers to predict new model or build new algorithm for future tele-traffic engineering. Example of
implemented algorithm in tele-traffic engineering are policing and shaping (Simion, 2012), queue(Priscilla & Sumathi, 2013; Yu, Yong, & Jiangdong, 2011), scheduling(Cao, Kodialam, & Lakshman, 2014) or data transfer strategy (Mahalakshmi, 2012). Real measurement with real traffic data helps to prove with an accurate result.
This paper presents a statistical analysis on internet traffic and best modeling distribution in a campus IP-based Network. A Study on campus network architecture is identified which support of 16Mbps Committed Access Rate speed line to Wide Area Network. Throughput internet traffics are collected using Solarwinds software and traffic box network monitoring which is setup at the gateway router. Daily throughputs in Mbyte are captured for 10 minutes inter-arrival time which are 144 tracers captured internet traffic. Throughputs are fitted to CDF distributions with Matlab. Maximum Likelihood Estimator (MLE) technique is used to analyze best fitted distribution. Best four CDF distributions fitted theories are presented which are Normal, Lognormal, Exponential and Weibull. Among the four identified distribution, Weibull is identified as the best traffic distribution modeling. Best fitted 2-parameter and 3-parameter Weibull are presented. A benchmark of internet traffic characteristic on throughput byte is presented based on the best fitted distribution. This research is benefits for future modeling in IP-based tele-traffic engineering.
INTERNET TRAFFIC CHARACTER MODELLING AND PEFORMANCE
Internet traffic characterization with real live internet data is modeled(Cisar & Cisar, 2014). Result present changes of technologies with new internet applications or flows has possibility changed the pattern of traffic distribution. Previous research presented that internet traffics are Poisson process but later internet traffic is identified as self-similar which produced Long Range Dependence (LRD) characteristics (Becchi, 2008; Karagiannis, Molle, Faloutsos, & Broido, 2004; Park, Hernández-Campos, Marron, & Smith, 2005). One proposed renewal theory-based on approximated point process models using statistical Pareto renewal process superposition and Weibull renewal process superposition are presented. Both models are successfully done using similar second-order scaling on internet traffic model (Arfeen et al., 2014). Research presents that characteristic of internet traffic may differ in many factors. Internet traffic also may depended on its perspective or type of flows example like peer to peer traffic, video, applications, protocols used like TCP or UDP and other factors. Compares to this literature review, this paper presents a research focus only on overall inbound internet throughput traffic taken from real live Campus IP-based network traffic.
Internet traffic characterization is high related to many performance issues in network. Network Performance is an important issue in QoS network especially in designing new management network traffic algorithm. Reliable network service may depend on speed
of the network. Thus, certain Network bandwidth or traffic flows have to be measured. Research found that frequent occurrences of flash flows of internet traffic highly affect the performance of the existing flow-based traffic monitoring systems. Using various flow-related metrics, research analyzes the IP traffic traces in modeling internet traffic (Kim, Won, & Hong, 2006). Burst traffic flows effects network performance when congestions happened in a network (Goswami, Pattanaik, Bharadwaj, & Bharti, 2014). This research presented a study on modeling traffic on a congestion control techniques using congestion notifications from network core to deal with congestion scenario which helps to reduce traffic burst.
METHODOLOGY
This paper present methodology which consist of two parts; The first part presents an analysis on real traffic throughput from a campus IP-based network. The second parts presents a statistical analysis using fitted CDF distribution with MLE log-likelihood technique. Mathematical model on the four identified CDF distributions are discussed.
Campus traffic captured
Figure-1. Campus network architecture for traffic
benchmark.
Figure-1 shows the IP-based architecture network in a Campus environment. The main campus network is connected with more than 24 other branch campuses in providing an IP Virtual Private Network (IP-VPN) to the main HQ campus. Although the main campus acts as main campuses but the implemented of Committed Access Rate (CAR) is setup individually to each branch campus. Thus, internet throughputs are individually monitored by each connected campus. One of the branch campus which supported 16 Mbps CAR to the internet WAN is taken as the benchmark in this research. Solarwinds software is setup at the gateway router for internet traffic collection. Inbound internet throughput in Mbyte is collected daily and weekly in 10 minutes inter-arrival time for 144 tracers and 1008 tracers. Comparison of daily throughput traffic characteristic and parameter identification are presented.
Figure-2 shows the captured interface details on the identified campus. The interface bandwidth shows a 16 Mbps speed received and transmitted on the available link. Current traffic shows the inbound utilization is higher than outbound traffic which is 95%. This interface details shows the captured at time at 7:13 am. The utilization may vary in time. Daily to 7 days throughput are collected and analyzed. Throughput are then evaluated and characterized with fitted CDF statistical distribution.
Figure-2. Interface detail on communication speed at
the WAN router.
Fitting traffic with CDF
Captured daily throughputs are fits with best four distributions. All parameters characteristic are identified according to type of CDF distribution. Mathematical equations referred to CDF distribution are used when modeling traffic which differentiates type of parameter used. Traffic character evaluation with statistical aspects of distributions are measured as prove an accurate data presentation to real network implementation. Thus, fitting traffic is important by choosing the best fit distribution. Certain internet traffic formulates it own characteristics. Four CDF mathematical models are explained in next section.
Maximum likelihood estimator
In statistics, maximum-likelihood estimation (MLE) is a method of estimating the parameters for a statistical model. When applied to a data set and given a statistical model, maximum-likelihood estimation provides estimates for the model's parameters. In general, for a fixed set of data and underlying statistical model, the method of maximum likelihood selects the set of values of the model parameters that maximizes the likelihood
function. The maximum likelihood estimate (MLE) of θ is
that value of θ that maximizes lik(θ): it is the value that
makes the observed data the most probable. The logarithm is an increasing function so it will be equivalent to maximize the log likelihood as in Equation (1).
MATHEMATICAL MODEL WITH CDF
Comparisons on mathematical CDF distribution are presented based on computational statistics math theories (Gentle, 2009). Each equation presents its own parameters and character which are used in modeling traffic(Walck, 2007).
Cumulative distribution function
CDF is the accumulated probability density
function (PDF) of F(x). Suppose F(x) is a density function
for a quantity, thus the CDF for the quantity is defined as Equation (2). In this identified throughput traffic the minimum value is 0.
Normal CDF
Normal distribution or called Gaussian distribution is a commonly occurring continuous probability distribution. It is probability statistics falls between any two real limits or real numbers, as the curve approaches zero on either side. Normal distributions are extremely important in statistics for real-valued random variables whose distributions are not known. The mathematical equation for normal CDF functions as in Equation (3). Three important parameters need to be
indentified which are datasets, x; mean, µ and standard
deviation, σ.
Lognormal CDF
In probability theory, a Lognormal distribution is a continuous probability distribution of a random variable whose logarithm is normally distributed. Thus, if the
random variable x is log-normally distributed, then
Y=log(x) has a normal distribution. Likewise, if Y has a
normal distribution, then X=exp(y) has a log-normal
distribution. A random variable which is log-normally distributed takes only positive real values. Equation (4) presents the mathematical CDF for Lognormal distribution. Three important parameters need to be
indentified which are datasets, x; mean, µ and standard
Exponential CDF
Exponential distribution is the probability distribution that describes the time between events in a Poisson process. Poisson process is an event occurs continuously and independently at a constant average rate. It is the continuous analogue of the geometric distribution, and it has the key property of being memoryless. Equation (5) presents the mathematical equation for Exponential
CDF. Here λ > 0 is the parameter of the distribution, often
called the rate parameter. The dataset is x.
Weibull CDF
The cumulative distribution function for Weibull
distribution normally is where dataset x > 0. Equation (6)
presents the mathematical equation function for 2-parameter Weibull CDF. Two main important identified
parameters for Weibull are shape, α and scale, β. Both
parameters can be measured from the real live traffic. In formulating new algorithm, parameter scale is important to be used as adaptive distribution with the best simulation result on the new algorithm.
RESULT ON THROUGHPUT INTERNET TRAFFIC ANALYSIS
Analyzed throughput traffic on best fits distributions are evaluated by using MLE. Results on analyzed character with associated parameter values according to model traffic distributions are presented.
Real internet campus traffic analysis
Analysis presented 114 and 1008 throughput internet traffic for daily and weekly tracers. Figure-3 presents daily throughput traffic which shows high throughput flows which is more than 1200 Mbytes. The identified threshold on real network for 16mbps speed line is identified at 1200 Mbytes for 10 minutes. Thus, real live internet traffic is analysed which presents that there are burst traffic exist in the network. The threshold line in green colour represents a 16 Mbps rate bandwidth which is shown as a real threshold guide in the graph. One day throughput presents about 10 tracer’s time burst traffic as shown in the Figure-3. Figure-4 presents the combined of
all 7 day internet throughput collection. The identified throughput presents a same burst traffic flow in a few tracers time which exceeds 1200 Mbytes flow. Based on the tracers also, it is identified that the peak time of traffic burst is between 08:00 until 20:00 which is in the day time of working hours. A new algorithm can be designed to make control on the burst internet traffic. This helps making Quality of Service (QoS) in traffic or bandwidth management on an IP-based network. They are no failures of throughput transferred or undelivered traffic during the captured time based on the identified figure which shows no value of 0 Mbyte in the tracers.
Figure-3. Day1throughput flow.
Figure-4. Weekly throughput flow.
Figure-5 presents the empirical Cumulative Distribution Function (CDF) on Day1 to Day 7 throughput in recognizing the internet traffic characteristics. The plotted graph presents mostly every daily throughput held burst traffic. Bytes burst are more than 2000 Mbyte which it may lead to traffic congestions and delay in throughput transfers. Thus traffic modelling can help in controlling burst traffic. Best fits using MLE is used to identify which CDF between days is the best fits.
Figure-5. Empirical CDF comparison on Day1 to Day
7 throughput flow.
RESULT ON PARAMETER ESTIMATES WITH FITTED CDF
Daily real live throughput traffics are fits to four nearest CDF distribution theories. Throughput traffic in a
day is presented as χ data. Important parameters based on
CDF fit distribution are identified and analyzed. Based on the mathematical equations different distribution may give different type of parameters that to be used in traffic modeling. The identified four nearest distribution that fit with the real live traffic throughput are Normal, Lognormal, Exponential and Weibull distributions. Thus,
fitting results on χ are as analyzed below.
Normal distribution analysis
Important parameters used in Normal CDF
distributions on χ data is Mean (µ) and Std Deviation (σ).
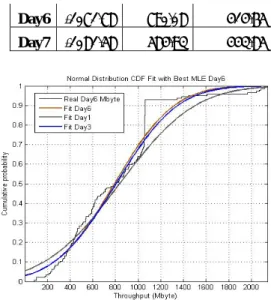
Table 1 presents analysis on identified fit CDF parameters which is measured using MLE in finding the most MLE log. The maximum MLE log is the best parameters. In this case seems all values are negative, the best MLE log is nearest to 0. Day 6 is identified as the best traffic parameter characteristic to be used as traffic modelling. Performing Normal (790.08, 414.65) is used as normal traffic modelling. Figure 6 presents the comparison of minimum, medium and maximum value of MLE on Normal CDF fits to daily Mbyte throughput. CDF normal presents Day6 with maximum MLE, day4 as medium MLE and day1 is the minimum MLE value. Thus, day6 present the best CDF normal fits.
Table-1. Estimated parameters on throughput (Mbyte) fit
to normal distribution.
MLE Mean (µ) Std Dev(σ)
Day1 -1104.95 837.76 522.06 Day2 -1091.96 780.86 477.05 Day3 -1076 804.78 427.00 Day4 -1083.68 869.16 450.39 Day5 -1082.4 759.73 446.41 Day6 -1071.78 790.08 414.65 Day7 -1081.58 584.93 443.85
Figure-6. Normal distribution CDF fit on best MLE
throughput Day 6.
Lognormal distribution analysis
Table-2 presents Lognormal CDF distributions
parameters on χ data. Lognormal distribution also presents
Mean (µ) and Std Deviation (σ) as important parameters
used. MLE on day 7 presents the maximum MLE log value which is nearest to value 0. Thus, day7 value of
Mean (µ) and Std Deviation (σ) shows the best parameters
characteristic in performing CDF Lognormal (6.05, 0.85) in future algorithm.
Figure-7 presents the comparison of minimum, medium and maximum value of MLE on Lognormal CDF fits to daily Mbyte throughput. CDF Lognormal presents Day7 with maximum MLE, day4 as medium MLE and day1 is the minimum MLE value. Thus, day7 present the best CDF lognormal fits based on IP-based network traffic.
Table-2. Estimated parameters on throughput (Mbyte) fit to Lognormal distribution.
MLE Mean (µ) Std Dev(σ)
Day1 -1133.39 6.34 1.12 Day2 -1107.83 6.37 0.91 Day3 -1093.73 6.49 0.73 Day4 -1093.75 6.59 0.66 Day5 -1076.5 6.43 0.69 Day6 -1068.98 6.52 0.60 Day7 -1050.93 6.05 0.85
Figure-7. Fit Lognormal CDF on best MLE throughput. Exponential distribution analysis
Table-3 presents Exponential CDF distributions
parameters on χ data. Exponential fits distribution on χ
presents Lambda (λ) as the important parameter in
modeling traffic. Day7 present the best parameter characteristic which shows it has the maximum MLE log
value. The parameter of Lambda (λ) shows the best
parameters value as highlights in yellow. Performing Exponential (584.93) is used as Exponential traffic modelling. Figure 8 presents the comparison of minimum, medium and maximum value of MLE value on Exponential CDF fits to daily Mbyte throughput. Plotted graph presents comparison of day1, day5 and day7 fits on real throughput CDF on day7. Day7 is identified as the best CDF fit distribution.
Table-3. Estimated parameters on throughput (Mbyte) fit
to exponential distribution. MLE Lambda (λ) Day1 -1113.23 837.759 Day2 -1103.1 780.858 Day3 -1107.44 804.784 Day4 -1118.52 869.155 Day5 -1099.15 759.732 Day6 -1104.79 790.081 Day7 -1061.5 584.931
Figure-8. Fit exponential CDF on best MLE throughput.
Weibull distribution analysis
Important parameters used in Weibull CDF
distributions on χ data is Scale (α) and Shape (β). Table 4
presents analysis on identified parameters. Day 7 presents the best traffic parameter characteristic to be used as traffic modeling which is highlighted in yellow. Performing Weibull (641.04, 1.36) is used as Weibull traffic modeling. Figure 9 presents the comparison of minimum, medium and maximum value of MLE on Weibull CDF fits to daily Mbyte throughput. Plotted graph presents comparison of day1, day4 and day7 fits on real throughput CDF on day7. Day 7 present the best fits CDF Weibull which also presents the maximum MLE value.
Table-4. Estimated parameters on throughput (Mbyte) fit
to Weibull distribution.
MLE Scale (α) Shape (β) Day1 -1102.92 908.501 1.41765 Day2 -1084.17 864.666 1.59291 Day3 -1071.37 903.186 1.92569 Day4 -1077.83 978.691 2.00489 Day5 -1069.42 855.138 1.77807 Day6 -1061.98 892.51 2.00911 Day7 -1051.96 641.04 1.3575
Figure-9. Fit CDF Weibull distribution on best MLE. BEST MODEL TRAFFIC CHARACTERIZATION
Table-5 presents comparison of MLE log value with four fitted distribution on all day’s traffic throughput. Weibull CDF distribution is identified as the best fitted among Normal, Lognormal and Exponential which present the maximum MLE log value. However, only day 7 fitted on CDF Lognormal has the maximum value compared to Weibull. The different is only by 1.03 point. Because of the small different for a day, this research identified the best result for best fit is Weibull distributions. Thus, parameters fit estimation for day 7 CDF Weibull is chosen as the best parameter evaluation in using as traffic modeling. Figure-10 presents CDF Fit Comparison with Normal, Lognormal, Exponential and Weibull on best MLE which is day7. Thus, plotted graph for Weibull in
dark below present the closest fit to the real captures throughput on the internet campus traffic.
Table-6 and Table-7 present best analysed fitted parameter estimation for CDF Weibull. Table-6 presents
fitted 2-parameter estimates for value Scale (α) and Shape
(β) with 95% lower bound and 95% upper bound. Table-7
presents fitted 3-parameter Weibull which is parameter α,
β and θ with 95% lower bound and 95% upper bound.
Table-8 presents the best internet traffic characterization
identification of day 7 based on throughput Mbyte flow. Day1 and day 7 analysed throughput characters are shown as comparison in modelling future traffic algorithm. Four
others Weibull shape parameter (β) are presented that can
be used in simulation and evaluation of future traffic control model.
Table-5. Comparison of MLE Log on normal, lognormal, exponential and Weibull daily throughput.
Day1 Day2 Day3 Day4 Day5 Day6 Day7
Normal -1104.95 -1091.96 -1076 -1083.68 -1082.4 -1071.78 -1081.58 Log-normal -1133.39 -1107.83 -1093.73 -1093.75 -1076.5 -1068.98 -1050.93
Exp. -1113.23 -1103.1 -1107.44 -1118.52 -1099.15 -1104.79 -1061.5 Weibull -1102.92 -1084.17 -1071.37 -1077.83 -1069.42 -1061.98 -1051.96
Figure-10. CDF fit comparison with normal, lognormal,
exponential and Weibull best MLE Day7.
Table-6. Fitted 2-parameter Weibull. Parameter Estimates Type Parameter Estimate
Lower 95% Upper 95% Scale Α 641.04 562.96 727.37 Shape Β 1.36 1.19 1.54
Table-7. Fitted 3-parameter Weibull. Parameter Estimates Type Parameter Estimate
Lower 95% Upper 95% Scale Α 551.76 472.91 641.01 Shape Β 1.15 1 1.3 Threshold Θ 63
Table-8. Throughput characterization and Weibull
parameter identification on modeling algorithm.
Parameter Symbol Value
Committed Access Rate, Speed,
S
16Mbps
Inter-Arrival Time, TA 10 minutes
Daily Captured Time
min
00:00 to 23:50
Daily Tracers Dt 144 times
Threshold BTh 1200MByte
Scale of day1 and day 7 α1, α7 908.501, 641.04} Shape of day1 β , {0.5, 1, 1.41765, 1.7, 2} Shape of day7 β 0.5, 1, 1.3575, 1.7, 2} Minimum throughput of day1 Bmin1 22.04MByte Minimum throughput of day7 Bmin7 63 MByte Maximum throughput of day1 Bmax1 2116.2 MByte Maximum throughput of day7 Bmax7 2120.8MByte CONCLUSIONS
A statistical analysis on internet traffic and best fitted modeling distribution in a campus IP-based Network is presented. Daily throughput inbound internet traffic in Mbyte are collected and analyzed. Four best fitted distribution are used which are Normal, Lognormal, Exponential and Weibull. CDF parameter characteristic estimation on the four distributions are presented and compared. Among the four identified distribution, Weibull is identified as the best traffic distribution which produced the maximum MLE log in all day’s analysis. Day 7 has
presented the best parameter estimation on the Weibull
CDF distributions that fitted on χ throughput daily data.
Results present fitted 2-parameter Weibull which are Scale
α =641.04 and Shape β =1.36 and fitted 3-parameter
Weibull which are Scale α =551.76, Shape β =1.15 and
threshold θ=63. Detail characteristic on day 7 and day 1 is
presented and taken as benchmark model for future traffic algorithm.This research is benefits in identifications of tele-traffic engineering in modeling internet traffic distribution with proved case in a campus IP-based network environment. Future traffic characteristic could be done in detail to cut-off certain error in the identified Weibull parameters.
ACKNOWLEDGEMENTS
Authors would like to thank Universiti Kebangsaan Malaysia, for support grant number LRGS/TD/2011/UKM/ICT/02/02 for this research. Authors also would also like to express deep appreciation to the Ministry of Education Malaysia (MOE) and Universiti Teknologi MARA for the financial funds in supporting postgraduate student in this research.
REFERENCES
Arfeen M. A., Pawlikowski K., Willig A. and McNickle, D. (2014). Internet traffic modelling: from superposition to scaling. Networks, IET, 3(1), 30-40.
Becchi M. (2008). From Poisson processes to self-similarity: a survey of network traffic models: Technical Report.
Cao Z., Kodialam M. and Lakshman, T. (2014). Joint Static and Dynamic Traffic Scheduling in Data Center Networks. Paper presented at the Proceedings IEEE INFOCOM.
Cisar P. and Cisar S. M. (2014). Approximation of Internet traffic in wavelet domain. Paper presented at the 2014
IEEE 12th International Symposium on Intelligent Systems
and Informatics (SISY).
Gentle J. (2009). Computational statistics: Dordrecht. Goswami A., Pattanaik K., Bharadwaj A. and Bharti, S. (2014). Loss Rate Control Mechanism for Fan-in-burst Traffic in Data Center Network. Procedia Computer Science, 32, 125-132.
Huang J., Meng Y., Gong X., Liu Y. and Duan Q. (2014). A novel deployment scheme for green Internet of Things. Internet of Things Journal, IEEE, p.99.
Ibrahim H. A. H., Nor S. M. and Khammas B. M. (2014). Ambiguity and Concepts in Real Time Online Internet Traffic Classification. International Journal of Engineering & Technology (0975-4024), 6(1).
Karagiannis T., Molle M., Faloutsos M. and Broido A. (2004). A nonstationary Poisson view of Internet traffic. Paper presented at the INFOCOM 2004. Twenty-third AnnualJoint Conference of the IEEE Computer and Communications Societies.
Kassim M., Ismail M., Jumari K. and Yusof M. I. (2012). A Survey: Bandwidth Management in an IP Based Network. Paper presented at the International Conference on Computer, Communication and Information Sciences, and Engineering, ICCCISE 2012, World Academy of Science, Engineering and Technology (WASET).
Kim M.-S., Won Y. J. and Hong J. W. (2006). Characteristic analysis of internet traffic from the perspective of flows. Computer communications, 29(10),
1639-1652. doi: http://dx.doi.org/10.1016/j.comcom.2005.07.015
Kuai, X., Feng, W., & Lin, G. (2014). Behavior Analysis of Internet Traffic via Bipartite Graphs and One-Mode Projections. Networking, IEEE/ACM Transactions on, 22(3), 931-942. doi: 10.1109/tnet.2013.2264634
Mahalakshmi C. and Ramaswamy M. (2012). Data transfer strategy for multiple destination nodes in virtual private networks. [Journal]. ARPN Journal of Engineering and Applied Sciences, 7(11), 6.
Park C., Hernández-Campos F., Marron J. and Smith F. D. (2005). Long-range dependence in a changing internet traffic mix. Computer Networks, 48(3), 401-422.
Priscilla G. M. and Sumathi C. (2013). Managing Queue Stability Using Art2 in Active Queue Management for Congestion Control. Journal of Engineering & Applied Sciences, 8(8).
Simion D. D. (2012). Traffic Shaping And Traffic Policing Impacts On Aggregate Traffic Behavior In High Speed Networks. International Journal of Advanced Computer Science, 2(10).
Walck C. (2007). Handbook on statistical distributions for experimentalists. Fysikum, University of Stockholm: Particle Physics Group.
Xiong W., Hu H., Xiong N., Yang L. T., Peng W.-C., Wang X. and Qu Y. (2014). Anomaly secure detection methods by analyzing dynamic characteristics of the network traffic in cloud communications. Information Sciences, 258, 403-415.
Yu L., Yong W. and Jiangdong Z. (2011, 10-12 June 2011). Modeling of C3I Communication Network based on Real-time Queuing Theory. Paper presented at the 2011 IEEE International Conference on Computer Science and Automation Engineering (CSAE).
![A NOVEL APPROACH OF REAL OBJECT TRACKING SYSTEM [REAL TIME] ON FPGA.Aarti Goswami 1 and Rajesh Kumar Rai 2](data:image/gif;base64,R0lGODlhAQABAIAAAP///wAAACH5BAEAAAAALAAAAAABAAEAAAICRAEAOw==)