Proximity Models
A thesis submitted for the degree ofDoctor of Philosophy
Xiaolu Lu, School of Science,
College of Science, Engineering and Health, RMIT University,
Melbourne, Victoria, Australia.
Supervisors: Dr. Jason Shane Culpepper
Prof. Alistair Moffat
I certify that except where due acknowledgment has been made, the work is that of the author alone; the work has not been submitted previously, in whole or in part, to qualify for any other academic award; the content of the thesis is the result of work which has been carried out since the official commencement date of the approved research program; any editorial work, paid or unpaid, carried out by a third party is acknowledged; and, ethics procedures and guidelines have been followed.
Xiaolu Lu
School of Science
College of Science, Engineering and Health RMIT University
Portions of the material in this thesis have previously appeared in the following refereed publica-tions:
• X. Lu, A. Moffat, and J. S. Culpepper. How effective are proximity scores in term depen-dency models? InProc. Australasian Doc. Comp. Symp., pages 89–90, 2014
• X. Lu, A. Moffat, and J. S. Culpepper. On the cost of extracting proximity features for term-dependency models. InProc. Int. Conf. Information and Knowledge Management, pages 293–302, 2015
• X. Lu, A. Moffat, and J. S. Culpepper. The effect of pooling and evaluation depth on IR metrics. Information Retrieval J., 19(4):416–445, 2016
• X. Lu, A. Moffat, and J. S. Culpepper. Efficient and effective higher order proximity mod-eling. InProc. Int. Conf. Theory of Information Retrieval, pages 21–30, 2016
• X. Lu, A. Moffat, and J. S. Culpepper. Modeling relevance as a function of retrieval rank. InProc. Asian Information Retrieval Societies Conf., pages 3–15, 2016
• X. Lu, A. Moffat, and J. S. Culpepper. Can deep effectiveness metrics be evaluated using shallow judgment pools? In Proc. ACM-SIGIR Int. Conf. Research and Development in Information Retrieval, pages 35–44, 2017
Acknowledgments
I must first thank my supervisors, J. Shane Culpepper and Alistair Moffat, for their guidance and support throughout the candidature. I would also like to thank my parents for their support throughout my life, without whose reassurance I would not be able to finish this thesis. This work was supported by RMIT University and Australia Research Council.
Abstract 1
1 Introduction 3
1.1 Historical Background of Information Retrieval Systems . . . 3
1.2 Evaluating Retrieval Systems . . . 5
1.3 Thesis Structure . . . 7
2 Background 9 2.1 Information Retrieval . . . 9
2.2 Retrieval Heuristics and Models . . . 10
2.2.1 Basic Retrieval Models . . . 10
2.2.2 Retrieval Heuristics and Features . . . 13
2.2.3 Proximity-Based Retrieval Models. . . 15
2.3 Document Representations . . . 20
2.3.1 Inverted Lists . . . 21
2.3.2 Representations Other than Inverted Lists . . . 24
2.3.3 Summary of Representing Proximity Feature Statistics . . . 25
2.4 Test Collection-Based Evaluation. . . 25
2.4.1 Judgment Set Selection. . . 26
2.4.2 Relevance Values . . . 30
2.4.3 Evaluation Metrics over Complete Judgments . . . 32
2.4.4 Evaluation Methods over Incomplete Judgments . . . 39
2.4.5 System and Metric Comparisons . . . 45
2.5 Experimental Dataset Description . . . 48
2.5.1 Document Collections and Tracks . . . 48
2.5.2 Topics and Judgments . . . 49
2.5.3 Summary of Test Collections. . . 51
2.6 Summary . . . 51
3 Computing Term Proximity Features 53 3.1 Background . . . 54
3.1.1 Subqueries, Optimal Intervals and Fixed Size Windows. . . 54
3.2.1 Types of Proximity Features in Term-Dependency Models . . . 57
3.2.2 The Impact of Proximity Features in Term-Dependency Models . . . 58
3.3 Extracting Single Intervals . . . 63
3.3.1 The Eager PLANESWEEP(EPS) Approach . . . 63
3.3.2 The Lazy PLANESWEEP(LPS) Approach . . . 64
3.3.3 Comparing Input Structures . . . 66
3.3.4 Experiments on the Single Interval Finding Task . . . 67
3.4 Extracting Multiple Intervals . . . 71
3.4.1 Repeated Computations . . . 71
3.4.2 A Critical Observation . . . 72
3.4.3 A Lazy PLANESWEEPApproach for Finding All Intervals (LPS-IF-A). . 73
3.4.4 An Eager PLANESWEEPApproach for Finding All Intervals (EPS-CDF-A) 74 3.4.5 Correctness and Analysis. . . 75
3.4.6 Experiments on Finding All Optimal Intervals. . . 77
3.5 Conclusions . . . 79
4 Efficient and Effective Retrieval with Higher-Order Proximity Features 81 4.1 Background . . . 82
4.1.1 Proximity Heuristics and Features . . . 82
4.1.2 MRF-Based Proximity Models . . . 85
4.1.3 Possible Trade-Offs Between Efficiency and Effectiveness . . . 87
4.2 Using Local Proximity Statistics in Retrieval Models . . . 88
4.2.1 Intervals. . . 88
4.2.2 Scoring Intervals . . . 88
4.2.3 Combining Interval Scores . . . 90
4.2.4 Variants . . . 91
4.3 Experiments . . . 92
4.3.1 Experimental Materials and Evaluation Metrics . . . 92
4.3.2 Retrieval Models and Configurations . . . 93
4.3.3 Effectiveness of Proximity Features . . . 94
4.3.4 Retrieval Effectiveness using Local Proximity Statistics. . . 96
4.3.5 Retrieval Cost Using Local Proximity Statistics . . . 100
4.4 Conclusions . . . 102
5 The Effect of Pooling and Evaluation Depth 105 5.1 Evaluation Depth and Pooling Depth . . . 106
5.2 Proposed Metric Comparison Methods . . . 107
5.2.1 Coverage and Inversion Ratio . . . 107
5.2.2 Volatility Matrix . . . 109
5.3 Observations of TREC Pooling Methods . . . 109
5.3.3 Breaking Ties . . . 112
5.4 Observations of System Effectiveness Scores . . . 114
5.4.1 Effectiveness Scores of Recall-Based Metrics . . . 115
5.4.2 Effectiveness Scores of Weighted-Precision Metrics. . . 115
5.4.3 The Effect of Shallow Judgment Pools. . . 116
5.5 Meta-Evaluation with a Fixed Reference . . . 118
5.5.1 Metric Comparisons with Complete Judgments . . . 121
5.5.2 Metric Comparisons with Incomplete Judgments . . . 122
5.6 Meta-Evaluation with Different References . . . 125
5.6.1 Different Evaluation Depths as Reference Points . . . 125
5.6.2 Different Metrics as Reference Points . . . 127
5.6.3 Metric Parameters Revisited . . . 127
5.7 Conclusions . . . 129
6 Estimating Deep Metric Scores Using Shallow Judgment Pools 133 6.1 Background . . . 134
6.1.1 Types of Bias Within the Pooling Process . . . 134
6.1.2 Approaches for Score Estimation . . . 135
6.1.3 Evaluating Estimation Accuracy . . . 137
6.1.4 Experimental Materials. . . 139
6.2 Approaches for Estimating System Effectiveness for Deep Metrics . . . 140
6.2.1 Overview of the Estimation Framework . . . 140
6.2.2 Modeling Effectiveness as a Function of Retrieval Depth . . . 141
6.2.3 A Two-Stage Estimation Framework. . . 147
6.3 Experiments with Rank-Level Estimators . . . 152
6.3.1 Experimental Settings . . . 152
6.3.2 Score Estimation using Rank-Level Estimators . . . 153
6.3.3 Determining the Adjustment Threshold . . . 156
6.4 Experiments with the Estimation Framework . . . 160
6.4.1 Shallow Pooled Judgments . . . 160
6.4.2 Sampling-Based Judgments . . . 163
6.4.3 Estimating Relevance on ClueWeb. . . 163
6.5 Conclusions . . . 164
7 Conclusions and Future Work 167 7.1 Thesis Outcomes . . . 168
7.2 Future Work . . . 169
7.2.1 Extension of Efficient Higher-Order Proximity-Based Retrieval . . . 169
7.2.2 Challenges in Reliable Evaluation on Large Test Collections . . . 169
1.1 Timeline of information retrieval techniques and systems . . . 4
1.2 A snapshot of the Google query interface at late 1997 early 1998 . . . 5
1.3 Evaluation and retrieval systems . . . 6
2.1 The classic model of web based information retrieval (adapted from Broder [11]). . . 10
2.2 An example document collection with four documents . . . 21
2.3 The basic inverted file structure for the example collection in Figure 2.2. . . 21
2.4 An example of a combined inverted list and partial nextword index . . . 22
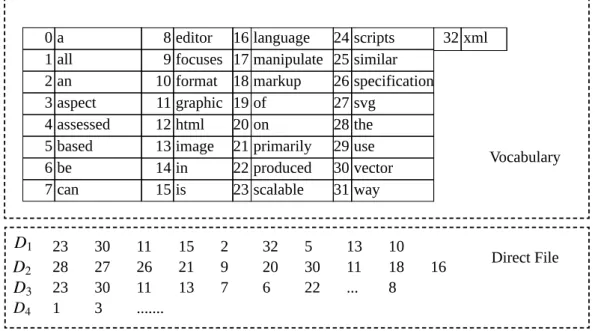
2.5 A direct file example . . . 24
2.6 The top-dpooling process. . . 27
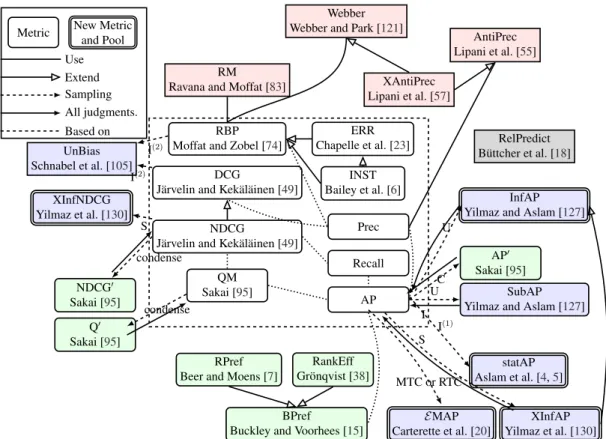
2.7 An overview of evaluation metrics and approaches . . . 33
2.8 An example of TREC document and topic . . . 48
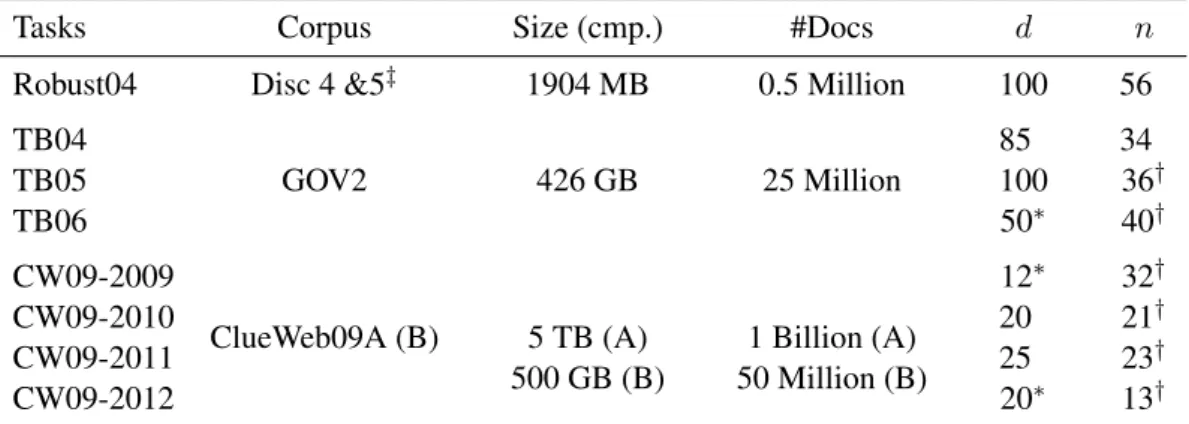
2.9 Observations for different pooling statistics on two types of TREC collections.. . . . 50
3.1 Interval examples . . . 55
3.2 An example of position lists of terms in a document. . . 56
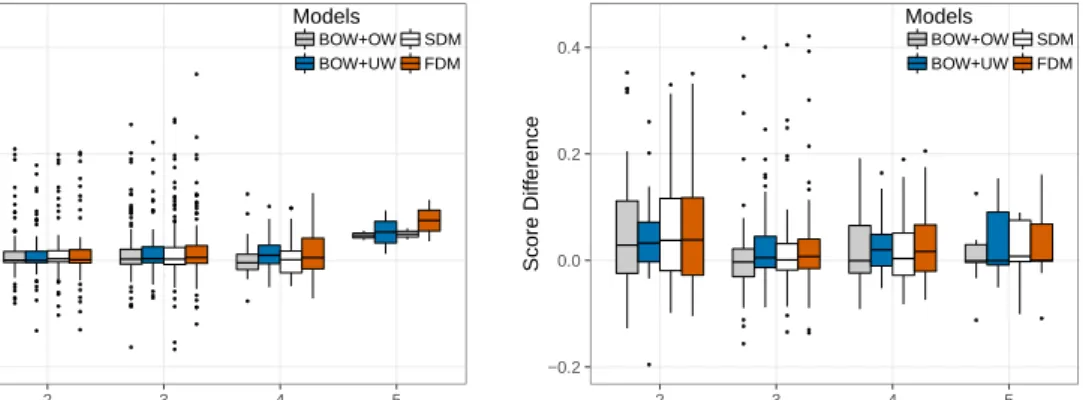
3.3 Distribution of query performance deltas. . . 59
3.4 Score differential relative to the bag-of-words model . . . 59
3.5 An example of the PLANESWEEPapproach . . . 63
3.6 A running example of theEPSapproach . . . 65
3.7 A running example of theLPSapproach . . . 66
3.8 Relations between the input representations and two PlaneSweep methods . . . 67
3.9 Statistics of the experimental datasets used in interval finding experiments . . . 68
3.10 Time spent (msec/doc) constructing the condensed direct file . . . 70
3.11 Time (msec/doc), as a function ofαQ,Dfor Set A. . . 70
3.12 An observation in the process of optimal interval enumeration . . . 72
3.13 A running example ofLPS-IF-A . . . 74
3.14 A running example ofEPS-DF-A . . . 75
3.15 Time (msec/doc) to extract the optimalk-intervals for all subqueries using Set B. . . 78
4.1 An example of text section from a relevant document . . . 83
4.2 Relevance modeled using MRFs . . . 85
4.3 Dependencies modeled using MRFs . . . 86
4.6 Projection of relevance percentages along each axis . . . 96
4.7 Effectiveness difference compared to BM25 and SDM . . . 97
4.8 Per-document retrieval costs in microseconds, grouped by query length . . . 103
4.9 Trade-off graph for all retrieval models and on all test collections . . . 103
5.1 Statistics of relevant documents on different test collections. . . 110
5.2 Raw system scores for AP@kvariants.. . . 114
5.3 Scores for NDCGa@kand QM@k. . . 116
5.4 Scores for RBP(0.95)@kand ERR@k . . . 118
5.5 APb@k, NDCGa@kand RBP(0.8)@kon Robust04 and CW09A-2010,d= 10. . . 119
5.6 Comparisons of NDCGa@k, with different datasets and pooling depth settings. . . . 120
5.7 Condensed APb@kand NDCGa@kscores. . . 123
5.8 Volatility matrices of two recall-based metrics.. . . 125
5.9 Volatility matrices of two weighted-precision metrics. . . 127
5.10 Metrics comparison using volatility matrix . . . 128
6.1 An example of an RBP score using shallow and deep pooling depths.. . . 137
6.2 An overview of the estimation framework . . . 141
6.3 A running example of deriving rank-level estimators . . . 142
6.4 Examples of two different models . . . 144
6.5 Rank-level Estimators Fitting Curves with Different Pooling Depths . . . 146
6.6 The ranking matrix for all documents . . . 148
6.7 Averageγ values on two different types of collections. . . 152
6.8 The relation betweenθand RMSE ofon TREC-5 and TREC-7 withd0 = 10 . . . . 156
6.9 System orderings predicted using rank-level estimators . . . 159
6.10 System orderings predicted using two-stage estimators . . . 162
6.11 System ordering comparisons on a two-strata sampled judgment set. . . 164
2.1 Proximity-based ranked retrieval models and their characteristics . . . 16
2.2 A summarization of representing proximity statistics. . . 25
2.3 Summary of different judgment set construction methods.. . . 31
2.4 Weighted-precision metrics and the calculation components. . . 34
2.5 Three example relevance vectors . . . 37
2.6 An overview of the test collections . . . 51
3.1 Configurations of term-dependency models used in experiments . . . 58
3.2 Effectiveness of listed ranking models. . . 60
3.3 Outlier queries when using only the ordered window component . . . 61
3.4 Outlier queries when using both bag-of-words and ordered window components . . . 62
3.5 Description of sampled query sets . . . 68
3.6 Median and maximum time (msec/doc) spent to find optimal intervals . . . 69
3.7 Median and maximum time (msec/doc) to find all optimal intervals using Set A. . . . 78
4.1 Distance aggregation methods . . . 84
4.2 Description of the test collections. . . 92
4.3 Retrieval models and their configurations used in experiments . . . 94
4.4 Effectiveness of models on TREC-8 and GOV2, using two metrics . . . 98
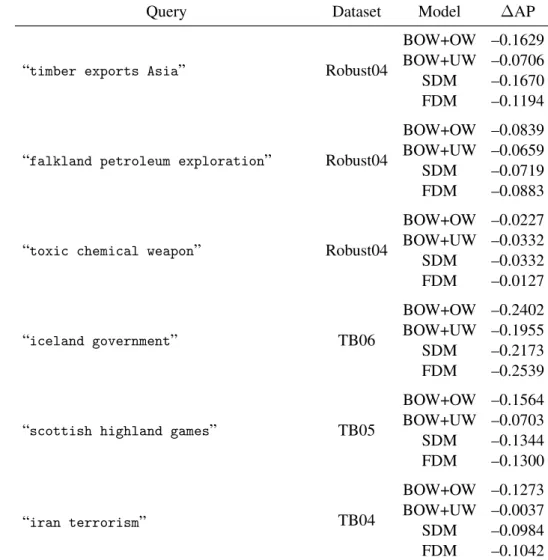
4.5 Degradation and boost queries ofLkpon Robust04 and TB04–06. . . 99
4.6 Evaluation results of different models on ClueWeb09B . . . 100
4.7 Degradation and boost queries ofLkpon CW09B test collections. . . 101
4.8 Retrieval cost in microseconds per document scored. . . 102
5.1 Datasets description. . . 110
5.2 Details of pooling outcomes. . . 111
5.3 Leave-one-out and leave-group-out experiments on shallow pools. . . 112
5.4 Percentage of tied scores and its impact on system ordering. . . 113
5.5 Discriminative power, coverage and inversion ratios for six metrics. . . 117
5.6 Discrimination, coverage, and inversion ratios of condensing method. . . 124
5.7 Residual values on two test collections. . . 124
6.1 Example of bias types. . . 134
6.4 Goodness-of-Fit RMSE values for all fitting models . . . 145 6.5 RMSE ofand Acc% of rank-level estimators using RBP(0.95)on NewsWire datasets154 6.6 RMSE ofand Acc% of rank-level estimators using RBP(0.95)on TB04–06 . . . . 155 6.7 Per-topic score estimation using rank-level estimators . . . 157 6.8 RMSE and Acc% for leave-group-out experiments with different depthd0 . . . 160
Notation Description
D Document
G∗() Rank-level estimator
I(Q0) Optimal interval set of a subqueryQ0
J A set of judgments, a superscript0 represents a reduced judgment set
Q A given keyword query, contains query termq Q0l A subquery of lengthl
R A set of relevant documents
S A retrieval system
gain·(ri) Mapped gain value of relevance score Sk×n nsystems to depthkfor a given topic
C Document collection
Ik The set of optimal intervals of a query|Q|=k
Q0
l A set of subqueries that have lengthl, which are derived fromQ kD,i Rank of documentDgiven by systemSi
g1` A background estimate vector of all documents output in the first level
opti-mization, using thel-th rank-level estimator.
g0∗,m The rank-level gain vector of a documentDestimated by anm-th rank-level
estimator.
σi,j Order ofSiandSj
d Pooling depth, a superscript0represents a reduced pool ft,D Within document term frequency of a termt
ft Document frequency of a termt
k In evaluation setting, it is the evaluation depth ri Relevance value (of a document) at rank positioni
t A term
WM(i) Weight at rankiused in the weighted-precision metrics
Information Retrieval systems are widely used to retrieve documents that are relevant to a user’s information need. Systems leveraging proximity heuristics to estimate the relevance of a document have shown to be effective. However, the computational cost of proximity-based models is rarely considered, which is an important concern over scale document collections. The large-scale collections also make collection-based evaluation challenging since only a small number of documents are judged given the limited budget. Effectiveness, efficiency and reliable evaluation are coherent components that should be considered when developing a good retrieval system. This thesis makes several contributions from the three aspects.
Many proximity-based retrieval models are effective, but it is also important to find effi-cient solutions to extract proximity features, especially for models using higher-order proximity statistics. We therefore propose a one-pass algorithm based on the PLANESWEEPapproach. We
demonstrate that the new one-pass algorithm reduces the cost of capturing a full dependency re-lation of a query, regardless of the input representations. Although our proposed methods can capture higher-ordered proximity features efficiently, the trade-offs between effectiveness and ef-ficiency when using proximity-based models remains largely unexplored. We consider different variants of proximity statistics and demonstrate that using local proximity statistics can achieve an improved trade-off between effectiveness and efficiency.
Another important aspect in IR is reliable system comparisons. We conduct a series of ex-periments that explore the interaction between pooling and evaluation depth, interactions between evaluation metrics and evaluation depth and also correlations between two different evaluation metrics. We show that different evaluation configurations on large test collections, where only a limited number of relevance labels are available, can lead to different system comparison conclu-sions. We also demonstrate the pitfalls of choosing an arbitrary evaluation depth regardless of the metrics employed and the pooling depth of the test collections. Lastly, we provide suggestions on the evaluation configurations for the reliable comparisons of retrieval systems on large test collections.
On these large test collections, a shallow judgment pool may be employed as assumed bud-gets are often limited, which may lead to an imprecise evaluation of system performance, espe-cially when a deep evaluation metric is used. We propose an estimation framework for estimating deep metric score on shallow judgment pools. With an initial shallow judgment pool, rank-level estimators are designed to estimate the effectiveness gain at each ranking. Based on the rank-level estimations, we propose an optimization framework to obtain a more precise score estimate.
CHAPTER
1
Introduction
1.1
Historical Background of Information Retrieval Systems
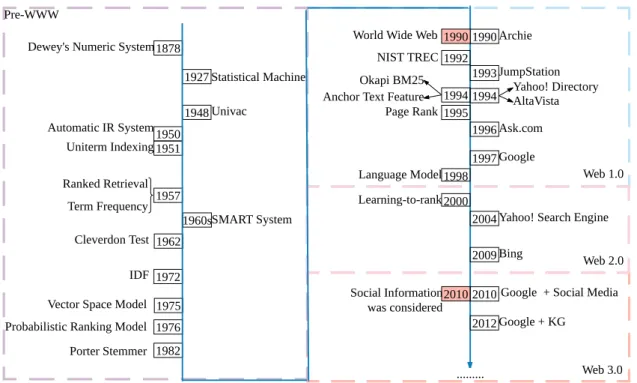
Despite many advances in web search engines over the years, reliably satisfying the information needs of users remains a fundamental research problem. The study of information retrieval didn’t begin with the web, but has a long standing history dating back to 1950s [106], as depicted in Figure1.1. The phraseInformation Retrieval(IR) can have several different definitions, and its main goal is to help users locate information that can satisfy their information needs. One of IR’s primary concerns is to deal with large amounts of unstructured data, where no clear structure was defined making it difficult for a computer to interpret, for example textual information. This is in contrast to traditional relational database systems where data often has a predefined schema. Although asearchprocess is commonly used when referring to Information Retrieval, it contains a wide range of tasks beyond the search task, such asfilteringandquestion answering. There are two questions that naturally arise from this process: how can we organize information, and how can we find the set of documents satisfying a user’s needs.
The task of helping people to address their information needs was frequently performed with the help of professionals, such as librarians, paralegals and similar expert searchers [70]. Con-ventional approaches to managing the large collections of information arose from the field of librarianship, and a hierarchical subject classification mechanism using catalog cards was widely employed as the organizing approach [103]. However, arranging information using catalog cards was unable to handle the increasing amount of documents. Therefore an alternative method was proposed by Taube et al. [112], which was a term-based inverted list mechanism. The idea of indexing each term instead of a catalog cards was further improved and implemented as one of the basic representation in computer based IR systems, supporting different retrieval tasks. A detailed description of this technique is presented by Zobel and Moffat [135].
The task of locating and returning documents that satisfies the user requires the development of methods that can assess whether or not the current document is likely to satisfy the information need. One of the simplest methods to fulfill this task is to exactly match the data with a user’s query in the document collections, which is known as Booleanretrieval; and it requires users
Dewey's Numeric System1878 1927 Statistical Machine 1948 Univac 1950 Automatic IR System 1951 Uniterm Indexing 1957 Ranked Retrieval Term Frequency Cleverdon Test 1962 1975 Vector Space Model
1960sSMART System
1972 IDF
1976 Probabilistic Ranking Model
1992 NIST TREC 1994 Okapi BM25 1990 Archie 1990
World Wide Web
1993 JumpStation 1994 Yahoo! DirectoryAltaVista 1996 Ask.com
1997 Google
2004 Yahoo! Search Engine 2009 Bing 2010 Social Information was considered 1982 Porter Stemmer 1995 Anchor Text Feature
Page Rank 1998 Language Model 2000 Learning-to-rank Web 1.0 Web 2.0 Web 3.0 Google + Social Media 2010
2012 Google + KG
... Pre-WWW
Figure 1.1: Timeline of information retrieval techniques and systems. The three dashed boxes contain key techniques and systems that appeared in different ages, categorized based on the birth of World Wide Web in 1990. The text to the left of each line are several techniques and the text to the right of the timeline are several key systems.
to express their information need in the form of a Boolean expression, using operators, such as “AND” or “OR”. An alternative to Boolean retrieval is ranked retrieval, where no strict matching is required and the documents returned are in the form of a ranked list instead of a set. This method was widely adopted in thead hocretrieval process. Note that any retrieval systems aim to provide documents that arerelevantto the information need of the user.
Most existing IR systems employ the ranked retrieval approach for providing users the set of desired documents. To do that, a similarity computation that estimates the likelihood of a document being relevant to the information need behind a query is required, which we refer to as a retrieval model. In 1960s, the vector space model was proposed [101], vectorizing each documents and computing cosine similarity between query and a document. A ranked list of documents sorted in descending cosine similarity which is then returned to the a user. The proposedterm frequency(TF) andinverse document frequency (IDF) statistics in 1970s have become the most important statistics adopted in any retrieval model, even through until the present day. Robertson and Jones [87] provided further explanation of these two statistics from a probabilistic perspective. Meanwhile, theprobabilistic ranking principle(PRP) was proposed by Robertson [84]. One of the most well-known retrieval models, the Best Matching 25 (BM25) model was proposed based on PRP [89], and it has become one of the foundational retrieval models in IR systems.
From 1990s until recently, the velocity and volume of data on the World Wide Web put forth many new challenges in the field of IR. This large-scale added new requirements to the challenges of developing retrieval systems. At the same time, the retrieval systems faced many scalability and
Figure 1.2: A snapshot of Google at late 1997 early 1998, obtained fromhttp://blogoscoped.com/ archive/2006-04-21-n63.html
efficiency challenges, which arose from not only the web-scale amount of data, but also the so-phisticated computation required by modern retrieval methods. Moreover, the way that a retrieval system interacts with users also has been reevaluated and redesigned since the birth of Mosaic GUI Browser in 1993. Soon after, web search engines, such as Google emerged. Figure1.2shows a snapshot of Google in late 1997 and early 1998, where an input box was provided for users to input search queries and have the top-kresults returned, wherek was specified by the user. As
hyperlinks and anchor text are important features for web pages, exploiting the two features in the retrieval model makes IR systems more effective, especially within the context of web search. Even today, more sophisticated retrieval models are being proposed, in order to better understand users’ information needs thus provide high quality search results. Additionally, indexing and re-trieval approaches have also attracted lots of attention from researchers, in order to devise rere-trieval systems that are scalable while at the same time providing results in an efficient manner.
1.2
Evaluating Retrieval Systems
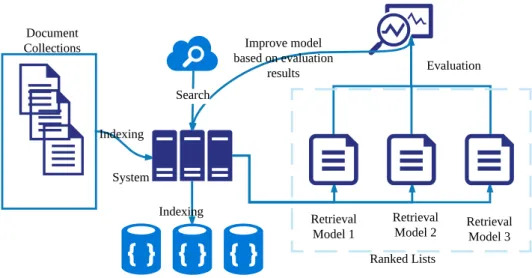
Aside from designing better retrieval systems, evaluating system performance is also a crucial task in IR studies, since we need to answer the question: Is system A better than system B?as a guide for improving system performance. As shown in Figure1.3, effectiveness scores obtained in the evaluation process can be used as a guide for improving existing retrieval models. Hence, reliable evaluation is an important component in the big picture of information retrieval studies. In order to compare two systems, anevaluation metricis required, which computes aneffectiveness score for a retrieval system, as an indicator of system performance.
For Boolean retrieval systems, precision and recall is used for system evaluation, indicating the percentage of documents retrieved by a system that meets user’s expectation; and among
Document Collections Ranked Lists Indexing Indexing Search Retrieval Model 1 Retrieval
Model 2 Retrieval Model 3 Evaluation Improve model
based on evaluation results
System
Figure 1.3: Relationship between evaluation and retrieval systems.
the set of documents that can satisfy user’s information need, the percentage returned by the system. However, the two metrics are not suitable for ranked retrieval. In order to make use of ranked positions in the evaluation process, metrics such asAverage Precision(AP) were proposed and became one of the standard measurements for assessing retrieval systems. The AP metric computes precision scores of a system, at all of the ranks at which documents can meet user’s information needs; then averaged over the total number of relevant documents of that specific need.
The evaluation process can be performed either online or offline, and for offline evaluation, building resuable test collections is important for the evaluation task. The Text REtrieval Con-ference1 (TREC) is a major annual exercise started in the 1990s, and which provides publicly available datasets for training and testing new retrieval systems. Not only in providing test collec-tions, TREC also has a profound impact on developing new evaluation metrics. More importantly, approaches for evaluating quality of test collections have also been proposed during past con-ferences. The practice of defining search tasks and the methodology of building test collections adopted in TREC also give some guide to researchers for building their own offline test collections. With the increasing size of the document collections, it is expensive to ask assessors to judge large amounts of documents. Therefore, cost-effective test collection building has received consid-erable attention. When using limited judgments for system evaluation, system comparison may be biased, thus results may not be reliable. Such bias may result from different evaluation configura-tions, consisting of metric and the maximum depth considered of a ranked list used for evaluation. In order to make a fair comparison between systems using the limited set of judgments, researchers propose different approaches, from the aspect of collection building and developing new evalu-ation metrics [51,127]; from the aspect of configuring evaluation settings based on existing test collections [95]; and also from the aspect of estimating true performance of systems [55,83,121]. As a result of the large-scale of web data and also due to search engines becoming more
personal and contextual, evaluating using only the offline method is no longer sufficient, especially for commercial search engines. Hence, online evaluations such as A/B testing are adopted in practice, which measures system performance from direct observations of users.
As we mentioned, in IR studies, efficiency, effectiveness and evaluation are important compo-nents that are tightly connected with each other. In order to develop a high-performance retrieval system, it is essential that a reliable conclusion can be drawn from the evaluation process. Also, the trade-offs between effectiveness and efficiency should be carefully considered, since sophis-ticated retrieval models may result in expensive computations, which may be impractical. It is the space defined by these functions in which this thesis is presented, considering aspects of ef-ficiency, of effectiveness trade-offs; and from the aspect of the reliable evaluation on large-scale test collections.
1.3
Thesis Structure
As we briefly introduced in the previous section, the field of Information Retrieval has a long history, including indexing techniques, retrieval models and evaluation methods. Chapter2gives an introductory view from all three aspects. We describe the background of retrieval models by considering the search process and retrieval heuristics. Firstly, we focus on the ranked retrieval process, and proceed to discuss the classic models that exist. More advanced features other than TF and IDF have also been leveraged in retrieval models, among which the closeness of terms in the documents has been considered as being one of the more effective techniques. We detail a range of proximity-based retrieval models and give a simple categorization of these models. The use of proximity improves retrieval effectiveness, but at increased computational cost. New in-dexing techniques have been proposed in order to perform a trade-off between effectiveness and efficiency. Since efficiency is crucial in the domain of a web search environment, given that the amount of documents in these collections is so large, accurately assessing the efficiency effec-tiveness trade-offs is of importance. Hence, we discuss the evaluation framework and issues of large-scale test collections. Chapter2closes with the description of the TREC-developed experi-mental materials heavily used in this thesis.
The contribution chapters begin in Chapter3, where we propose approaches for computing proximity statistics for queries containing more than two terms. We consider the state-of-the-art term-dependency models proposed by Metzler and Croft [73], which consider the distance of queries of length greater than two, regardless of the order these query terms appear in the document. We firstly empirically examine the important role distance features play in the term-dependency models, compare the difference with phrase features, and reconfirm the effectiveness of proximity features. A new method is proposed for finding proximity statistics of all dependen-cies of a given query. By using a PLANESWEEPapproach, it is possible to compute all
dependen-cies within one pass of query evaluation, saving the computational overhead for the exponentially growing size of subqueries.
There are two factors that lead to the inefficiency of applying a term-dependency model in practice, the first is the exponential number of intervals with regards to query length, and the
second is the two-pass evaluation process of interval IDF values calculation. The second fac-tor is considered in Chapter 4. When considering the entire query evaluation process of term-dependency model, the use of IDF in the computation process is costly. Computing collection-wise proximity statistics requires a two-pass evaluation over the entire index, which may be ineffi-cient for some queries. Therefore, Chapter4assesses the trade-off between using collection-wise statistics and document-level statistics. Based on several retrieval heuristics and also alternative proximity-based models, we propose an alternative model that substitutes the global statistics with document-level statistics. We show that our proposed surrogates improve the effectiveness com-pared to bag-of-words models, but also reduce the computational overhead to some extent, when compared to models requiring global statistics.
Obtaining a reliable evaluation result is a vital step when developing new systems. We empir-ically show that on large test collections when only a limited volume of judgments are available, it is possible that biased results will be obtained, especially when the evaluation configuration is not appropriate. Two key components of the settings are the evaluation depth and the metrics used. Chapter5 empirically examines the impact of different settings on the conclusions that can be made through this process. We show that, on the large TREC web test collections, where only top-ranked documents have usually been judged, a shallow weighted-precision metric may be the best choice for reaching a reliable evaluation conclusion.
When a deep evaluation is required, where using a weighted-precision metric also risks hav-ing lots of uncertainties in system comparisons, an approach that is able to estimate system effec-tiveness is required. Chapter6considers this problem and proposes a framework for estimating effectiveness scores when using deep weighted-precision metrics. The complete framework con-sists of two modules: a curve fitting component that models relevance as retrieval ranks, and an optimization framework that is dependent on the previous one, which outputs a unified estimate for each considered system.
The thesis ends with Chapter7, where we summarize our findings, review their weaknesses and consider possible extensions.
CHAPTER
2
Background
2.1
Information Retrieval
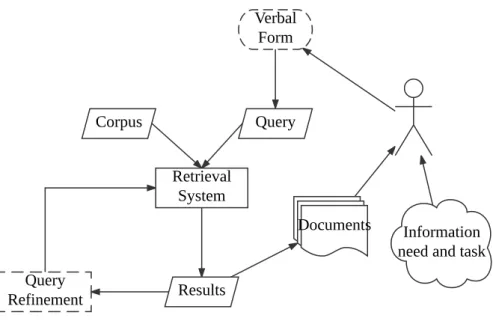
Information Retrieval is an interdisciplinary field that is largely comprised of various tasks related to the storage, processing and searching of vast amounts of unstructured data such as textual documents, images, and video. A common search task involves a user formulating a query and receiving answers in the form of a summarized list of documents in ranked order [32]. Figure2.1 outlines a typical search engine process. A user begins a search process with aninformation need, which is often represented by a set ofkeywords. These keywords are often referred to asqueries. A retrieval system is designed to receive a query (Q) as input and calculate a similarity score
between each document (D) in the corpus (C) and the query. LetScore(Q, D) be the similarity
score between a query and a document; its aim is to measure the degree to which the resulting document is a representative candidate for reflecting the user’s information need. As a final step of the retrieval process, a ranked list consisting of documents, sorted by descending similarity scores, is presented to the user. Normally, a user will reformulate the query if results are not satisfying.
One of the core components in a retrieval system is theretrieval model, which is concerned with computing the similarity score. A higher similarity score indicates that the document is pre-dicted as being relevant to a user’s information need. Retrieval models are discussed in detail in Section2.2. In web search,efficiencyis an important consideration, and an efficient retrieval system must present results to users in a reasonable response time by minimizing computational cost. A proper representation of documents in the document collection is crucial for achieving low query latency, which will be further detailed in Section2.3. In order toevaluatetheeffectivenessof a retrieval system, various metrics have been proposed. These evaluation metrics measure to what extent the provided results satisfy users’ information needs. Although there are different evalua-tion approaches, an offline evaluaevalua-tion is often employed in lab-based experimental environments. The offline evaluation process and related issues are presented in Section2.4.
Information need and task Verbal Form Query Corpus Retrieval System Results Query Refinement Documents
Figure 2.1: The whole retrieval task is completed by both users (dashed symbols) and retrieval systems (solid symbols). A user begins a retrieval task with an information need, which is then input into the retrieval system in the form of aquery. Retrieval systems return a set of documents to the user from a document corpus.
2.2
Retrieval Heuristics and Models
A core component in every retrieval system is the one that is responsible for scoring the similarity between a document and a user query. Before ranked retrieval, Boolean retrieval was widely used. However, it has several drawbacks [106]. For example, it requires the input query in a well-formatted structure, which makes it cumbersome for inexperienced users. Therefore, free text queries have been widely adopted as the de facto input method for an information retrieval system. The standard approach for the presentation of search results is in the form of a ranked list which unequivocally conveys document importance. In order to provide a better result to satisfy complex information needs, ranked retrieval has become increasingly popular. In Section2.2.1, basic retrieval models that calculate a similarity score based on unigrams, which are often referred to asbag-of-words (BOW) models, are discussed. Section 2.2.3 discusses more sophisticated ranking regime, which were proposed to improve user satisfaction. Finally, in Section2.2.2, key factors and heuristics used in ranking models are discussed.
2.2.1 Basic Retrieval Models
Singhal [106] classified basic retrieval models into three types: the vector space model, proba-bilistic models, and inference models. In this section, three representative models from the first two classes are discussed: the vector space model, the BM25 retrieval model and the language model. The three models are also bag-of-words models that often serve as baselines in various
retrieval experiments. These bag-of-words models were developed based on term independence assumptions, which assume no dependencies between query terms and thus similarity scores are calculated for each query term individually.
Vector Space Model. One of the earliest ranking models was the vector space model proposed
by Salton et al. [101]. It projects both query and documents into a vector space. LetQbe the
query and Dbe a document, both of which have dimensionality equal to the number of unique
terms in the corpus. Based on the vector representation, the similarity score is then calculated as: Score(Q, D) = D·Q
kQk2kDk2
. (2.1)
There are two options for a vector representation: (i) a binary representation indicating the presence or absence of each term, or (ii) a term weight (wt,D) indicating the terms’
impor-tance in each document. The calculation of wt,D used in the second option usually follows a
TF×IDF weighting scheme, which is based on term-frequency (TF) and inverse document
fre-quency (IDF) [87]. Letft,Dbe the frequency of a termtoccurring in documentD(TF), and let
ftbe the number of documents containing termt, then one way of theTF×IDFweighting scheme
is calculated as:
wt,D= (1 + logft,D)·log
N ft
, (2.2)
in whichN is the total number of documents in the document.
Using the binary representation in the vector space model may fail to differentiate between documents. For example, consider two documents D1 andD2, and two query termq1 andq2.
Ifq1 appears inD1 andq2 appears inD2, both of which have a same TF values, butq1 appears
less often thanq2 in the entire document collection. Then, if a binary representation is used,D1
and D2 may have the same score, which means that they are estimated as being equally likely
relevant to the query. However, when a weighting scheme such as Equation2.2 is adopted,D1
may be ranked higher since it captures additional information via the inverse document frequency that assigns a higher weight for the more rarely occurring termq1.
The Probabilistic Ranking Model. Models in the second class are based on the probabilistic
ranking principle (PRP), expressed by Robertson [84], as:
“Documents should be ranked in such a way that the probability of the user being satisfied by any given rank position is a maximum”.
As the probability cannot be directly obtained, models falling in this category mainly focus on estimating the probability using evidence from the documents.
One of the most widely used bag-of-words models in this category is Okapi BM25 [89], which scores documents using:
Score(Q, D) =X q∈Q wq· (1 +k1)·fq,D k1((1−b) +b(|D|/avg|D|)) +fq,D · (1 +k3)fq,Q k3+fq,Q , (2.3)
wherefq,D is the within document TF value of a query termq,fq,Qis the occurrence of termq
appearing inQ, andwq is the IDF weighting andavg|D|is the average document length. The
k3parameter is useful when the query is long, but in retrieval tools such asIndri1orATIRE2, it is
often omitted. There are several variants for calculating the IDF weight, and Robertson and Jones [87] discussed these alternatives. Among all variants, two are widely used:
wt(1)= log N ft wt(2)= logN −ft+ 0.5 ft+ 0.5 . (2.4)
The main difference between the two weighting schemes is thatw(1)t is negative whenft> N/2,
whilew(2)t tends to zero ifftis close toN. Lee [54] compared different variants of IDF weighting,
including the two listed in Equation2.4.Leeargued thatw(2)is more plausible, and a recent study
by Trotman et al. [113] confirmed that conclusion. Many other BM25 variants have been proposed to improve the ranking model by adding heuristics such as document length, the importance of query terms, and so on. A detailed experimental study and survey on BM25 variants was provided by Trotman et al. [113], who concluded that, although there are many BM25 variants that consider more features, there is no model that consistently performs better than the others.
Another type of probabilistic model based on an inference network, was proposed by Turtle and Croft [114]. The network estimates the probability of a document being relevant to the query by using a variety of different features beyond unigrams.
The Language Model. Probabilistic models such as BM25 rank documents based on the
prob-ability that a document may be relevant to a query using statistical information derived from doc-uments. A different idea is to calculate the probability that a document would generate the query, which is the core idea behind the language model (LM) [81]. One of the key components in any language model is smoothing, which is used to adjust the estimation error caused by data sparse-ness. Zhai and Lafferty [132] compared three smoothing methods: Jelinek-Mercer, Dirichlet and Absolute discount. Their experimental study showed that (i) retrieval performance is sensitive to the choice of smoothing method, and to the parameter settings; and (ii) different queries have different sensitivity patterns with regard to the smoothing methods. Moreover, Dirichlet performs well in general, and it is more suitable for retrieval tasks on web collections compared to Jelinek-Mercer, this can be attributed to the short query length common in such a scenario. Zhai and Laffertyalso gave suggestions on the optimal parameter values used for each smoothing method, for example,µ = 2000should be considered when using Dirichlet smoothing. As a result, the
Language Model with Dirichlet Smoothing (LMDS) is often used in retrieval systems. The model using Dirichlet smoothing will be regarded as the default language model in this thesis, which scores a document as follows:
Score(Q, D) =|Q| · µ |D|+µ+ X q∈Q fq,Q·log fq,D· |C| µ·fq,C + 1 , (2.5) 1https://www.lemurproject.org/ 2http://atire.org
in which fq,Q is the frequency of a query termq ∈ Q, |C|is the total number of terms in the
corpus,fq,Cis the frequency ofqin the collection, which isPD∈Cfq,D.
Follow-up work has proposed a range of variants based on the original language model. In general, Zhai [131] concluded three aspects where these variants may vary compared to the origi-nal language model: (i) the assumption of the document model; (ii) the smoothing method; or (iii) the document prior, which will be defined shortly. Robertson and Zaragoza [88] compared lan-guage models to the BM25 framework on a theoretical level. Different document models capture assumptions of the probability of a term appearing in a document. For example, while both the multi-Bernoulli model and the multinomial model have an independence assumption of whether a term will appear in a document, they are slightly different. The first model assumes that each term occurrence is independent of other terms and the independence assumption adopted by the latter model takes the repeated occurrence into consideration. Beyond the two widely acknowl-edged models, recent studies show that other models such as the Poisson [71] model can also achieve promising results. As discussed, different smoothing methods have a large impact on retrieval effectiveness, thus a second class of language model variants can be obtained by choos-ing different smoothchoos-ing methods. Adocument priorcan incorporate static ranking preference of documents. For example, a basic language model can use a prior consisting of PageRank as a feature. Trotman et al. [113] empirically examine performance difference between BM25 variants and language model variants; both types of retrieval models have comparable effectiveness when correct parameter configurations are used.
2.2.2 Retrieval Heuristics and Features
In general, both probabilistic retrieval frameworks and language models have been successful in advancing the state-of-the-art of the retrieval process as they share a number of heuristics that are similar in nature. When improving upon the classic features, a great deal of attention has been on the study and proposal of more advanced statistical features and retrieval heuristics, especially in the learning-to-rank framework.
However, not all features are shown to improve retrieval effectiveness consistently. There-fore, in this section, retrieval heuristics used in classic models are presented, with a focus on proximity features. The last part of this section presents a simple overview of the other features used in more sophisticated ranking mechanisms.
Heuristic Retrieval Constraints. There are many factors that can lead to a successful retrieval
model, such as TF and IDF weighting. Four categories of heuristics constraints have been formal-ized by Fang et al. [37] based on the basic retrieval models, including term frequency constraints (TFC), term discrimination constraints (TDC), length normalization constraints (LNC), and TF-length constraints (TF-LNC). The TFC are related tofq,D statistics, which include: (i) favoring
a document with a higherfq,D; (ii) favoring a document contain more distinct query terms; and
(iii) preventing score increases caused by frequent terms. The TDC is a heuristic that calibrates betweenfq,D andfq. The last two constraint types are related to document length, which aims at
are included in popular retrieval models and have been shown to be key factors that improve re-trieval effectiveness. Experimental results show that if a model fails in satisfying all of the listed constraints, then it is not optimal. Fang et al.showed that none of the retrieval models satisfy all constraints unconditionally, and thus, theoretically, they may be further improved.
Proximity Heuristics and Features. Besides the widely usedTF×IDFheuristic, proximity
fea-tures are one of the simplest methods used to extend bag-of-words models. One of the earliest studies on applying proximity features in ranked retrieval [42] stated the proximity hypothesis as:
“The closer together a set of intersecting terms the more likely they are to indicate relevance”.
Here, “interesting terms” may refer to query terms. For example, if a user is searching for “scalable vector graphics”, the proximity heuristic suggests that if the query terms appear
close to each other in one document more frequently, then this document is likely to be more relevant than another one which contains all terms, but are not clustered together.
There are various proximity statistical features that have been derived from such a heuristic, and they can be categorized using different aspects. The simplest categorization of these aspects that contribute the characteristic of proximity is a term-pair proximity feature that only considers two query terms. Higher-order proximity features exist, being more complex, they consider in addition to bigram relations, term sets of an arbitrary size. Consider the example query “scalable vector graphics”. If there are no external resources available, it is hard for us to determine
which combinations of two query terms are “interesting” but when considering all two-term com-binations, of which the computation is expensive. Intuitively, a higher-order proximity feature, in this case, may be more effective since the query itself may be, for example, a location name and directly consider documents containing such phrases may produce higher quality results.
A second way to categorize proximity features is based on whether or not the interesting terms appear in the same order as the query. Requiring terms to appear in the same order as user queries is referred to assequential dependencies[73]. The ordering constraint is often used with distance constraints, which requires the terms to appear consecutively. As an example, and while briefly ignoring the distance constraint, an ordered proximity feature requires “scalable vector graphics” to appear in exactly the same order in the document, but there may be other terms
be-tween the query terms as they appear within the document. For the case of an unordered proximity feature, there is no requirement for the query terms to appear in order within the document, still while omitting the consideration of any distance constraint.
The last class of proximity feature is classified based on the type of statistics used in capturing proximity heuristics – whether it is captured implicitly asTF×IDFstatistics or a distance [111]
measure. LetQ0 ={vector, graphics}, andIQ0 =hp`, pribe an interval in a document, which capturesQ0 located at position p` andpr. Given a distance constraint, the first type of feature
simply countsfI,D andfI, which is the TF and IDF statistics of intervals satisfying the distance
constraint. The second type of proximity feature is defined by aggregating interval lengths,pr−
explored several such variants, concluding that using the minimal distance as proximity features performs the best in their experimental studies.
Other Retrieval Features. In order to improve retrieval effectiveness, more sophisticated
rank-ing approaches have been proposed, which involve features other than term proximity. Recent retrieval models, especially models in the learning-to-rank framework, make use of various fea-tures in order to produce a highly effective retrieval model. Macdonald et al. [68,69] presented detailed experimental studies on the usefulness of features used in a learning-to-rank model. Al-though their experiments are in the context of learning-to-rank, combinations of these features explored by them have also been used by other models. For example, when considering a docu-ment structure, statistics from different docudocu-ment fields can also be used to give different weights in the BM25F model [90]. Macdonald et al. [68] showed that nearly all features can improve the retrieval effectiveness to some extent when used in a learning-to-rank model, but may result in decreased effectiveness when they are integrated into certain ranking models, for example, field based retrieval models.
2.2.3 Proximity-Based Retrieval Models
All of the models discussed in Section2.2.1make the assumption that the occurrence of query terms in a document are independent. As proximity is a simple concept that is relatively easy to integrate into existing bag-of-words models, as such there have been many studies on the develop-ment of proximity-based retrieval models. Table2.1presents an overview of the proximity-based retrieval models. In the table, proximity-based ranked retrieval models can be described roughly based on three key features: (i) whether the model contains higher-order proximity; (ii) whether the proximity is order constrained; and (iii) the type of statistical model. Based on how the proxim-ity features are captured, representative models listed in the table will be discussed in the following paragraphs.
Frequency-Based Proximity Models. One of the most representative frequency-based models
are the term-dependency models based on Markov Random Fields (MRFs) [73], which are im-plemented in Indri3. Metzler and Croftadd proximity using a Markov Random Field, and then
proposed two retrieval models – the Sequential Dependency Model (SDM) and the Full Depen-dency Model (FDM), both of which are derived from the LMDS family. In the modeling process, they consider three possible types of relationships among query terms: full independence (FI), sequential dependence (SD) and full dependence (FD).
Full independenceis the same as the assumption adopted in the bag-of-words model, which is, the occurrence of each query term in a document is i.i.d. Asequential dependenceassumes that the probability of a term appearing in a document will be affected by the adjacent query terms. Therefore, in SDM, bigram proximity is considered. If bigrams in the query occurr frequently in a document and within a fixed distance, then the document is considered to have a high probability
Model Bigrams Consec. Statistics Model Type Y N Y N Freq. Dist. K ern. BM25 LM Other Fag an [ 36 ](1987) X X X X Ha wking and Thistle w aite [ 42 ](1995) X X X X Song and Croft [ 108 ](1999) X X X X de Kretser and Mof fat [ 34 ](1999) N/A N/A N/A N/A X X Clark e et al. [ 24 ](2000) X X X X Srikanth and Srihari [ 110 ](2002) X X X X Rasolofo and Sa vo y [ 82 ](2003) X X X X Metzler and Croft [ 73 ](FDM) (2005) X X X X Metzler and Croft [ 73 ](SDM) (2005) X X X X X B ¨uttcher et al. [ 17 ](2006) X X X Peng et al. [ 78 ](SDM) (2007) X X X X Peng et al. [ 78 ](FDM) (2007) X X X X Song et al. [ 109 ](2008) X X X X Lv and Zhai [ 65 ](2009) N/A N/A N/A N/A X X He et al. [ 43 ](W indo w Counting) (2011) X X X X He et al. [ 43 ](Survi val Analysis) (2011) X X X X X V uurens and de Vries [ 119 ](2014) X X X X Table 2.1: Proximity-based rank ed retrie val models and their characteristics. The “Bigrams” column sho ws whether the corres ponding model using bigram features; the “Consec. ” column sho ws models impose order requirements on proximity features; the “Statistics” column indicates types of proximity statistics used in the model; the last column sho ws which bag-of-w ords the current proximity model is built on. A “ X ” symbol sho ws the considered model satisfies the listed criteria; and the “N/A ” means the model is not suitable for being cate gorized using the listed condition.
of being relevant to the query. LetQ = {q1, q2, . . .}be the keyword query,Iow(Q0)be a length
winterval that captures a subqueryQ0 with order constraints,I
uw(Q0)be a lengthwinterval that
containsQ0, without order constraints, and Dbe a document, then the canonical form of SDM
can be written as:
Score(Q, D) =λt· |Q| X i=1 Score(qi, D) +λow· |Q−1| X i=1 Score(Iow({qi, qi+1}), D) +λuw· |Q−1| X i=1 Score(Iuw({qi, qi+1}), D), (2.6)
where each function Score(·) is calculated in the same way as Equation 2.5, but using
statis-tics of Iow({qi, qi+1}) or Iuw({qi, qi+1}) instead of the unigram qi. The difference between
SDM and FDM is that FDM makes use of higher-order proximity features, which consider term-dependencies beyond bigrams. Therefore, computing FDM uses an equation similar to Equa-tion 2.6, but instead of considering adjacent bigrams Q0 = {q
i, qi+1}, it considers all possible
subqueries. Hence, the cost of computing FDM is exponential with regard to the length ofQ, and
can be expensive in practice. However, experimental studies show that on some query sets, FDM is more effective than other models, a result that is general for all queries and all collections.
Peng et al. [78] integrated term-dependencies into a Divergence From Randomness (DFR) [1] framework, which is implemented in theTerrier4system. Similar to FDM and SDM proposed by Metzler and Croft, both SD and FD variants have been considered, and the proximity heuristic is captured by counting the frequency across fixed length windows. However, different from the MRF-based FDM, only term-pairs are considered by Peng et al., and the full dependency only considered between two query terms.
There are also many other models in this category [36,43, 108, 110]. Recent work by He et al. [43] proposes two different ways of using proximity features and the first method is to count
n-gram frequency, counting the number of fixed windows that contain a given subquery, of which
the core idea is similar to FDM; and the second method is to perform survival analysis to each window that contains query terms.
Distance-Based Proximity Models. Using frequency statistics requires a predefined distance
constraint, which may miss important term intervals if the constraint is not selected properly [119]. Also, such fixed-length windows lose the information of exact distance among matched sub-queries [43], which results in less discrimination ability between matched windows. Therefore, the second type of proximity models makes use of proximity heuristics by considering actual term distance within matched subqueries. LetI be an interval that captures an arbitrary subquery, and
I be the set of intervals found in a document. Early work by Hawking and Thistlewaite [42]
consider two alternatives for calculating the contribution of intervals: Score(I, D) =X I∈I 1 |I| −1 Score(I, D) =X I∈I 1 p |I| −1, (2.7)
where|I|is the length of an interval. They show that on some topics, the retrieval effectiveness
can be improved with the proximity features compared to a simpleTF×IDFweighting approach.
A slightly different approach of calculating the contributions of an interval was proposed in the cover density ranking model [24], where a predefined lengthwis required. LetI be an interval
that contains an arbitrary subquery andwbe the predefined fixed length, then its contribution is:
Score(I, D) = w/|I|, if|I|> w 1, otherwise. (2.8)
The total contribution of the interval setIis the summation of individual intervals, which is similar to Equation2.7.
Based on the BM25 retrieval model and also using the term proximity distance, Rasolofo and Savoy [82] and B¨uttcher et al. [17] proposed bigram based proximity using a BM25 statistical model. Both models score the contribution of an interval as:
Score(I, D) = 1
|I|2, (2.9)
where|I|is the length of the interval. When scoring the total contribution of the interval set, both models are within the BM25 framework and replace the TF statistics with interval distance weight-ings. A major difference between the two models is the way in which score aggregation over all matching intervals is performed. Rasolofo and Savoy [82] aggregate the score contributions by summing up contributions from all intervals, which is:
Score(I, D) =X I∈I
Score(I, D). (2.10)
B¨uttcher et al. [17] amortize the total contribution of an interval to all query terms: Score(I, D) = X
I∈I
I∩Q={qi,qj}
(wi+wj)·Score(I, D), (2.11)
where wi and wj are the IDF weightings of two matched query terms qi and qj, respectively.
The work done by Song et al. [109] aligns these research lines, but generalizes to a higher-order proximity feature. LetI be the interval such that I ∩Q 6= ∅, for an individual interval, its
contribution is calculated as:
Score(I, D) = |I∩Q| λ
|I|γ , (2.12)
in whichγ andλare two parameters and|I|is the interval length. The main difference between
distance to proximity statistics, which provides more flexibility. Equation2.9can be viewed as a special case of Equation2.12, whereλ= 0andγ = 2. There are no conclusive results on which parameter should be applied in practice, and Song et al. [109] assigned the values empirically in their experiments, which is similar to Rasolofo and Savoy [82] and B¨uttcher et al. [17]. The final ranking model proposed by Song et al. [109] is computed in a similar way and was adopted by B¨uttcher et al. [17], where the contribution of an individual interval is amortized to query terms contained in the interval. The model proposed by Vuurens and de Vries [119] is based on KL-Divergence and the contribution of a single interval is:
Score(I, D) = |I∩Q| −1
|I| −1 (2.13)
When compared to frequency-based methods, all models in this category can be computed without higher-order global features, and have a better discrimination even when two intervals have the same length. However, most models in this category consider term-pairs only, with the exception of the last two models [109,119], which go beyond two-terms.
Kernel-Based Proximity Models. A third family of proximity models use proximity heuristics
by defining different kernel functions, rather than explicitly using it with frequency counting or distance calculations. The main idea is to assume that the influence of each term is additive and the contribution changes based on the location within a document. de Kretser and Moffat [34] assumed four different options for kernel functions that can be used to describe how contributions of each term change based on its positions in a document. In a similar line of research, Lv and Zhai [65] proposed the Positional Language Model (PLM), which integrates different kernel functions into a language model. PLM is a position specific model, and each position in a document is given a different score. Therefore, three strategies of how to compute a final score for a document have been discussed: (i) use the maximum score of all positions (best position); (ii) average of all scores obtained in a document (multi-position); and (iii) computing a final score based on multiple propagation ranges (multi-σ). Among all of the combinations of design choices,Lv and Zhaihave
shown that a Gaussian kernel with multi-σperforms the best.
The survival analysis model proposed by He et al. [43] combines both kernel and distance-based methods. He et al.consider proximity contributions by modeling the probability of query term co-occurrences. While it is different from the kernel based method, the high-level idea is sim-ilar – model how proximity features are propagated in a document. In their experiments, variants of proposed models are compared, and also the effectiveness difference between models using the bigram feature and the trigram feature. Their experimental results show that using trigram features only marginally increase the retrieval effectiveness, and a frequency-based method is suf-ficient for improving the effectiveness since survival analysis performs similarly to counting fixed length windows.
Comparing Proximity-Based Models. Due to the extensive coverage of proximity-based
other with regards to retrieval effectiveness?A recent experimental study was conducted by Hus-ton and Croft [45]. They mainly focus on comparing retrieval effectiveness between bigram and higher-order proximity models. They compare the term-pair model (BCTP) [17], the span-based term-pair model (TPSpan) [82], DFR-based proximity models (bDFR, pDFR), and variants of SDM and FDM models. They also considered PLM [65], however, due to excessive costs of this model, it was not applied to large corpora. There are two main conclusions drawn from their experiments – that higher-order proximity models cannot consistently outperform bigram models; that the performance of the retrieval models varies on queries, which result in similar performance on average among all variants. However,Huston and Croftalso pointed out that the higher-order proximity models may potentially improve retrieval effectiveness, but requires a careful selection of dependent query terms.
Another comparison focus is between models that use global statistics and local statistics [66]. Models that require global statistics [73,78] of proximity features have a higher computational cost since the computation can only be completed after traversing the entire index. Therefore, the scoring process of models that use statistics such as IDF need a two-pass algorithm in or-der to return the top-kdocuments. In contrast, models [17,24,43,82] that use local proximity statistics only, such as the TF values of a fixed length window within a document, are less expen-sive. Besides the global statistics of unigrams, there are no requirements on the global statistics of proximity features, which means a lower retrieval cost when compared to models using global statistics. Macdonald and Ounis [66] studied the differences between the two types of models, FD and SD derived for both MRF and DFR retrieval frameworks. Macdonald and Ounisconcluded that using global statistics of higher-order proximity may not lead to any significant improvement in the retrieval effectiveness, and when the queries get longer, it can result in performance degra-dation in both effectiveness and efficiency. Also, global statistics are not crucial even in large web corpora. Based on their empirical observations, it is possible to make use of local proximity features as a surrogate for the global ones, in order to reduce computational cost.
We consider both effectiveness and efficiency aspects in this work. Since making use of higher-order proximity features may improve the effectiveness and using local statistics may save some computational overhead when applying proximity features, the approach proposed in later chapters combines them.
2.3
Document Representations
In order to calculate similarity scores using the models discussed in Section2.2, a proper repre-sentation of documents in the test collection is necessary. Before representing documents in the collection, there are several preprocessing steps required. Typically, each document in the collec-tion is assigned a unique identifier (doc id), and each term also has a unique identifier (term id). A dictionary (or vocabulary) is built during the process of parsing all documents in the corpus. The most straightforward representation is to preserve each document in the form of term ID vectors, without any further processing, which is referred to as adirect file. However, an obvious drawback in using this representation is that it may not help improve the query evaluation cost in the ranked
D1: Scalable Vector Graphics is an XML-based vector image format.
D2: The SVG Specification primarily focuses on vector graphics markup language.
D3: Scalable Vector Graphics images can be produced by the use of a vector graphics editor.
D4: All aspects of an SVG document can be accessed and manipulated using scripts in a similar
way to HTML.
Figure 2.2: An example document collection consisting four documents.
Document Info. 9 10 15 19 doc_id 1 ... 3 2 ... 3 Term document ... graphic scalable ... vector
Inverted Lists for Terms
Figure 2.3: The basic inverted file structure for the example collection in Figure2.2. retrieval process. Consider the basic bag-of-words models discussed in Section2.2.1. All of them fall in theTF×IDFranking regime, and computing these statistics on-the-fly results in a high cost
in retrieval process. Hence a representation that improves query evaluation is required. In this section, the main focus is the inverted file structure, including the one that is built for proximity ranking models. Some other representations are discussed in Section2.3.2. After constructing a vocabulary, the four documents can be represented using a basic inverted index, as shown in Figure2.3.
2.3.1 Inverted Lists
Basic Inverted Index. Consider an example document collection containing four documents,
shown in Figure2.2. A basic inverted file index structure contains two components: the vocabulary and an inverted list for each term [135]. The vocabulary contains all unique terms in the document collection, and the document frequencyftassociated with each term. Each term in the vocabulary
also has a pointer reference to an inverted list that keeps the frequency statistics in the form of hD, ft,Di, which is the document ID where the term appears, and the number of occurrences of the
term in documentD. In addition to these two components, there is often a separate structure that
maintains meta information for all documents. Besides a mapping from original document name to document ID, it may also contain information such as document length for the convenience of query evaluation. It is clear that, with the help of such an index structure, most of the bag-of-words
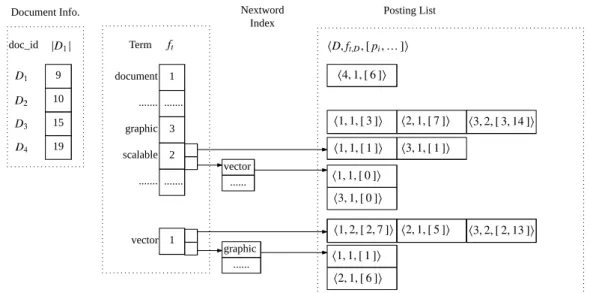
Document Info. 9 10 15 19 doc_id 1 ... 3 2 ... Term Posting List vector vector ... graphic ... 1 document ... graphic scalable ... Nextword Index
Figure 2.4: An example of a combined inverted list and partial nextword index. models can be computed efficiently.
There are various ways of organizing such inverted lists. The inverted list of a term can be sorted based on document ID, but it can also be sorted based on impact or term frequency to improve the retrieval efficiency [2]. However, when the ranking model requires phrase or other proximity features, the basic inverted index is no longer sufficient. A natural extension is to add positional information to the inverted list of each term. Instead of keepingft,Donly, positions,
where each term occurs, are also kept in the inverted list entry, which is the “[pi. . .]” part shown
in Figure2.3. Including positional information of terms adds to the space required and may not even be necessary if the retrieval process requires only document-level information. Zobel and Moffat [135] provide a detailed survey in regard to using inverted files for retrieval tasks.
Representing Proximity Statistics. As proximity features are query dependent, pre-computing
and indexing can be difficult, especially for higher-order proximity features. However, if only phrases or term-pairs are considered in the proximity-based ranking models, it is possible to build a separate index structure. In addition to using the positional index only, there are three alternatives in representing phrase or term-pair proximity features – a hybrid index structure consisting both phrase and term-level inverted files [13,125]; or an approximate index [35].
Phrase Index. A phrase indexmay also be stored using an inverted file representation where
each entry in the vocabulary is a phrase instead of being a single term [125]. However, only repre-senting a document collection using a phrase index is not sufficient since the term-level statistics are also required. Therefore, a commonly adopted solution is to use a hybrid index structure that consists of both term and phrase-level statistical information. The main concern with building a phrase-level index is the index size. Building an inverted index for all phrases is infeasible and unnecessary. Therefore, apartial phrase indexis a viable alternative. A partial phrase index only