Volume 13 | Issue 1 Article 14
5-1-2014
Separate Ratio-type Estimators of Population Mean
in Stratified Random Sampling
Rajesh Tailor
Vikram University, Ujjain, M.P., India, [email protected]
Hilal A. Lone
Vikram University, Ujjain, M.P., India, [email protected]
Follow this and additional works at:http://digitalcommons.wayne.edu/jmasm
Part of theApplied Statistics Commons,Social and Behavioral Sciences Commons, and the
Statistical Theory Commons
Recommended Citation
Tailor, Rajesh and Lone, Hilal A. (2014) "Separate Ratio-type Estimators of Population Mean in Stratified Random Sampling,"Journal of Modern Applied Statistical Methods: Vol. 13 : Iss. 1 , Article 14.
DOI: 10.22237/jmasm/1398917580
Dr. Tailor is a Reader in the School of Studies in Statistics. Email him at
[email protected]. H. Lone is a Research Scholar in the School of Studies in Statistics.
Separate Ratio-type Estimators of
Population Mean in Stratified Random
Sampling
Rajesh Tailor Vikram University Ujjain, M.P., India Hilal A. Lone Vikram, University Ujjain, M.P., IndiaSeparate ratio-type estimators for population mean with their properties are considered. Some separate ratio-type estimators for population mean using known parameters of auxiliary variate are proposed. The bias and mean squared error of the proposed estimators are obtained up to the first degree of approximation. It is shown that the proposed estimators are more efficient than unbiased estimators in stratified random sampling and usual separate ratio estimators under certain obtained conditions. To judge the merits of the proposed estimators, an empirical study was conducted.
Keywords: Finite population mean, separate ratio estimator, auxiliary variable, bias,
mean squared error, stratified random sampling
Introduction
The use of auxiliary information improves the efficiency of estimators. Cochran (1940) used auxiliary information at the estimation stage and envisaged the ratio estimation method. This method provides a ratio estimator which assumes that the population mean of the auxiliary variate is known. The ratio estimator performs well when a study and auxiliary variate are positively correlated. When these variates are negatively correlated, Robson’s (1957) product method, which was independently given by Murthy (1964), is used. Searls (1964) utilized the coefficient of variation of an auxiliary variate to estimate the population mean of a study variate. Based on the work of Searls (1964), Sisodia and Dwivedi (1981) used a coefficient of variation of an auxiliary variate. Singh, et al. (2004) proposed ratio and product type estimators using the coefficient of kurtosis of an auxiliary variate, whereas Upadhyaya and Singh (1999) utilized both the
coefficients of variation and kurtosis of an auxiliary variate. Kadilar and Cingi (2003), Sisodia and Dwivedi (1981), Upadhyaya and Singh (1999) and Singh, et al. (2004) defined estimators in stratified random sampling. This article develops separate ratio-type estimators along the lines of Kadilar and Cingi (2003).
Consider a population U of size N consisting of units U1, U2, U3,...,UN. Let x and y be the auxiliary variate and study variate, respectively. If population
U is divided into L homogenous strata of sizes nh (h=1, 2, 3 ..., l), and a sample of size n is drawn from the h
th
h stratum, then the usual separate ratio estimator for population mean Y is defined as
1 ˆ L h RS h h h h X Y W y x
,where xh is the sample mean of the auxiliary variate in stratum h, and yh is the
sample mean of a study variate of interest in stratum h
To the first degree of approximation, the bias and mean squared of the usual separate ratio estimator are
2
1 ˆ L RS h h h xh yxh xh yh h B Y W Y C C C
(1) and
2
2 2 2
1 ˆ L 2 RS h h yh h xh h yxh h MSE Y W S R S R S
. (2)Proposed separate ratio-type estimator using coefficient of
variation
Sisodia and Dwivedi (1981) defined a ratio-type estimator using coefficient of variation Cx of auxiliary variate x as
ˆ x SD x X C Y y x C (3)
Kadilar and Cingi (2003) further defined Sisodia and Dwivedi’s (1981) estimator in stratified random sampling as
1 1 ˆ L h h xh ST h SD st L h h xh h W X C Y y W x C
(4)Motivated by Sisodia and Dwivedi (1981), Kadilar and Cingi (2003), suggested a separate ratio-type estimator using coefficient of variation Cxh of
auxiliary variate in th h stratum as 1 ˆ L SD h xh RS h h h h xh X C Y W y x C
(5)To obtain the bias and mean squared error of the proposed separate ratio-type estimator ˆSD RS Y :
1
h h oh y Y e and xh Xh
1e1h
,such that E e
oh E e
1h 0 and
2 1 1 2 2 , oh yh h yh h h E e C C n N
2 2 2 1h 1 1 yh h xh , h h E e C C n N
oh 1h
1 1 yxh yh xh h yxh yh xh . h h E e e C C C C n N Expressing ˆSD RS Y in terms of 'e si results in
2 2
1 1 1 1 1 1 1 1 ˆ L L SD RS h h h h oh h h h h h oh h h h Y W Y W Y e e e e e
.Thus, the bias and mean squared error of the proposed ratio estimator ˆSD RS
Y
up to the first degree of approximation is obtained as
2 2
1 1 1 ˆ L SD RS h h h h xh h yxh yh xh h B Y W Y C C C
(6)
2
2 2 2 2
1 1 1 ˆ L 2 SD RS h h yh h h xh h h yxh h MSE Y W S R S R S
(7) where 1h h h xh X X C , h h h Y R X and yxh yxh xh yh S S S .Suggested separate ratio-type estimator using coefficient
of kurtosis
Singh, et al. (2004) defined a modified ratio estimator using the coefficient of kurtosis 2(x) of an auxiliary variate x as
2 2 ( ) ˆ ( ) SE X x Y y x x (8)
Kadilar and Cingi (2003) defined Singh, et al’s (2004) estimator in stratified random sampling as
2 1 2 1 ( ) ˆ ( ) L h h h ST h SE st L h h h h W X x Y y W x x
(9)Motivated by Kadilar and Cingi (2003) and Singh, et al. (2004), the proposed estimator using the coefficient of kurtosis 2(x) of auxiliary variate x in th h stratum is 2 1 2 ( ) ˆ ( ) L SE h h RS h h h h h X x Y W y x x
(10)The bias and mean squared error of the proposed estimator ˆSE RS Y are obtained as
2 2
2 2 1 ˆ L SE RS h h h h xh h yxh yh xh h B Y W Y C C C
(11)
2
2 2 2 2
2 2 1 ˆ L 2 SE RS h h yh h h xh h h yxh h MSE Y W S R S R S
(12) where 2 2 ( ) h h h h X X x .Proposed separate ratio-type estimator using coefficient of
variation and coefficient of kurtosis
Upadhyaya and Singh (1999) suggested two different ratio-type estimators using the parameters coefficient of variation and coefficient of kurtosis as
2 1 2 ( ) ˆ ( ) x US x X x C Y y x x C (13) and 2 2 2 ( ) ˆ ( ) x US x X C x Y y x C x (14)
Kadilar and Cingi (2003) defined Upadhyaya and Singh’s (1999) estimators in stratified random sampling as
2 1 1 2 1 ( ) ˆ ( ) L h h h xh ST h US st L h h h xh h W X x C Y y W x x C
(15) and
2 1 2 2 1 ( ) ˆ ( ) L h h xh h ST h US st L h h xh h h W X C x Y y W x C x
(16)Based on Upadhyaya and Singh (1999) and Kadilar and Cingi (2003), the proposed separate ratio-type estimator using coefficients of kurtosis and variation in th h stratum are 1 2 1 2 ( ) ˆ ( ) L US h h xh RS h h h h h xh X x C Y W y x x C
(17) and 2 2 1 2 ( ) ˆ ( ) L US h xh h RS h h h h xh h X C x Y W y x C x
(18)Using the standard procedure for finding the bias and mean squared errors shown previously, the bias and mean squared error of the proposed separate ratio-type estimators up to the first degree of approximation are obtained as:
1
2 2
3 3 1 ˆ L US RS h h h h xh h yxh yh xh h B Y W Y C C C
(19)
1 2
2 2 2 2
3 3 1 ˆ L 2 US RS h h yh h h xh h h yxh h MSE Y W S R S R S
(20)
2
2 2
4 4 1 ˆ L US RS h h h h xh h yxh yh xh h B Y W Y C C C
(21)
2 2
2 2 2 2
4 4 1 ˆ L 2 US RS h h yh h h xh h h yxh h MSE Y W S R S R S
(22) where 2 3 2 ( ) ( ) h h h h h xh X x X x C and 4 2 . ( ) h xh h h xh h X C X C x Efficiency comparisons
The variance of the usual unbiased estimators in stratified random sampling is
2 2 1 L st h h yh h V y W S
(23)From (7) and (23), it is observed that the proposed estimator SD RS
Yˆ would be
more efficient than the usual unbiased estimator ystif 2
A B. (24)
A comparison of (7) and (2) shows that the proposed estimator SD RS
Yˆ would
be more efficient than the usual ratio estimator YˆRS if
2
C D. (25)
Comparing (12) and (23), it is observed that the proposed estimator SE RS
Yˆ
would be more efficient than the usual unbiased estimator yst if 2
E F. (26)
From (12) and (2) it is observed that the proposed estimator SE RS
Yˆ would be
more efficient than the usual separate ratio estimator YˆRS if 2
G H. (27)
Comparison of (20) and (23) shows that the proposed estimator ˆUS1
RS
Y would
be more efficient than the usual unbiased estimator yst if 2
From (20) and (2), it is observed that the proposed estimator ˆUS1
RS
Y would be
more efficient than the usual separate ratio estimator YˆRS if
2
N P. (29)
Comparison of (22) and (23) shows that the proposed estimator ˆUS2
RS
Y would
be more efficient than the usual unbiased estimator yst if
2
Q R. (30)
From (22) and (2), it is observed that the proposed estimator ˆUS2
RS
Y would be
more efficient than the usual separate ratio estimator YˆRS if
2 S T, (31) where 2 2 2 2 1 1 L h h h xh h h A W S R
, 2 1 1 L h h h h yxh h B W R S
,
2 2 2 2 1 1 1 L h h xh h h h C W S R
, 2
1 1 1 L h h h yxh h h D W R S
, 2 2 2 2 2 1 L h h h xh h h E W S R
, 2 2 1 L h h h h yxh h F W R S
, 2 2 2
2
2 1 1 L h h xh h h h G W S R
, 2
1 1 1 L h h h yxh h h H W R S
, 2 2 2 2 3 1 L h h h xh h h L W S R
, 2 3 1 L h h h h yxh h M W R S
, 2 2 2
2
3 1 1 L h h xh h h h N W S R
,
2 3 1 1 L h h h yxh h h P W R S
, 2 2 2 2 4 1 L h h h xh h h Q W S R
, 2 4 1 L h h h h yxh h R W R S
2 2 2 2 4 1 1 L h h xh h h h S W S R
and 2
4 1 1 . L h h h yxh h h T W R S
Empirical study
To examine the performance of the proposed estimator in comparison to other estimators considered in this study, three natural population data sets were
considered (see Populations 1-3). The estimators based on the population data are compared in Table 1.
Population 1. (Singh and Mangat, 1996, p. 208)
N = 1344, n = 52 1 n =14 n2=9 n3=12 n4=17 1 N =400 N2=216 N3=364 N4=364 1 X =76.21 X2=58.11 X3=69.08 X4=63.71 1 Y =79.35 Y2=59.44 Y3=76.66 Y4=64.57
21 x =2.22 22
x =2.29 23
x =1.96 24
x =2.47 1 x C =0.1906 2 x C =0.2416 3 x C =0.201 Cx4=0.1908 1 2 x S =210.9938 2 2 x S =197.1041 3 2 x S =192.7954 Sx24=147.7651 1 2 y S =166.70 2 2 y S =174.28 3 2 y S =226.60 4 2 y S =170.61 1 yx S =148.76 3 yx S =161.19 3 yx S =192.21 4 yx S =143.83 Population 2. (Murthy, 1967, p. 228) N = 10, n = 4 1 n =2 n2=2 1 N =5 N2=5 1 X =214.4 X2=333.8 1 Y =1925.8 Y2=3115.6
21 x =1.88 22
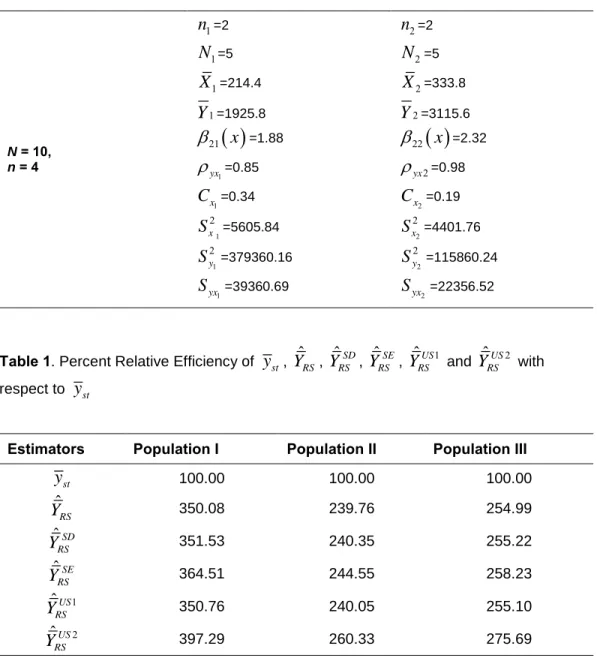
x =2.32 1 yx =0.85 yx2=0.98 1 x C =0.34 2 x C =0.19 1 2 x S =5605.84 2 2 x S =4401.76 1 2 y S =379360.16 2 2 y S =115860.24 1 yx S =39360.69 2 yx S =22356.52Population 3. (Singh and Mangat, 1996, p. 219) N = 10, n = 4 1 n =2 n2=2 1 N =5 N2=5 1 X =214.4 X2=333.8 1 Y =1925.8 Y2=3115.6
21 x =1.88 22
x =2.32 1 yx =0.85 yx2=0.98 1 x C =0.34 2 x C =0.19 1 2 x S =5605.84 2 2 x S =4401.76 1 2 y S =379360.16 2 2 y S =115860.24 1 yx S =39360.69 2 yx S =22356.52Table 1. Percent Relative Efficiency of yst, YˆRS, YˆRSSD, YˆRSSE, YˆRSUS1 and YˆRSUS2 with respect to yst
Conclusion
The conditions under which the proposed estimators have less mean squared error in comparison to the usual unbiased estimator in stratified random sampling and usual separate ratio estimator were described. Table 1 shows that the proposed estimators have the highest percent relative efficiency compared to the usual
Estimators Population I Population II Population III
st y 100.00 100.00 100.00 ˆ RS Y 350.08 239.76 254.99 ˆSD RS Y 351.53 240.35 255.22 ˆSE RS Y 364.51 244.55 258.23 1 ˆUS RS Y 350.76 240.05 255.10 2 ˆUS RS Y 397.29 260.33 275.69
unbiased estimator and separate ratio estimator, in all three populations. Thus, the proposed estimators ˆSD
RS
Y , YˆRSSE , YˆRSUS1 and YˆRSUS2 are recommended for use in
practice for estimating the population mean when the described proper conditions are satisfied.
References
Cochran, W. G. (1940). The estimation of the yields of cereal experiments by sampling for the ratio gain to produce. Journal of Agricultural Science, 30: 262-275.
Kadilar, C., & Cingi, H. (2003). Ratio estimators in stratified sampling. Biometrical Journal, 45: 218-225.
Murthy, M. N. (1967). Sampling Theory and Methods. Calcutta, India: Statistical Publishing Society.
Robson, D. S. (1957). Application of multivariate polykays to the theory of unbiased ratio-type estimation. Journal of the American Statistical Association, 52: 511-522.
Searls, D. T. (1964). The utilization of a known coefficient of variation in the estimating procedure. Journal of the American Statistical Association, 59: 1225-1226. doi: 10.1080/01621459.1964.10480765
Singh, H. P., Tailor, R., Tailor, R., & Kakran , M. S. (2004). An improved estimator of population mean using power transformation. Journal of the Indian Society of Agricultural Statistics, 58(2): 223-230.
Singh, R., & Mangat, N. S. (1996). Elements of survey sampling. Boston, MA: Kluwer Academic.
Sisodia, B. V. S., & Dwivedi ,V. K. (1981). A modified Ratio Estimator using coefficient of variation of auxiliary variable. Journal of the Indian Society of Agricultural Statistics, 33(1): 13-18.
Upadhyaya,L. N., & Singh, H. P. (1999). Use of transformed Auxiliary Variable in estimating the finite Population Mean. Biometrical Journal, 41(5): 627-636.