Supply Chains And Social Network Analysis
Rolf A.E. Mueller, Doreen Buergelt, and Linda Seidel-Lass Department of Agricultural Economics, CAU, Kiel, GermanyPaper presented at the
1st International European Forum on Innovation and System Dynamics in Food Networks February 15-17, 2007, Innsbruck-Igls, Austria.
1. INTRODUCTION:SUPPLY NETWORKS:NEW METAPHOR OR NEW MODEL?
Judged by its currency, the supply chain is one of the more successful metaphors in economics. The metaphor borrows from mechanics the idea of the chain, that is something that consists of elements that are linked to each of their two immediate neighbors and which jointly provide a strong but flexible connection. The metaphor transplants the chain-idea into the sphere of economics where, before the introduction of supply chains, chains were, for most economists, things best left in the care of ironmongers.
More than twenty years after its introduction the "supply chain"-metaphor appears to be losing its luster and a competition is underway in the literature where authors forge complicated arguments in support of metaphors which recognize that supply chains are not really linear chains but most often expansive networks (e.g. Lazzarini et al. 2001). For this reason the chief contenders for the pride of place seem to be neologisms such as "supply networks" or "net chains".
It is not obvious to us that much will be gained by replacing chain-metaphors with network-metaphors. Few practitioners of procurement, logistics and marketing will have failed to notice that not all business arrangements are strictly chain-like and only the most unperceiving will be
enlightened by the new network-metaphors. Because supply chains obviously are networks, chances are that network-metaphors will win many converts, at least for some time.
But network metaphors, like the chain metaphor, are likely to fade into oblivion, unless they are backed up by network models of supply. This is because of Krugman's rule, which holds that in economics "… the influence of ideas that have not been embalmed in models soon decays" (Krugman 1997, p. 27). Moreover, as we will shortly explain, we believe that managers of supply chains are better served by the economics profession when they are provided with quantitative models rather than with modish metaphors.
This paper is intended as an encouragement to embalm the supply network-metaphor with quantitative models. In particular, we suggest that network models based on graph theory, such as those that have been developed and successfully applied in social network analysis (SNA), also hold promise when applied to the analysis of supply networks in agribusiness.
2. WHY SUPPLY CHAIN MANAGEMENT NEEDS QUANTITATIVE MODELS
Supply networks are emergent, stable patterns in the relationships among specialized economic and public agents that are involved in the manifold coordinated activities which culminate in providing end users with a product or service. The relationships can be of many kinds but four are essential in food supply networks in Europe. The first relationship involves the exchange of goods or services and of money and the second involves the transport of goods. The third relationship is concerned with the exchange of information about a food product's quality characteristics, including
traceability information. Finally, agents need to exchange meta-information that allows them to coordinate the first three essential relationships.
In contrast to organizations, supply networks are rarely if ever under the control of a single manager. And in contrast to self-organizing markets reigned by Smith's "invisible hand", supply networks require some concerted coordination efforts by their members. Lambert and Cooper (2000) suggest that agents in a supply network should be concerned with three coordination questions: (i) Who are the key supply chain members with whom to link processes? (ii) What processes should be linked with each of these supply chain members? and (iii) What level of integration and management should be applied for each process link?
Because a relationship always involves more than one agent, productive supply network
relationships are unlikely to come about easily when the agents of a potential supply network do not share a common perception of their positions in the network. Supply networks are, however, mental constructs and there may be as many perceptions of a given network as there are minds perceiving it. Like a shared map that allows two travelers to meet at some agreed upon point, a shared model of the supply network showing agents and the linkages among them, greatly facilitates managers' task to define their position in the network, to identify agents with whom to link processes, and to define the nature of the links to specific agents.
Graphical models of supply networks abound. However, most graphical models of supply networks are little more than illustrations with ill-defined rules for encoding empirical observations into graphical symbols. Occasionally, such illustrations of supply networks which lack any scales are even invested with contents, such as width or breadth of the network, that they simply do not have (e.g. Omta et al. 2001).
Economics and management both rely on numbers. In economics numbers serve to preserve or to pretend precision of observations and to insinuate objectivity (Morgenstern 1963; Porter 1995). In management, according to Magretta (2002, p. 120) "Numbers are essential to organizational performance", and "Without measurement, progress would be impossible."
3. WHAT IS SNA?
Social network analysis (SNA) is a branch of sociology which studies collections of individuals and the linkages among them. For modeling social networks SNA employs ideas and methods from graph theory, algebra, and statistics.
SNA has its origins in social psychology and in anthropology of the first quarter of the last century. Since then SNA has undergone considerable growth: Whereas 20 SNA articles were listed in Sociological Abstracts for the 15-year period from 1960 to 1975, more than 3,000 were published in the period 1990 to 2005 (Bernard 2005).
The field possess all insignia of academic respectability: Standard texts (Wasserman and Faust 1994; Scott 2000), specialized journals (Connections, Journal of Social Structure, Revista Hispana para el Analysis de Redes Sociales, and Social Networks), its own academic organization
(International Network for Social Network Analysis (INSNA)) with its own web portal (http://www.insna.org/) and web newsletter (SOCNET), a regular conference (Sunbelt Social Network Conferences, since 1997), and graduate programs and courses at reputable universities in the U.S.A. and in Europe.
SNA has been applied to a wide range of problems, many of which are foremost of disciplinary, sociological or anthropological interest (for a recent review see Laumann 2006). Applications that are also of interest to economists include studies of the impact of networks on the adoption of innovations in agriculture (Bandiera and Rasul 2006; Temel et al. 2002) and in industry (Midgley et al. 1992), a study of the impact of social network on small farmers' ability to cope with risks
(Beuchelt 2004), a large study of corporate networks in Japan (Gerlach 1992; Lincoln and Gerlach 2004), the impact of social connections on success in finding a job (Granovetter 1974) , and a fascinating and methodologically exemplary network analysis of trade relationships in Oceania (Hage and Harary 1991). Also of interest to economists are the contributions that SNA researchers have made to the study of social capital (Lin 1999).
4. ELEMENTS OF NETWORK MODELS AND THEIR USES FOR SCM
Definitions of a social network are intuitively appealing: "A social network consists of a finite set or sets of actors and the relation or relations defined on them." And a relation, the defining element of networks, is the "collection of ties of a specific kind among members of a group." (Wasserman and Faust 1994, p. 20).
A social network model includes five components: (i) a set N of actors;
(ii) a collection L of links or ties that represent relationships between ordered pairs of actors; (iii) a "sociograph" Gd consisting of nodes, which represent actors, and directed or undirected lines between the nodes, which represent the relations among actors;
(iv) a sociomatrix or adjacency matrix A, which has as many rows and columns as there are actors and where the elements xi,j record the relationships between actors i and j; and
(v) a characteristics matrix C, which has as many rows as there are actors and as many columns as there are attributes of interest. A social network then is defined by: S = { N, L Gd, A, C }.
Some authors define networks only by means of their adjacency matrix. Thus for Newman (in press), "A network - also called a graph in the mathematics literature - is made up of points, usually called nodes or vertices, and lines connecting them, usually called edges." And Newman (in press) goes on to explain, "Mathematically, a network can be represented by a matrix called the adjacency matrix A, which in the simplest case is an n× n symmetric matrix, where n is the number of vertices
in the network. The adjacency matrix has elements Ai j= 1 if there is an edge between vertices i and j, 0 otherwise. The matrix is symmetric since if there is an edge between i and j then clearly there is also an edge between j and i. Thus Ai j = Aji.".
4.1 Actors
The actors N in a social network can be anything that can be represented by nodes in a graph. In a supply network, for instance, the actors could be the producers, processors, transporters, retailers, regulatory agencies, or certification providers.
4.2 Links
The set L of links or ties in a social network represents whatever connects pairs of actors. In a supply network this could be flows of material, flows of money, flows of product information, information required to carry out transactions, or of meta-information required for network
coordination. Beyond representing the essential flows in a supply network, links may also reflect relationships that are unrelated to the core functions of the network, such as financial partnerships.
Relationships between the actors in a network may be of many forms, but the ability to model them are limited in graph theory. Links may be simple and only indicate that a connection of a certain kind exists between actors. Directed links indicate the direction of a relationship, e.g. the direction of an information or product flow. Valued or weighted links also indicate the intensity or frequency of a relationship. Finally, actors may be connected by several relationships, each
requiring a separate link.
4.3 Sociograph or network drawings
The natural representation of a graph is a drawing of it. Convention suggests that network actors are represented as vertices or dots whereas relationships are shown as the edges or lines of a network drawing. In some pictures of networks actor characteristics are encoded by the size, color, or shading of the dots. Directed links are represented by arrows and valued links are represented by lines with numbers attached.
Drawings of networks are without dimensions. The positions where the nodes are placed in a network drawing are therefore unconstrained by coordinates and the distances between the dots and angles between the lines of a network drawing are meaningless. How a network is actually drawn is, however, not totally arbitrary and several conventions for drawing aesthetically pleasing networks have evolved (see Section 6.1).
4.4 Adjacency matrices
The adjacency matrix A of a network is a quadratic matrix which has as many rows and columns as there are actors in the network and the elements aij of this matrix represent the links or ties between the actors. Conventionally, all elements on the main diagonal of an adjacency matrix are set at aii = 0.
Networks with undirected and unvalued links yield symmetric adjacency matrices with
elements aij = {0,1}. Typical extensions of the most basic network models are models with directed edges or arcs which represent ties that run in certain directions, such as flows of merchandise, or information. Such networks are known as digraphs an adjacency matrices of digraphs usually are not symmetric because they may contain elements for which aij ≠ aji holds. In networks with weighted or valued links the elements may be some real number: aij ∈ℜ. Networks with several types of links cannot be represented with a single adjacency matrix but require a separate matrix for each type of link.
4.5 Actor characteristics matrix
Social network analysis is concerned with the relationships among actors and actor attributes other than those related to the network are a secondary concern. Nevertheless, network managers and analysts may be interested in correlating network attributes of actors, which may be derived from the adjacency matrix, with other actor characteristics. Data on these characteristics may then be assembled in an actor characteristics matrix C which has as many rows as there are actors in the network and a column for each actor characteristic.
The values of the entries cij in this matrix depend on the scale with which the characteristics are measured; they may be binary cij = {0,1} or real valued cij ∈ℜ.
4.6 Affiliation networks
In SNA a distinction is made between one-mode and two-mode networks. One-mode networks model only one type of agent, which means that differences among agents are not reflected in the model. Two-mode network contain two types of nodes, typically agents and "events". Such
networks are called affiliation networks because the agents are related by the events, and the events are related by the agents. To give an example from supply networks, some members of a supply chain may be participating in one type of certification program whereas others may have opted for some other certification schemes. The certification schemes would then be the "events" that link subsets of agents. Similarly, the certification schemes would be linked to each other by those agents who are members of several schemes.
If there are n actors and m events, an affiliation matrix F obtains with elements fij = 1 if agent i is a member of event j, and fij = 0 otherwise. From the affiliation matrix F adjacency matrices A can be obtained for the agents and the events by pre- or post-multiplying F with its transpose F'.
5. NETWORK DATA
Empirical network modeling requires two types of data: Attribute data that describe properties of actors and relational data that describe the relations (connections, contacts, ties, etc.) between actors. A key difficulty in empirical SNA modeling arises when ties are not observable directly and for some analyses the actors are the only source for data on relationships. Selection of actors therefore often is the crux in empirical SNA research. Identifying supply chain members is also an issue in supply chain management. For instance, Lambert and Cooper (2000, p. 68) observe: "… a major weakness of much of the SCM literature is that the authors appear to assume that everyone knows who is a member of the supply chain. There has been little effort to identify specific supply chain members …" In SNA several approaches for selecting actors have been developed such as
selection by affiliation, complete enumeration approaches, or snowballing techniques (Wasserman and Faust 1994; Scott 2000).
With actors identified, data on relationships among actors and on actor characteristics may be collected using conventional data collection methods. The data may then be organized in two data sets: (i) the adjacency matrix A of size n × n, or an affiliation matrix F of size n × m, and (ii) a characteristics data matrix C of size n × l. For a network with n actors and l actor characteristics the number of data that have to be recorded and managed is given by: (n • l) + (n • n) = n (l + n). Because an adjacency matrix is required for each type of relation between actors, the volume of data for a network with r relations works out as:
DV = (n • l) + r (n • n) = n (l + r • n).
Note that the volume of data increases with the square of the number of actors n in the network. For example, a network with n = 50 actors, r = 4 relations, and l = 10 actor characteristics generates 10,500 data items; when the number of actors doubles to n = 100 the number of data items nearly quadruples to 41,000. Obviously, SNA modeling can quickly become rather data intensive.
When collecting data from a population of objects threatens to become excessively
burdensome, the usual strategy is to take a representative sample drawn from the population of objects. The strategy is of limited value for network data collection because "a representative sample of agents, does not, in itself, give a useful sample of relations" (Scott 2000, p. 59).
6. POTENTIAL OF SNA FOR SCM
In order to perform adequately, network managers must posses at least three things: (i) a vision of what management wants to achieve with the supply network; (ii) a workable model that specifies how network activities and processes are related to network outcomes, and how variables under the control of management affect network outcomes, and (iii) an information system that supplies the data - preferably numbers - needed for decision making. SNA provides a workable model of networks which relates network attributes to measures of network outcomes, and it provides a framework for collecting and analyzing data useful for planning and monitoring changes in network operations. Essential tools that network models based on graph theory can provide for network managers and analysts are: (i) network diagrams, (ii) quantitative measure describing network-related attributes of individual network members, and (iii) quantitative and qualitative measures of the whole network.
6.1 Network diagrams
Managers, when they describe their organization, usually use an organization chart, which is a specific graph, a tree, that shows the actors of the organization and the relationships between them. Using drawings for navigating through a supply network is therefore natural for most or all
managers. Like all graphics, network drawings reduce search, facilitate recognition, and they may suggest interesting new perspectives and inferences about a supply network.
Drawing network graphics is an art that is usually performed by graphics algorithms. Some widely accepted heuristics that are programmed into good software programs for network drawings are: (i) take into account the limited resolution of display devices and the human eye; (ii) keep angular resolution between lines high, i.e. maximize the smallest angle; (iii) minimize the number of line crossings; (iv) minimize graphics area; (iv) maximize the display of symmetries; (vi) ensure consistent graphical encoding, (e.g. the most important actor in the middle, thick lines for strong ties, etc); (vii) keep lines short, and (viii) nodes with strong ties should be close to each other.
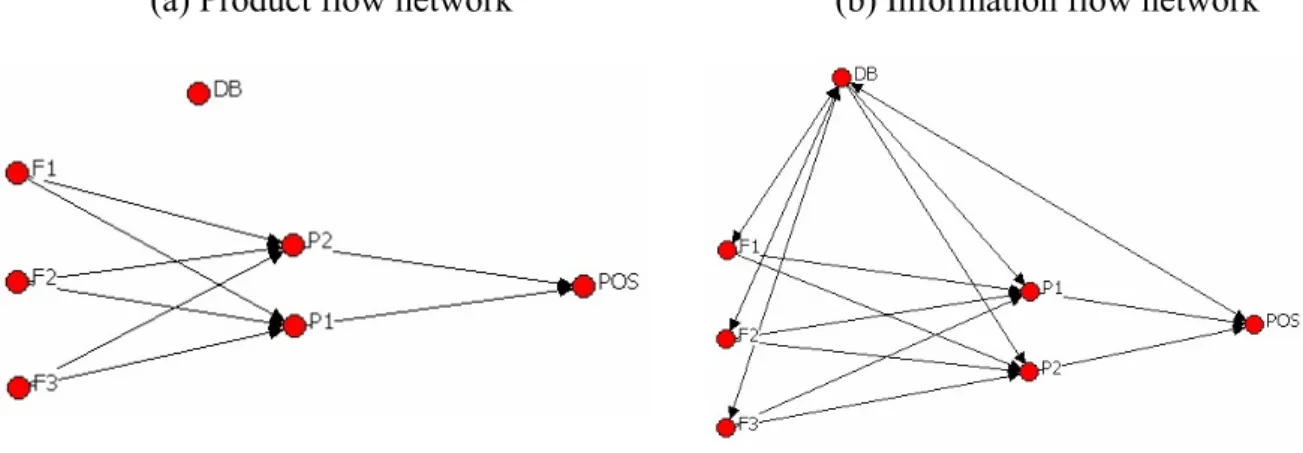
Figure 1 shows two drawings by a computer program (NetDraw) of a stylized supply network for meat. The network has been modeled as a directed multigraph with two types of relationships: (a) product flows and (b) information flows.
Figure 1: Two views of a stylized supply network for meat.
(a) Product flow network (b) Information flow network
Source: Gampl 2006.
6.2 Measures of network attributes
The literature on measures describing networks is vast. All we can do here is to mention some measures that we believe should be of interest for managers whose business is integrated into a supply network. Much of the SNA literature is concerned with measures for networks with
undirected and unweighted links. Such measures are suitable for analyzing the information network of a supply networks because information often flows in both directions of a relationship. Measures for undirected networks are, however, inadequate for analyzing the product flow in supply networks
s, 's
6.2.1 Attributes of agents
because this flow is always directed towards the end users. Measures for directed networks therefore must also be employed when supply networks are studied or managed. All measure whether they are for directed or undirected, weighted or unweighted, are derived from a network adjacency matrix.
A question of unwavering interest to network analysts is: "Who is the most import actor in the four
rs in the network.
For e
he
inction is made between the indegree and the outdegree of an actor. The
ree is
her actors are take
n
m
ctor who lies on the path
network?" In SNA "important" is translated into "having a central position in the network" and centrality measures are often used: "degree", "closeness", and "betweenness".
The degree of an actor is defined by the number of its links with other acto
purposes of comparison, the "actor degree" may be standardized by the number of actors in th network. When the relationship data are binary, the degree is equal to the row sum or the column sum of the adjacency matrix. The degree of an agent in a supply network indicates, for example, how intensively that agent is connected with his peers. The degree says, however, nothing about t intensity of the relationships.
In directed networks a dist
indegree of an actor i is the number of directional links that terminate at that actor, and the outdegree is number of directional links ties that originate from that actor. On the basis of the number of their in- and out-degrees actors may be classified as "transmitters" when their indeg zero and their outdegree is larger than zero; "receivers" have a zero outdegree and a non-zero indegree, and the indegrees and outdegrees are both larger than zero for "carriers".
Degree is a measure of local centrality because only the direct connections to ot
n into account. Closeness centrality, in contrast, is a measure of global centrality. Closeness centrality is the inverse of the sum of the distances of an actor to all other actors in the network. I an undirected and unweighted network distance is measured as the geodesic between the actors, which is the path with the smallest number of actors along the way. The actor with the smallest su of his geodesics to all other agents in the network then is the most globally central actor in the network. The measure can be extended to directed and weighted networks.
Betweenness Centrality, finally, is a measure based on the idea that an a
s connecting many other actors exerts control over the flow of resources or information that travel along these paths. Betweenness Centrality of actor some actor j therefore counts the geodesics between all other actors i and k and which pass through actor j.
6.2.2 Network attributes
Network topology affects the flows of resources and information in a network: "… information does not travel uniformly throughout the network. It travels according to the local topography." (Brown and Duguit 2000, p. 144).
The most basic characteristics of a network are its diameter and its completeness. The diameter of a network is the length of the largest geodesic between any pair of actors in the network. A network is complete when each actor is connected to all other actors. A complete network has the highest possible density of a network, where the density is defined as the proportion of possible links that are actually present in the network. Knowing the density of a network may be useful for the manager of a network to assess whether agents need to be encouraged to link up with each other.
Cut points, cut sets, and bridges are elements of strategic importance for a network. A cut point is an actor whose removal from the network causes the network to disintegrate into two or more sub networks that are unconnected with each other; cut sets are similarly defined. A bridge is a link of equivalent strategic importance: if removed, a bridge-link causes a network to disintegrate. The importance for managers of knowing the cut points, cut sets, and bridges in a supply network is obvious.
A k-core is defined as a maximal sub network in which each agent is adjacent to at least k other agents; in other words, all agents that belong to a k-core have a degree equal to k or higher.
Comparison of k-cores of a network for different levels of k provide some insight into the strength of the connectedness of the agents.
7. SNA-MODELING SOFTWARE
Quantitative models have no chance of being applied by managers unless they are implemented in reliable software. We therefore provide a brief overview of standard SNA software packages (for a more detailed account see Huisman and van Duijn 2005). There are six software packages that are widely used in the SNA community; four packages are freeware (MultiNet, StOCNET,
STRUCTURE, and Pajek) and two are priced products (NetMiner, UCINET).
Most packages allow relational data to be entered into a matrix but some also use ASCII-lists for entering data on nodes or on links. Entry of lists is more convenient for large data sets. Some additional software tools are provided for converting data across file formats; for instance a Pajek add-on allows Excel or text files to be converted into a Pajek-readable format.
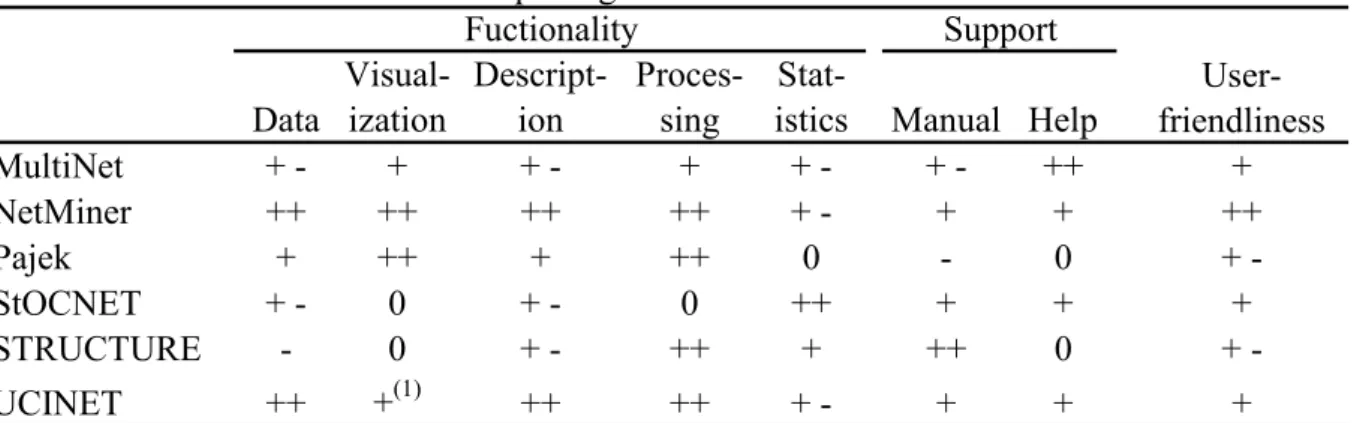
Some software packages, Pajek and NetMiner in particular, have strong graphics capabilities (see Table 1) whereas UCINET is particularly strong with regard to standard descriptive analysis. UCINET, Pajek and NetMiner have strong procedure-based analysis capabilities, which are, however, of limited interest for supply network analysis. StOCNET is specialized on statistical modeling, which is seems to be of limited relevance for supply network management and analysis. STRUCTURE runs on DOS and is therefore bound to fade with this operating system.
Tab. 1: Scores for selected software packages
Data Visual-ization Descript-ion Proces-sing
Stat-istics Manual Help
MultiNet + - + + - + + - + - ++ + NetMiner ++ ++ ++ ++ + - + + ++ Pajek + ++ + ++ 0 - 0 + -StOCNET + - 0 + - 0 ++ + + + STRUCTURE - 0 + - ++ + ++ 0 + -UCINET ++ +(1) ++ ++ + - + + +
(1) The programm NetDraw for network visualization is distributed with UCINET.
Source: Huisman and van Dujin 2005), p. 311.
User- friendliness Fuctionality Support
When applied to the analysis of supply networks, software should be capable to handle large data sets, provide a large range of descriptive measures and have strong graphics capabilities. From our experience with the four freeware packages, Pajek appears to be the best suited for this purpose, with UCINET being the runner-up because of entering large date sets is less convenient with this program than with Pajek.
8. CLOSE
The purpose of this paper was to suggest that network models founded in graph theory are a more seminal and productive alternative to the various network metaphors suggested in the supply chain literature. We are, however, aware that some metaphors, like weeds, are difficult to eradicate from the brains where they have set roots. Nevertheless, we are quite confident that in supply chain research, like in the rest of economics, quantitative models will eventually prevail over metaphors.
9. REFERENCES
Bandiera, Oiana and Rasul, Imran. "Social networks and technology adoption in Northern Mozambique." Economic Journal, 2006, 116, pp. :869-902.
Bernard, H. Russel. "Review: Linton C. Freeman, The Development of Social Network Analysis: A Study in the Sociology of Science." Social Networks, 2005, 27, pp. 377-384.
Beuchelt, Tina. Vulnerability of Rural Households in Vietnam (Son La Province) – A Network Analysis of Risk-Management. Master Thesis, Institute for Agricultural Economics and Social Sciences in the Tropics and Subtropics, University of Hohenheim, 2004.
Brown, John Seely and Duguid, Paul. The Social Life of Information. Boston, Mass.: Harvard Business School Press, 2000.
Carrington, Peter J., Scott, John and Wasserman, Stanley. Models and Methods in Social Network Analysis. Cambridge: Cambridge University Press, 2005.
Gampl, Birgit. Rückverfolgbarkeit von Lebensmitteln. Göttingen: Cuvillier Verlag, 2007.
Gerlach, Michael L. "The Japanese corporate network: A blockmodel analysis." Administrative Science Quarterly, 1992, 37(1), pp. 105-139.
Granovetter, Mark. Getting a Job: A Study of Contacts and Careers. Cambridge: Cambridge University Press, 1974.
Hage, Per and Harary, Frank. Exchange in Oceania. Oxford: Clarendon Press, 1991.
Huisman, Mark and van Duijn, Marijtje. Software for Social Network Analysis. In: Carrington, Scott, Wasserman (eds.) Models and Methods in Social Network Analysis, Cambridge Univ. Press, New York. 2005.
Krugman, Paul. Development, Geography, and Economic Theory. Cambridge, Mass.: MIT Press, 1997.
Lincoln, James and Gerlach, Michael. Japan’s Network Economy. Cambridge: Cambridge University Press, 2004.
Midgley; David F.; Morrison, Pamela D. and Roberts, John, H. "The effect of network structure in industrial diffusion processes." Research Policy, 1992, 21, pp. 533-552.
Lambert, Douglas M. and Cooper, Martha C. "Issues in supply chain management." Industrial Marketing Management, 2000, 29, pp. 65-83.
Lazzarini, Sergio G., Chaddad, Fabio R. and Cook, Michael L. "Integrating supply chain and network analyses: The study of netchains." Journal of Chain and Network Science, 2001, 1(1), pp. 7-22.
Lin, Nan. "Building a network theory of social capital". Connections, 1999, 22(1), pp. 28-51.
Magretta, Joan. What management is. New York, NY: The Free Press, 2002.
Morgenstern, Oskar. On the Accuracy of Economic Observations. Princeton, NJ: Princeton University Press, 1963.
Newman, Mark .E.J. "The mathematics of networks." In: Blume, L.E. and S. N. Durlauf, S.N. (eds). The New Palgrave Encyclopedia of Economics, 2nd ed. Basingstoke: Palgrave Macmillan, in press. www.personal.umich.edu/~mejn/papers/palgrave.pdf
Omta, S.W.F., Trienekens, Jaques H. and Beers, George. "Chain and network science: A research framework." Journal of Chain and Network Science, 2001, 1(1), pp. 1-6.
Porter, Theodore M. Trust in Numbers. Princeton, NJ: Princeton University Press, 1995.
Scott, John. Social Network Analysis. London: Sage Publications, 2000.
Temel, Tugrul, Janssen, Willem and Karimov, Fuad. The Agricultural Innovation System of Azerbaijan: An Assessment of Institutional Linkages. The Hague: International Service for National Agricultural Research, 2002.
Wasserman, Stanley and Faust, Katherine. Social Network Analysis. Cambridge, UK: Cambridge University Press, 1994.