Copyright
q
1997, American Society for Microbiology
Characterization of Specific Immunoglobulin G (IgG) and
Its Subclasses (IgG1 and IgG2) against the 23-Valent
Pneumococcal Vaccine in a Healthy Adult Population:
Proposal for Response Criteria
MARIA-JOSE´ RODRIGO,
1MARC MIRAVITLLES,
2* MARIA-JESUS CRUZ,
1JAVIER
DEGRACIA,
2MONTSERRAT VENDRELL,
2CARLOS PASCUAL,
1ANDFERRAN MORELL
2Departments of Biochemistry (Immunology Unit)
1and Pneumology,
2Hospital General Vall d’Hebron, Barcelona, Spain
Received 13 July 1996/Returned for modification 16 October 1996/Accepted 19 December 1996
The aim of the study was to standardize an enzyme-linked immunosorbent assay (ELISA) method for the
quantification of immunoglobulin G (IgG) and its subclasses (IgG1 and IgG2) against the 23-valent
pneumo-coccal vaccine and to establish the criteria for a normal response to the vaccine. Forty healthy individuals (20
women and 20 men; mean age, 29 years) were studied. All were vaccinated with the 23-valent pneumococcal
vaccine; blood samples were drawn just prior to and 3 weeks after immunization. Quantification of specific IgG
and its subclasses was performed by an ELISA with the vaccine as the antigen. The linearity of the ELISA
method was demonstrated by the similar slopes of the linear regression lines generated from the titration of
sera with different antibody concentrations. The specificity of the antibodies against the vaccine was
demon-strated by (i) an absorption test with pneumococcal vaccine, (ii) a cross-reactivity experiment with
Haemophilus
influenzae
type b polysaccharide, and (iii) affinity chromatography with protein A-Sepharose. Response to the
vaccine was defined by using the lower level of the 90% probability interval (one-tailed) for
postimmunization-specific IgG, IgG1, and IgG2. By using this cutoff, responders were considered to be those with an absolute
increase in antibody titers higher than 395 arbitrary units/ml for IgG, 0.350
A
450units for IgG1, and 0.314
A
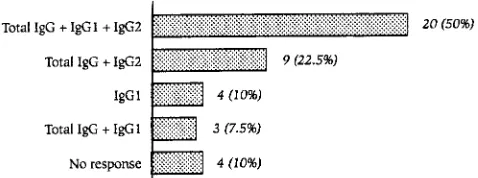
450units for IgG2. Overall, 20 (50%) subjects had IgG, IgG1, and IgG2 responses, 9 (22.5%) had IgG and IgG2
responses, 4 (10%) had IgG1 responses, 3 (7.5%) had IgG and IgG1 responses, and 4 (10%) were
nonre-sponders. Ninety percent of our population responded to the 23-valent pneumococcal vaccine. Up to 10% of
healthy individuals may respond to an IgG subclass without significant increases in total IgG titers. The ELISA
method that is described may be useful for evaluating the specific antibody response against polysaccharides.
The latest review of humoral immunodeficiencies by the
World Health Organization includes a syndrome characterized
by a lack of response to polysaccharide antigens (30). This
impaired antibody response has also been observed to be
as-sociated with known immunologic deficiencies such as
com-mon variable immunodeficiency (6, 25), immunoglobulin A
(IgA) deficiency (7, 21), or IgG subclass deficiency (8, 26).
Diagnosis of this syndrome requires demonstration of an
impaired antibody response to polysaccharide vaccines such as
the pneumococcal vaccine. Different studies carried out to
diagnose this syndrome, as well as those conducted to assess
the response to the pneumococcal vaccine in risk groups, have
been hampered by the need for a control group, since no
adequate standardization of a normal response to the vaccine
exists. In order to establish criteria for the normal specific
response, it is indispensable to know natural and
postimmuni-zation levels in a healthy adult reference population. The aim
of this study was to establish an enzyme-linked immunosorbent
assay (ELISA) method to quantify specific IgG and its
sub-classes in subjects immunized with the 23-valent pneumococcal
vaccine and to establish the criteria for a normal response to
this stimulation. These criteria could be used to (i) identify
patients with impaired antibody responses to polysaccharides
(1, 30) and (ii) evaluate antibody responses in certain risk
groups that are candidates for the vaccine (22).
MATERIALS AND METHODS
Study population.Forty healthy nonrelated volunteers (20 women and 20 men; age range, 21 to 48 years; mean age, 29.5 years) were studied.
Immunization.All individuals were vaccinated with 0.5 ml of PNU-Immune 23 polyvalent antipneumococcal vaccine (Lederle Laboratories Division, Pearl River, N.Y.) administered intramuscularly in the deltoids. This vaccine contained 25mg of each of the 23 specific capsular polysaccharides. Blood samples were obtained from each individual prior to and 21 days postvaccine administration. These samples were centrifuged at 3,000 rpm for 15 min, and the sera were obtained, stored in aliquots, and frozen at2208C until they were studied.
Immunoglobulin quantification.IgG, IgA, and IgM levels were determined by kinetic nephelometry (Array Protein System; Beckman Instruments, Brea, Cal-if.). The reference values established in our laboratory were as follows: IgG, 8.5 to 16 g/liter; IgA, 0.75 to 3.5 g/liter; and IgM, 0.58 to 2.5 g/liter.
The levels of the IgG subclasses were determined by an ELISA technique. The reference values established in our laboratory were as follows: IgG1, 2.61 to 10.81 g/liter; IgG2, 1.12 to 4.08 g/liter; IgG3, 0.22 to 2.88 g/liter; and IgG4, 0.05 to 1.56 g/liter (18).
Specific IgG and IgG subclasses to pneumococcal vaccine.Specific IgG to
Streptococcus pneumoniaewas determined by an ELISA based on the method described by Metzger et al. (15) but that was modified by using the pneumococcal vaccine as the antigen. Each well of high-level-binding microtiter plates (Costar, Cambridge, Mass.) contained 10mg of antigen in 0.2 M carbonate-bicarbonate buffer (pH 9.6), and the plates were incubated at 48C overnight. Washing (0.1 M phosphate-buffered saline [pH 7.5], 0.005% Tween 20) and blocking (phosphate-buffered saline, 1% bovine serum albumin) were then performed. After the washing, the plates were incubated with sera by using a standard curve at appropriate dilutions for 2 h at 378C, in duplicate. The results were then com-pared with those on the standard curve. After the washings, horseradish perox-idase-labelled anti-human IgG (clone MH16-1ME; 0.5mg/ml) was incubated for 2 h at 378C. Following the washing, the reaction was developed with 3,39,5,59
-* Corresponding author. Mailing address: Servei de Pneumologia,
Hospital General Vall d’Hebron, P. Vall d’Hebron 119-129, 08035
Barcelona, Spain. Phone and fax: 34-3-428.61.04.
168
on August 17, 2020 by guest
http://cvi.asm.org/
tetramethylbenzidine–3% H2O2for 20 minutes at room temperature in the dark. The reaction was stopped with 2 M H2SO4, and the results were read at 450 nm with a plate reader (Titertek Multiskan Plus MKII).
The results were expressed as arbitrary units by using a reference serum containing 2,240 U/ml calibrated against a pneumococcal reference preparation labelled PN-A, with an assigned value of 70 pneumococcal IgG antibody U/ml, from the European Quality Scheme for specific antibodies (Oxfordshire Health Authority, John Radcliffe Hospital, Oxford, United Kingdom), kindly donated by N. Matamoros (Hospital Son Dureta, Palma de Mallorca, Spain). To study the behavior of sera compared to that of the reference serum, we performed titra-tions of five serum samples with antipneumococcal antibody levels of between 150 and 2,250 U/ml. The curves obtained for the sera and the reference serum were plotted for linear regression analysis.
The amounts of specific IgG1 and IgG2 were determined by the same method used to determine the amount of specific total IgG by using horseradish perox-idase-labelled anti-human IgG1 (clone MH161-1) and IgG2 (clone HP6014), and the results were expressed asA450units. For specific total IgG, the minimal amount of antibody detectable by this assay was 0.11 U/ml. This value was obtained as the mean plus 3 standard deviations of the value for the calibrator with a value of 0 performed for 20 determinations. Within-run and day-to-day coefficients of variation were 7.6 and 10.5%, respectively.
For the IgG subclasses, the minimal amount of antibody detectable by these assays was 0.200A450unit above the value for the blank. The limit of detection was calculated on the basis of the mean plus 3 standard deviations of the value for the blank also performed for 20 determinations. Within-run and day-to-day coefficients of variation were 6.5 and 10.6%, respectively, for IgG1 and 10.3 and 11.3%, respectively, for IgG2.
Specificity of the antibodies to vaccine. (i) Inhibition experiments.Increasing concentrations (range, 0 to 80mg/ml) of pneumococcal vaccine were incubated with 1 ml of a 1:50 dilution of two pools of sera with specific IgG concentrations of 9,250 and 150 U/ml, respectively, for 2 h at 378C and were separated by centrifugation at 3,500 rpm before the addition of serum to vaccine-coated plates. The procedure was carried out three times.
(ii) Cross-reactivity between anti-S. pneumoniaeand anti-Hib antibodies. Be-cause the capsular antigens ofS. pneumoniaeandHaemophilus influenzaeare both polysaccharide antigens, we tested to see whether binding in the anti-S. pneumoniaeELISA of any serum could be inhibited byH. influenzaetype b (Hib) polysaccharide.
The same two pools of sera used in the inhibition experiments were incubated with increasing concentrations ofH. influenzaepolysaccharide (range, 0 to 80 mg/ml) for 2 h at 378C and the contents were separated by centrifugation at 3,500 rpm. The amount of specific IgG toS. pneumoniae in the supernatant was measured by the same ELISA method.
(iii) Purified IgG antibodies.To obtain IgG-enriched antibody preparations, affinity chromatography with protein A–Sepharose CL-4B (Pharmacia Diagnos-tics, Uppsala, Sweden) was performed (13). The column (5 ml) was equilibrated with 20 mM phosphate buffer (pH 7.2). A postvaccination serum pool (IgA, 226 mg/dl; IgM, 112 mg/dl; IgG, 1,190 mg/dl; IgG1, 717 mg/dl; IgG2, 493 mg/dl; IgG3, 76 mg/dl; IgG4, 33 mg/dl; and specific IgG toS. pneumoniae, 3,300 U/ml) was loaded in the column and the column was washed with the equilibrated buffer. Bound proteins were removed with 100 mM glycine buffer (pH 3). The fractions from the peak maxima (higher than 0.200A280unit) of the two eluates obtained were collected. The immunoglobulins, including IgG subclasses and IgG specific toS. pneumoniae, were determined in each eluate.
Data analysis.The results were expressed as the mean and 95% confidence interval (CI) of the pre- and postimmunization antibody titers; the same results were calculated for differences and ratios of antibody titers. For calculations, antibody titers, as well as changes in titers, were transformed to their natural logarithms to meet the assumption of normality. Because of the characteristics of this transformation, whenever the difference between post- and preimmunization titers was negative or the ratio was,1, these values were assigned the lowest value of the variable.
In these calculations, samples with undetectable levels were also assigned the value of the lower limit of detection. An arbitrary value was defined as the minimum significant increase to define the response to the vaccine. This value corresponds to the lower limit of the 90% probability interval (one-tailed) of the variables comprising the amounts of specific IgG, IgG1, and IgG2 postimmuni-zation. All subjects showing an increase in specific antibody titers equal to or greater than this value were considered responders.
RESULTS
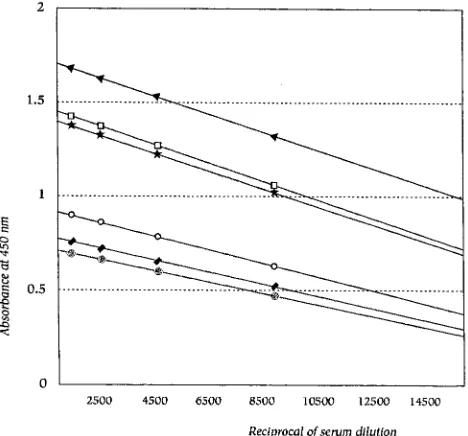
Linearity of the ELISA method.
Each serum sample was
tested at different dilutions to create a curve. Figure 1 shows
the regression lines that were generated. The slope of each
curve was similar to that for the reference serum, and thus, we
may assume that the behaviors of sera and the reference serum
do not differ. In all, eight different dilutions of each serum
sample were tested, and the regression lines were created with
four points.
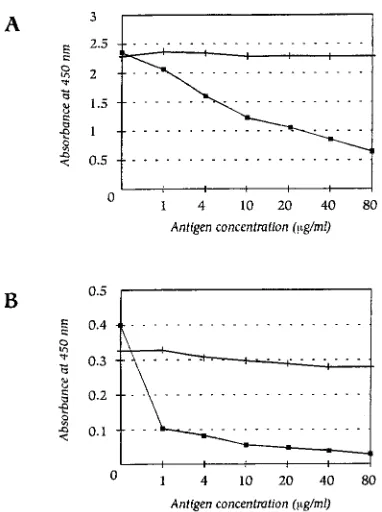
Specificity of the antibodies to the vaccine. (i) Effect of
adsorption with the pneumococcal vaccine.
Results of
inhibi-tion experiments in which the pneumococcal vaccine was
added to the sera showed decreases in the mean
A
450of from
2.5 to 0.6 and from 0.4 to
,
0.05, indicating effective
competi-tion with the coated pneumococcal polysaccharides for
anti-body binding (Fig. 2).
(ii) Cross-reactivity experiment.
As expected, soluble Hib
polysaccharide added to the sera did not decrease the
absor-bance of specific IgG to
S. pneumoniae
before or after
incu-bation with Hib polysaccharide (Fig. 2).
(iii) Purified IgG antibodies.
Figure 3 shows the elution
patterns obtained from affinity chromatography with protein
A-Sepharose. In the first peak, containing fractions with
elu-tion volumes of between 4 and 10 ml, the following results were
obtained: IgG, 20 mg/dl; IgA, 97 mg/dl; IgM, 30 mg/dl; IgG1,
,
5 mg/dl; IgG2,
,
5 mg/dl; IgG3, 20 mg/dl; IgG4,
,
5 mg/dl;
and IgG specific to
S. pneumoniae
, 17 U/ml.
The results for the second peak, containing fractions with
elution volumes of between 14 and 20 ml, were as follows: IgG,
716 mg/dl; IgA, 19 mg/dl; IgM, 16 mg/dl; IgG1, 400 mg/dl;
IgG2, 320 mg/dl; IgG3,
,
5 mg/dl; IgG4, 16 mg/dl; and IgG
specific to
S. pneumoniae
, 3,200 U/ml.
Antibody response to the vaccine.
Table 1 presents the
val-ues for specific antipneumococcal IgG, IgG1, and IgG2
pre-and postimmunization in our study population.
To define response in our population, we calculated the 90%
CI (one-tailed) of the log-transformed titers of total IgG, IgG1,
and IgG2 in postimmunization sera. The lower limits of the CI
were 395 U/ml for IgG, 0.350
A
450units for IgG1, and 0.314
A
450units for IgG2. We took these values to be the minimum
significant increase and defined a responder as an individual
who has an increase in antibody titers greater than these
val-ues.
Figure 4 presents the distribution of responses of specific
IgG and its subtypes (IgG1 and IgG2). Of the 40 subjects
studied, 32 (80%) met the response criteria for specific total
FIG. 1. Regression lines for samples with different antipneumococcal anti-body titers and the reference serum sample. Titers of antibodies and slopes are presented.ç, 2,560 U/ml (Sl,24.631025; reference serum);V, 600 U/ml (Sl,
23.531025);l, 300 U/ml (Sl,2331025);VV, 150 U/ml (Sl,22.731025);., 2,050 U/ml (Sl,2531025);h, 2,250 U/ml (Sl,24.931025).
on August 17, 2020 by guest
http://cvi.asm.org/
IgG, 27 (67.5%) met the response criteria for IgG1, and 29
(72.5%) met the response criteria for IgG2. Of the eight who
failed to respond adequately with total IgG, four responded
with IgG1 and four presented no response with any of the
subclasses.
To establish response reference values for each of the
sub-classes, the means (95% CIs) for postvaccine values of
re-sponders were used for IgG1 and IgG2 and were 1.118 (0.949
to 1.318;
n
5
27) and 1.376 (1.192 to 1.559;
n
5
29)
A
450units,
respectively.
DISCUSSION
In this study, an ELISA method was used to assess specific
IgG and its subclasses against pneumococcal capsular
polysac-charide antigens. Like Siber et al. (23) and Mascart-Lemone et
al. (14), we used the polyvalent pneumococcal vaccine coupled
to the polystyrene plate as the antigen. The inconvenience of
using the vaccine is that polysaccharides bind poorly to plastic
surfaces, and high concentrations must be used with extended
coating times (2); in contrast, it possesses the advantage that it
is not conjugated with any protein, and therefore, the response
detected is specific to polysaccharides. The specificity of this
method is demonstrated by (i) the decrease in specific
anti-pneumococcal IgG titers obtained in postvaccination samples
prior to adsorption of the same sample with polysaccharide
antigens (Fig. 2), (ii) the lack of cross-reactions with Hib (Fig.
2), and (iii) the results obtained after IgG purification by
af-finity chromatography with protein A (Fig. 3).
Our ELISA method differs in some aspects from the
pre-liminary standard pneumococcal ELISA protocol proposed by
the World Health Organization (10), because our study was
initiated in 1993 before the World Health Organization project
started. In any event, the standard protocol is directed mainly
to the use of a standard method of evaluating the
immunolog-ical efficacies of the new conjugated vaccines and uses a
refer-ence serum composed of 10 serotypes, the total antibody
val-ues of which are still considered provisional. Our aim was to
define the criteria for the antibody response to pneumococcal
polysaccharides for use in the diagnosis of the lack of response
to polysaccharide antigen syndrome in patients with recurrent
respiratory infections. For this purpose, the use of particular
FIG. 2. Effect of absorption with pneumococcal vaccine and cross-reactivity between anti-S. pneumoniaeand anti-Hib antibodies. (A) Serum with specific IgG toS. pneumoniaeof 9,250 U/ml (2.5A450units). (B) Serum with specific IgG toS. pneumoniaeof 150 U/ml (0.4A450units).n, adsorption with pneumococcal vaccine; , adsorption with Hib vaccine.
FIG. 3. Elution patterns of a pool of sera from individuals postvaccination obtained by protein A–Sepharose CL-4B affinity chromatography.M, phosphate, 20 mM (pH 7.2); , glycine, 100 mM (pH 3);&, units.
on August 17, 2020 by guest
http://cvi.asm.org/
serotypes as antigens might lead to misdiagnosis, since, owing
to different previous exposures, different geographical
distri-butions of serotypes, or simply chance, a lack of response to
these serotypes does not rule out an appropriate response to
others.
By our ELISA method we observed that 80% (32 of 40) of
our population responded with a significant increase in their
specific total IgG titers and 10% (4 of 40) responded with an
increase exclusively in IgG1, but with no significant
modifica-tion in their total IgG values. In view of this, we propose that
the response of the different IgG subclasses together with total
IgG be studied before classifying an individual as a
nonre-sponder. Since a lack of response to any particular IgG
sub-class may be normal, the concentrations of different specific
IgG subclasses should be compared with the range of
concen-trations of the controls who responded with this particular
subclass. The postimmunization titers of responders for both
IgG1 and IgG2 are presented in the Results section.
There is no uniform criterion for the expression of a specific
antibody response. Thus, some studies express response as the
fold increase. Wong et al. (29) found a mean increase in
spe-cific IgG of 7.3 times in healthy volunteers, and Cryz et al. (4)
considered a response to exist when the increase was equal to
or higher than four times the basal value and found responses
in 77% of white Anglo-Saxon individuals and 45% Hispanics.
In contrast, Kroon et al. (11) considered an increase of more
than twice the basal value to be positive, and in a study with 10
healthy subjects, all of whom were responders, they found a
mean increase of 5.8, a little higher than the 4.2 found in our
study. Musher et al. (16), using an ELISA method and the
same criterion as before, found 93 to 100% responders to five
pneumococcal polysaccharides among 15 healthy individuals.
Those same investigators, in a later work (19) with 25
individ-uals, found a lower percentage (between 60 and 84%) of
re-sponders, similar to the 80% found in our population for total
IgG by using our response criterion. In a recent study, Weiss et
al. (28) obtained results similar to ours for a control group of
15 healthy individuals with a mean age similar to that of our
group (30.5 years): a mean fold rise in antibody titers for five
separate polysaccharides of from 3.1 to 13.5 and a proportion
of responders (those with at least a twofold increase) to the
different polysaccharides of from 40 to 87%. However, other
investigators define response as obtaining some
postimmuni-zation values considered to be protective. In this respect, some
investigators have suggested a protective pneumococcal
anti-body level of 300 ng of N/ml, as measured by
radioimmunoas-say (12). This approach may give rise to error, since a normal
immune response and protective levels are not synonymous.
Moreover, protection against pneumococcal infection depends
on many other immunologic as well as nonimmunologic factors
(9). The use of fold increases to assess response offers the
advantage of permitting comparisons with other laboratories
since they are not influenced by the units used in the
expres-sion of the results. Nevertheless, it must be borne in mind that
the use of fold increases may prove to be deceptive, because it
is not the same to duplicate from low values or high values
(27). Thus, for correct response evaluation, we believe that it
would be useful to use a yardstick not influenced by
preimmu-nization titers. In this respect, we propose the use of the lower
limit of the 90% probability interval of postimmunization
ti-ters; i.e., if our population represents the general population, a
normal subject has a 95% probability of presenting a
postim-munization titer above this value. We have termed this value
the minimum significant increase (MSI) and define a
re-sponder as an individual who suffers an increase greater than
this value (final value
2
initial value
.
MSI). The MSI
ob-tained for total IgG was 395 arbitrary units/ml, that for IgG1
was 0.350
A
450units, and that for IgG2 was 0.314
A
450units.
With respect to the specific IgG isotype response, it has
classically been accepted that the response of antibodies to
protein antigens is predominantly of the IgG1 and IgG3 types,
whereas the response to polysaccharide antigens in adults is
mainly of the IgG2 type (3, 24). In our study, we found that
67.5% (27 of 40) of individuals responded with a significant
increase in IgG1. Of these, four responded only with this
sub-class. In contrast, the greatest increases were observed for
IgG2, and the number of responders was slightly higher, 72.5%
(29 of 40), although none responded with IgG2 alone. These
results are similar to those obtained in other studies, which
show a mixed response of IgG1 and IgG2 (5, 17, 20). It must be
emphasized that in our population four of the nonresponders
with total IgG responded with some of the subclasses, which
would justify study of the same subclasses.
We believe that establishment of defined criteria for the
specific total IgG, IgG1, and IgG2 response to pneumococci is
a step forward in research on the efficacy of the vaccine in risk
groups and will permit in-depth studies of the immunological
response in patients with known humoral immunodeficiencies
or suspected selective response deficiencies to polysaccharide
antigens.
FIG. 4. Distribution of the specific antibody response againstS. pneumoniae.
TABLE 1. Titers of specific anti-S. pneumoniae
IgG, IgG1, and IgG2 before and after vaccination
Immunoglobulin Mean value (95% CI)
a
Fold increase Prevaccination Postvaccination Increase
Total IgG
b508 (407–645)
1,686 (1,274–2,230)
1,767 (539–2,995)
4.27 (2.18–6.35)
IgG1
c0.350 (0.287–0.428)
0.880 (0.735–1.053)
0.596 (0.373–0.819)
3.08 (1.85–4.31)
IgG2
c0.350 (0.296–0.416)
0.944 (0.765–1.164)
0.747 (0.464–1.031)
3.82 (2.03–5.60)
aData are means for 40 subjects.
bValues for IgG are in arbitrary units per milliliter. cValues for IgG1 and IgG2 areA
450units.
on August 17, 2020 by guest
http://cvi.asm.org/
ACKNOWLEDGMENT
This study was supported in part by a grant from Fondo de
Inves-tigaciones de la Seguridad Social (FISS 93/0482).
REFERENCES
1.Ambrosino, D. M., G. R. Siber, B. A. Chilmonczik, J. B. Jernberg, and R. W. Finberg.1987. An immunodeficiency characterized by impaired antibody responses to polysaccharides. N. Engl. J. Med.316:790–793.
2.Barra, A., D. Schulz, P. Aucouturier, and J. L. Preud’homme.1988. Mea-surement of anti-Haemophilus influenzae type b capsular polysaccharide antibodies by ELISA. J. Immunol. Methods115:111–116.
3.Barret, D. J., and E. M. Ayoub.1986. IgG2 subclass restriction of antibody to pneumococcal polysaccharides. Clin. Exp. Immunol.63:127–134. 4.Cryz, S. J., E. Fu¨rer, T. Fredeking, A. S. Cross, J. C. Sadoff, and J. U. Que.
1989. Effect of race and blood group on the immune response to bacterial polysaccharide and conjugated vaccines. Lancetx:1533–1534.
5.Cudwin, D. S., S. G. Artrip, and G. Schiffman.1987. Immunoglobulin G class and subclass antibodies to pneumococcal capsular polysaccharides. Clin. Immunol. Immunopathol.44:114–121.
6.Cunningham-Rundles, C.1989. Clinical and immunologic analyses of 103 patients with common variable immunodeficiency. J. Clin. Immunol.9:22– 33.
7.De Gracia, J., M. Miravitlles, M. Vendrell, M. J. Rodrigo, R. Codina, and F. Morell.1995. Estudio de las subclases de la IgG en pacientes con de´ficit de IgA sintoma´ticos. Med. Clin. (Barcelona)104:728–731.
8.De Gracia, J., M. J. Rodrigo, F. Morell, M. Vendrell, M. Miravitlles, M. J. Cruz, R. Codina, and J. M. Bofill.1996. IgG subclass deficiencies associated with bronchiectasis. Am. J. Respir. Crit. Care Med.153:650–655. 9.De Velasco, A., B. A. Dekker, A. F. Verheul, R. G. Feldman, J. Verhoef, and
H. Snippe.1995. Antipolysaccharide immunoglobulin isotype levels and op-sonic activity of antisera: relationships with protection against Streptococcus pneumoniae infection in mice. J. Infect. Dis.172:562–565.
10. Frasch, C., D. Goldblatt, and G. Carlone (ed.).1996. Summary of the proceedings of the WHO Workshop on Pneumococcal ELISA Standardiza-tion. Centers for Disease Control and Prevention, Atlanta, Ga.
11. Kroon, F. P., J. T. Van Dissel, J. C. de Jong, and R. van Furth.1994. Antibody response to influenza, tetanus and pneumococcal vaccines in HIV-seropositive individuals in relation to the number of CD41lymphocytes. AIDS8:469–476.
12. Landesman, S. H., and G. Schiffman.1981. Assessment of the antibody response to pneumococcal vaccine in high-risk populations. Rev. Infect. Dis.
3(Suppl.):S184–S196.
13. Leibl, H., W. Erber, M. Eibl, and J. Mannhalter.1993. Separation of poly-saccharide-specific human immunoglobulin G subclasses using a protein A-Sepharose column with a pH gradient elution system. J. Chromatogr.
639:51–56.
14. Mascart-Lemone, F., M. Ge´rard, M. Libin, A. Crusiaux, P. Franchioly, A. Lambrechts, et al.1995. Differential effect of human immunodeficiency virus infection on the IgA and IgG antibody responses to pneumococcal vaccine. J. Infect. Dis.172:1253–1260.
15. Metzger, W. J., J. E. Butler, D. Swanson, E. Reinders, and H. B. Richardson.
1981. Amplification of the enzyme-linked immunosorbent assay for measur-ing allergen-specific IgE and IgG antibody. Clin. Allergy11:523–531. 16. Musher, D., M. J. Luchi, D. Watson, R. Hamilton, and R. Baughn.1990.
Pneumococcal polysaccharide vaccine in young adults and older bronchitics: determination of IgG responses by ELISA and the effect of adsorption of serum with non-type-specific cell wall polysaccharide. J. Infect. Dis.161:728– 735.
17. Oldfield, S., S. Jenkins, H. Yeoman, D. Gray, and I. C. M. Maclennan.1985. Class and subclass antipneumococcal antibody responses in splenectomized patients. Clin. Exp. Immunol.61:664–673.
18. Rodrigo, M. J., R. Codina, J. De Gracia, F. Morell, and C. Pascual.1992. Valores normales de las subclases de la inmunoglobulina G en una poblacio´n de adultos. Su importancia en el estudio de los de´ficits de las mismas. Med. Clin. (Barcelona)98:166–170.
19. Rodriguez Barradas, M., D. M. Musher, C. Lahart, C. Lacke, J. Groover, D. Watson, R. Baughn, T. Cate, and G. Crofoot.1992. Antibody to capsular polysaccharides ofStreptococcus pneumoniaeafter vaccination of human immunodeficiency virus-infected subjects with 23-valent pneumococcal vac-cine. J. Infect. Dis.165:553–556.
20. Rynnel-Dago¨o¨, B., A. Freijd, and K. Prellner.1985. Antibody activity of IgG subclasses against pneumococcal polysaccharides after vaccination. Am. J. Otolaryngol.6:275–279.
21. Schaffer, F. M., R. C. Monteiro, J. E. Volanakis, and M. D. Cooper.1991. IgA deficiency. Immunodefic. Rev.3:15–44.
22. Siber, G. R.1994. Pneumococcal disease: prospects for a new generation of vaccines. Science265:1385–1387.
23. Siber, G. R., C. Priehs, and D. W. Madore.1989. Standardization of antibody assays for measuring response to pneumococcal infection and immunization. Pediatr. Infect. Dis. J.8:S84–S91.
24. Siber, G. R., P. H. Schur, A. C. Aisenberg, S. A. Weitzman, and G. Schiffman.
1980. Correlation between serum IgG2 concentrations and the antibody response to bacterial polysaccharide antigens. N. Engl. J. Med.303:178–182. 25. Sneller, M. C., W. Strober, E. Eisenstein, J. S. Jaffe, and C. Cunningham-Rundles.1993. New insights into common variable immunodeficiency. NIH conference. Ann. Intern. Med.118:720–730.
26. Umetsu, D. T., D. M. Ambrosino, I. Quinti, G. R. Siber, and R. S. Geha.
1985. Recurrent sinopulmonary infection and impaired antibody response to bacterial capsular polysaccharide antigen in children with selective IgG-subclass deficiency. N. Engl. J. Med.313:1247–1251.
27. Wasserman, R. L. (ed.).1990. Antibody deficiency: IgG subclass deficiency and vaccine nonresponder states. Pediatr. Infect. Dis.9:424–433. 28. Weiss, P. J., M. R. Wallace, E. C. Oldfield III, J. O’Brien, and E. N. Janoff.
1995. Response of recent human immunodeficiency virus seroconverters to the pneumococcal polysaccharide vaccine and Haemophilus influenzae type b conjugate vaccine. J. Infect. Dis.171:1217–1222.
29. Wong, W. Y., G. D. Overturf, and D. R. Powars.1992. Infection caused by Streptococcus pneumoniae in children with sickle cell disease: epidemiology, immunologic mechanism, prophylaxis and vaccination. Clin. Infect. Dis.14:
124–136.
30. World Health Organization.1995. Primary immunodeficiency diseases. Re-port of a WHO Scientific Group. Clin. Exp. Immunol.99:S2–S24.