Konkoly Observatory Budapest
8 March 2012
HU ISSN 0374 – 0676
V881 PERSEI – A SPOTTED, DETACHED ECLIPSING BINARY
NELSON, ROBERT H.1,2
1
1393 Garvin Street, Prince George, BC, Canada, V2M 3Z1 email: [email protected] [remove dashes]
2
Guest investigator, Dominion Astrophysical Observatory, Herzberg Institute of Astrophysics, National Research Council of Canada
The optical variability of V881 Per [= GSC 2846-0404 = 1RXS J025952.4+380149, RA = 02h
59m 53s.
12, Dec = +38◦01′48′′.3 (J2000)] was discovered as a by-product of the first Robotic Transient Search Experiment (ROTSE-1). The results were released in the Northern Sky Variability Survey (Wozniak, et al., 2004, available from SkyDOT – see reference below). The star was previously identified as a possible optical counterpart to an x-ray source (Li and Hu, 1998) but there seems to be no confirmation of that association since then. Follow-up observations of some 131 eclipsing systems – including V881 Per – by Otero et al. (2004) yielded improved light elements (HJD0, Period) and V881 Per was designated as EW/KW. The system was then re-discovered as variable by Norton et al. (2007) from their SuperWASP photometric survey; they seem to have been unaware of the earlier discovery. They did, however, list the system as Pre-Main Sequence (PMS) and gave its V magnitude as 11.09.
Since the initial epoch, in 1999, by Otero et al. (2004), six times of minima have been determined by the author (4 have been previously published [Nelson, 2011a] and 2 are newly-reported here in Table 1).
Table 1: Newly determined times of minima for V881 Per HJD−2400000 Error (days) Type Filter
55835.8376 0.0003 I R 55848.8141 0.0002 II R
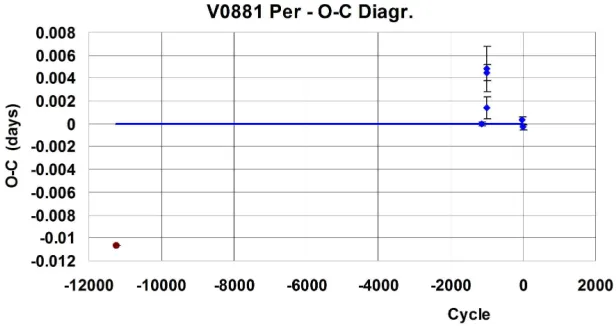
The data are insufficient to conclude anything about possible period variation but do serve to refine the period (see Figure 1). The following elements were used:
JDhelM inI = 2455848.6207 + 0.3873768(4)E
See Nelson (2011b – updated annually) for the latest data and O −C fit. Since the system has never had a full analysis, it was added to the author’s observing programme.
Figure 1. O−C plot for V881 Per
Table 2: Details of variable, comparison and check stars. Type GSC R.A. Dec. V (Tycho) B−V of target 2846- J2000 J2000 Mags Mags Variable 0404 2h
59m
53s.
049 38◦01′48′′.57 10.69 1.398 Comparison 1254 2h
59m
46s.
874 38◦00′48′′.67 11.03 — Check 0138 2h
59m
54s.
067 37◦56′42′′.32 11.33 —
Standard reductions were then applied. The comparison and check stars are listed in Table 2 (coordinates andV magnitudes are from the GSC catalogue, whereas the B−V
colour index is computed from the V −R colour index taken from Norton et al., (2007) by the relation (B−V) = 1.97(V −R) − 0.08 due to Skiff (1998).
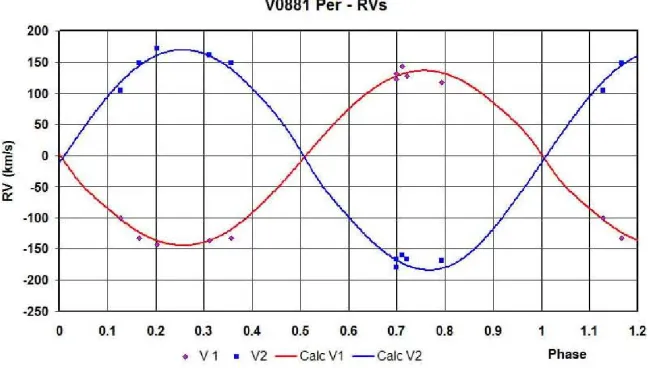
In September and October of 2010 the author took 10 medium resolution spectra at the Dominion Astrophysical Observatory (DAO) in Victoria, British Columbia, Canada using the Cassegrain spectrograph at the Plaskett 1.82 m telescope. The grating (#21181) was 1800 lines/mm, blazed at 5000 ˚A and used in first order, reciprocal linear dispersion = 10 ˚A/mm, resolving power = 10000. The camera was the SITe-2. The spectral range covered was from 5000 to 5260 ˚A, approximately.
The author then used the Rucinski broadening functions (Rucinski, 2004) to obtain radial velocity (RV) curves (see Nelson et al. (2006) and Nelson (2010b) for details). A log of DAO observations and RV results is presented in Table 3. The results were corrected 7.5% up in this case to allow for the small phase smearing in the following way: the RVs were divided by the factor f = sinX
X (where X =
2πt
P and t=exposure time, P=period).
For spherical stars, the correction is exact; in other cases, it can be shown to be close enough for any deviations to fall below observational errors. This matter will be fully explored in a forthcoming paper.)
Table 3: Log of DAO observations
DAO Mid Time Exposure Phase at V1 V2
Image # (HJD−2400000) (sec) Mid-exp (km/s) (km/s) 17229 55466.9424 3600 0.702 143.6 −159.8 17252 55468.8752 3600 0.691 122.3 −178.8 17267 55469.0408 3600 0.118 −100.3 104.1 17283 55469.8306 3600 0.157 −132.1 148.1 17289 55469.9044 3600 0.347 −132.1 148.1 17318 55470.8482 3600 0.784 117.8 169.2 17330 55471.0065 3600 0.192 −142.7 171.4 17332 55471.0491 3600 0.302 −136.2 161.1 17371 55473.9191 1004 0.711 127.8 −166.6 17482−4 55475.8480 3102 0.690 131.7 −166.5
Table 4: Limb darkening values from Van Hamme (1993)
Band x1 x2 y1 y2
Bol 0.646 0.628 0.170 0.151 V 0.794 0.797 0.140 0.016 Rc 0.729 0.753 0.187 0.104 Ic 0.642 0.667 0.1995 0.151
gave the Van Hamme (1993) limb darkening values; and finally, a logarithmic (LD=2) law for the extinction coefficients was selected, appropriate for temperatures < 8500 K (ibid.). (The stated error in T1 corresponds to one half spectral sub-class.)
Mindful of the EW/KW designation (Otero, et al., 2004), the author started with mode 3 (overcontact). No fit was possible until he shifted to mode 5 (semi-detached – Algol) and mode 2 (detached). However, since an Algol system (containing as it does an evolved component) is unlikely to exist in the midst of a star-forming region, mode 2 was adopted. In any case, the latter gave better results.
Convergence by the method of multiple subsets was reached in a small number of iterations. Convective envelopes for both stars were used, appropriate for cooler stars (hence values gravity exponent, g = 0.32 and albedo, A = 0.500 were used for each). The limb darkening coefficients are listed in Table 4.
Early on, it was noted that the maxima between eclipses were unequal. This is the O’Connell effect (Davidge and Milone, 1984, and references therein) and is usually ex-plained by the presence of one or more starspots. Accordingly, one was added first to star 1, but this gave a poor fit. Moving the spot to star 2 eventually gave a good agreement, calculated with observed.
The model is presented in Table 5. (Note that the uncertainty in temperature T1 corresponds to one half a spectral sub-class, as noted before; this error in T1 – when added statistically to the WD stated error inT2 – yields a combined error of 65 K for T2. In view of the uncertainty in spectra class, these errors are likely underestimated.) The light curve data and the fitted curves are depicted in Figure 2.
The presence of third light was tested for, but found not to be significant.
Table 5: Wilson-Devinney parameters
WD Quantity Value error Unit W-D Quantity. Value error Unit TemperatureT1 5150 60 K Potential Ω1 3.675 0.017 —
TemperatureT2 4576 65 K Potential Ω2 3.412 0.019 — L1/(L1+L2) (V) 0.6824 0.003 — q=M2/M1 0.7928 0.0073 — L1/(L1+L2) (RC) 0.6513 0.003 — Inclination, i 61.96 0.23 deg
L1/(L1+L2) (IC) 0.6298 0.003 — r1(pole) 0.3419 0.0021 orb. rad.
Semi-maj. axis a 2.793 0.017 Sol. rad. r1 (point) 0.3936 0.0054 orb. rad Vγ −4.0 0.75 km/s r1(side) 0.3353 0.0025 orb. rad
Spot co-latitude 90 [fixed] deg r1 (back) 0.3736 0.0033 orb. rad
Spot longitude 294 5 deg r2(pole) 0.3359 0.0008 orb. rad
Spot radius 33.5 0.5 deg r2 (point) 0.4444 0.0027 orb. rad
Spot temp factor 0.8985 0.0077 — r2(side) 0.3517 0.0008 orb. rad
Phase shift 0.0063 0.0005 — r2 (back) 0.3828 0.0008 orb. rad
Σω2
[image:4.595.122.475.310.492.2]res 0.00616 — —
Figure 2. V881 Per: V,RC, andIC Light Curves – Data and WD Fit
[image:4.595.137.461.553.737.2]Figure 4. Binary Maker 3 representation of the system – at phases 0.75 and 0.97.
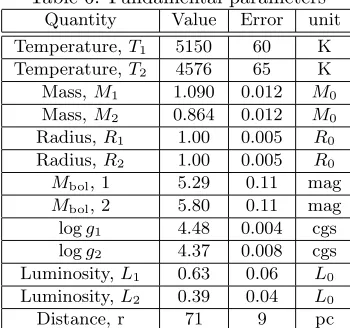
Table 6: Fundamental parameters Quantity Value Error unit Temperature,T1 5150 60 K
Temperature,T2 4576 65 K
Mass,M1 1.090 0.012 M0
Mass,M2 0.864 0.012 M0
Radius,R1 1.00 0.005 R0
Radius,R2 1.00 0.005 R0 Mbol, 1 5.29 0.11 mag Mbol, 2 5.80 0.11 mag
logg1 4.48 0.004 cgs
logg2 4.37 0.008 cgs
Luminosity,L1 0.63 0.06 L0
Luminosity,L2 0.39 0.04 L0
Distance, r 71 9 pc
The WD output fundamental parameters and errors are listed in Table 6. Most of the errors are output or derived estimates from the WD routines. In estimating the distance, galactic extinction was allowed for using the formula A= 3E(B−V) =R[(B−V)data− (B−V)tables].
In conclusion, the fundamental parameters of this system have been determined. As to the suggestion that V881 Per might be a weak-lined T Tauri star (WTTS), there is little in the way of observables in this study that would either support or rule out the possibility (see Basri 2009, for a discussion of WTTS observable characteristics). The only things in favour would be the starspot, the late spectral type and the slight over-luminosity. Against that is the fact that erratic variations in brightness were not observed. Also, lithium (or any other) emission lines were not observed in the spectral range observed, although emission lines are more a characteristic of classical T Tauri behaviour and – while commonly seen for these stars – are not essential for the identification of the type.
Acknowledgements:
[image:5.595.210.385.328.492.2]Basri, G., 2000, “T Tauri Stars’ in Cox Allen’s Astrophysical Quantities”, 4th ed., page 408
Bradstreet, D.H., 1993, “Binary Maker 2.0 - An Interactive Graphical Tool for Preliminary Light Curve Analysis”, in Milone, E.F. (ed.) Light Curve Modelling of Eclipsing Binary Stars, pp 151-166 (Springer, New York)
Cox, A.N., ed, 2000, Allen’s Astrophysical Quantities, 4th ed., (Springer-Verlag, New York, NY).
Davidge, T.J., and Milone, E.F., 1984, ApJS 55, 571
Kallrath, J., Milone, E.F., Terrell, D., and Young, A.T., 1998,Astrophys. J. 508, 308 Li, J.Z. and Hu, J.Y., 1998,A&AS 132, 173
Nelson, R.H., 2004,IBVS 5493
Nelson, R.H., 2010a, Software, by Bob Nelson, http://members.shaw.ca/bob.nelson/software1.htm Nelson, R.H., 2010b, “Spectroscopy for Eclipsing Binary Analysis” in The Alt-Az
Initia-tive, Telescope Mirror & Instrument Developments (Collins Foundation Press, Santa Margarita, CA), R.M. Genet, J.M. Johnson and V. Wallen (eds)
Nelson, R.H., 2011a,IBVS 5466
Nelson, R.H., 2011b, Bob Nelson’s O-C Files, http://www.aavso.org/bob-nelsons-o-c-files Nelson, R.H., Terrell, D., and Gross, J., 2006,IBVS 5715
Norton, A.J., et al. (21 authors in all), 2007,Astron. Astrophys. 467, 785 Otero, S.A., Wils, P., and Dubovsky, P. A., 2004,IBVS 5570
Rucinski, S. M. 2004, IAU Symp., 215, 17
Skiff, B., 1998, VSNET Discussion Group post (1998 Oct 29)
SkyDOT (Sky Database for Objects in Time Domain), http://skydot.lanl.gov/nsvs/nsvs.php Terrell, D., 1994, Van Hamme Limb Darkening Tables, vers. 1.1.
Van Hamme, W., 1993,Astron. J. 106, 2096
Wilson, R.E., and Devinney, E.J., 1971, Astrophys. J. 166, 605 Wilson, R.E., 1990, Astrophys. J. 356, 613