N A N O E X P R E S S
Open Access
Pullulan-Based Nanoparticle-HSA Complex
Formation and Drug Release Influenced by
Surface Charge
Liming Yuan
2†, Yiting Cao
2†, Qian Luo
2, Wenyu Yang
2, Xiaofeng Wu
2, Xiaoping Yang
2, Di Wu
2, Siyuan Tan
2,
Ge Qin
2, Jia Zhou
2, Yue Zeng
2, Xinghua Chen
2, Xiaojun Tao
1,2*and Qiufang Zhang
1*Abstract
The nanomaterial composition of nanoparticles and their protein adsorption in the blood is of great significance in the design of drug-loaded nanoparticles. To explore the interaction between the different surface components of nanoparticles (NPs) and protein, we synthesized three kinds of pullulan NP polymers: cholesteric hydrophobically (CH) modified pullulan (CHP), CH-modified animated pullulan (CHAP), and CH-modified carboxylated pullulan (CHSP). Pullulan NPs were prepared by the dialysis method. Dynamic light scattering was used to determine the charge and size of the three NPs. The size of NPs was altered by the number of charge groups when polymers contain the same degree of cholesterol substitution. The zeta potentials were + 12.9,−15.4, and−0.698 mV for CHAP, CHSP, and CHP, respectively, and the dimensions were 116.9, 156.9, and 73.1 nm, respectively. Isothermal titration calorimetry was used to determine the thermodynamic changes of NPs with different surface charge, and the effect of human serum albumin (HSA) on the titration was investigated. The changes of enthalpy and entropy demonstrated an interaction between NPs and HSA; the binding constant (Kb) for CHSP, CHP, and CHAP was 1.41, 27.7, and 412 × 104M−1, respectively, with the
positive charge for CHAP–HSA, uncharged for CHP–HSA, and negative charge for CHSP–HSA complex. Fluorescence and circular dichroism spectroscopy were used to determine the protein structure change after the complexation between NPs and HSA. The NP and HSA complexation is a complicated process composed of proteinα-helical content reduction and the peptide chain extension; CHP NPs had the largest reduction in HSAα-helical content. The drug release rates of all compounds of NP and HSA were significantly lower than those of free drug and drug-loaded NPs after 48 h. The highest and lowest rates were observed in CHSP–HSA and CHP–HSA, respectively. The drug release was significantly influenced by the adsorption of HSA on NPs, and the size and surface charge of NPs played an important role in this process.
Keywords:Nanoparticles, Human serum albumin, Drug release,α-Helix, Binding constant
Background
Nano-drug delivery system, such as nanoparticles (NPs) loaded with small molecular antitumor drugs, has sustained and controlled drug release properties as well as targeting effect. Targeted therapy with NPs has become a focus in treating tumors, because they can significantly reduce the side effects of drugs and improve drug efficacy [1–3].
Drug-loaded NPs need to pass through three paths to reach the target site, i.e., blood circulation, tissue to cell
pathway, and intracellular movement [4–6]. They also need to overcome the vascular barrier to reach the tar-geted tissue, then the cell membrane barrier to reach targeted cell [7, 8]. Protein adsorption and exchange are involved in all NPs’ pathways. Finally, protein-adsorbed NPs reach the target cells and release the drugs [1,9].
The high-abundance proteins such as human serum albumin (HSA), lipoproteins, and globulin are usually adsorbed on the surface of drug-loaded NPs, thus chan-ging the in vivo release behavior and targeting sites of NPs [10]. The number and type of adsorbed proteins are closely related to the concentration of proteins in plasma and the affinity of NPs [11]. The greater the plasma protein concentration, the greater the surface
* Correspondence:[email protected];[email protected] †Liming Yuan and Yiting Cao contributed equally to this work.
1Department of Pharmacology, Hubei University of Medicine, Shiyan 442000,
Hubei, China
Full list of author information is available at the end of the article
© The Author(s). 2018Open AccessThis article is distributed under the terms of the Creative Commons Attribution 4.0 International License (http://creativecommons.org/licenses/by/4.0/), which permits unrestricted use, distribution, and reproduction in any medium, provided you give appropriate credit to the original author(s) and the source, provide a link to the Creative Commons license, and indicate if changes were made.
Yuanet al. Nanoscale Research Letters (2018) 13:317
adsorption of the NP [12]. A protein with high affin-ity can replace the one with weak affinaffin-ity [13]. There-fore, the surface of the NP is occupied by the protein with high concentration and strong affinity, forming a nano-protein crown [14]. Nano-protein crowns are in-dispensable for the in vivo function of NPs [15]. For example, if the surface is modified with polysorbate, NPs can deliver the drug through the blood–brain barrier to brain tissue [16]; hydrophobic-modified polysaccharide nanomaterials can interact with HSA in the body, thereby enhancing the control of drug release [17].
The uptake of NPs by cells is affected by a variety of factors such as the physical and chemical properties of NPs, nano-drug concentration, protein adsorption, and cell adhesion [18]. The types and quantities of protein adsorption affect the function of NPs, includ-ing drug release control and targetinclud-ing. As well, the physical and chemical properties of NPs, such as par-ticle size, charge, and surface hydrophobicity, affect the adsorption of protein [19]. The nature of the NP decides its fate during the in vivo process [20]. Amphiphilic macromolecular materials such as hydro-phobically modified polysaccharide polymers can be self-assembled into nano-sized particles. The size of the NP plays an important role in its functions of tar-geting and drug release control [21]. The hydrophobic group in the polymer is a driving force for the forma-tion of the nuclear structure of the NP. The greater the degree of substitution of the hydrophobic group, the smaller the NP [22]. Polymer materials with carb-oxyl groups, amino groups, and their derivatives are involved in NP self-assembly, so they affect the size of NPs and provide surface charge for easily attaching to the protein with opposite charge [23]. NPs with differ-ent surface charges have differdiffer-ent ability for protein adsorption and different biological functions [24]. Therefore, we need to explore the interaction between the different surface components of NPs and protein.
HSA is the most abundant protein in the blood. It is essential for the transport, distribution, and metabolism of foreign and endogenous substances. Many small-molecule drugs enter the body and form HSA–drug adsorbents in blood transport, which changes the pharmacological effects of drugs [25]. Drug-loaded NPs are combined with HSA after entering the body; because of the complex structure of NPs, the characteristics of adsorption differ from small-molecule HSA combinations [26]. For instance, adsorption of small-molecule drugs to HSA mole-cules is rapid; however, HSA adsorption to NPs is slow and complex [27].
CHP nanoparticles as a drug carrier had been studied for a long time, which had showed excellent
nanomaterials for drug delivery [28, 29]. In a previous experiment, we studied the interaction between HSA and pullulan NPs with different degrees of cholesterol substitution, cholesteric hydrophobically (CH) modified pullulan (CHP), and found mainly two processes: HSA rapidly attached to the NP surface and then slowly inserted into the hydrophobic core of NPs [30]. Hydro-phobic interactions played a major role in the formation of CHP–HSA complexes [31]. The hydrophobicity and shell–core structure of the particles were mainly respon-sible for the changes in albumin conformation during the NP and HSA interaction [30].
In this study, we manufactured three NPs, CHP, CH-modified animated pullulan (CHAP), and CH-CH-modified carboxylated pullulan (CHSP). Their structure and prop-erties were characterized with Fourier-transform infrared (FTIR) and NMR, and their sizes and potentials were de-termined by dynamic light scattering (DLS). Isothermal titration calorimetry (ITC) and fluorescence spectros-copy were used to investigate interaction characteristics of the NP–HSA complexes and the effects of the three kinds of NPs on HSA structure. We reveal the effects on drug release with the properties of the NP–HSA com-plexes, which is vital for the future application of drug delivery system.
Methods
Materials
HSA was purchased from Sigma Aldrich (St. Louis, MO, USA).N,N-Imidazole was from Shanghai stock solution biotechnology (Shanghai). Ethylenediamine, succinic an-hydride was provided by Tianjin Star Chemical Reagent (Tianjin). All other chemical reagents were of analytical grade and were from Changsha Huicheng Co. (Chang-sha, China).
Synthesis of CHP, CHSP, and CHAP Synthesis of CHP
tetrahydrofuran then dried in a blast dryer at 50 °C to become a white solid (Fig.1).
Synthesis of CHAP
An amount of 1.80 g CHP and 1.00 gN,N-diimidazole were dissolved in 100 mL DMSO. After heating and stirring in a 50 °C oil bath for 4 h, 3.60 g ethylenedi-amine was added followed by further heating and stirring for 24 h. When the reaction liquid cooled to room temperature, it was dialyzed in a 4000-interception dialysis bag with double distilled water for 1 day then lyophilized to obtain a light-yellow solid that was the product of hydrophobically modified animated pullulan.
Synthesis of CHSP
An amount of 1.80 g CHP was dissolved in 100 mL dehydrated DMSO, then 0.5 g succinic anhydride and 0.05 g 4-dimethylaminopyridine (DMAP) were dissolved in 10 mL DMSO activated for 1 h; after heating and stirring in a 50 °C oil bath for 20 h, the reaction was stopped. When the reaction liquid cooled to room temperature, it was placed in an ap-propriate amount of anhydrous ethanol and stirred to precipitate a white solid. The white solid was washed several times with an appropriate amount of
anhydrous ethanol, diethyl ether, and tetrahydrofuran and dried in a blast dryer at 50 °C. The obtained product was hydrophobically modified carboxylated pullulan polysaccharide.
FTIR and NMR Spectroscopy
The FTIR spectra for CHP, CHSP, and CHAP were ob-tained as KBr pellets for FTIR spectroscopy (Nicolet NEXUS 470-ESP, Thermo Fisher Scientific, Waltham, MA, USA). The chemical structures of CHP, CHSP, and CHAP were confirmed by 500 MHz 1H-NMR, with DMSO-d6 as the solvent. The degree of substitution of cholesterol in CHP polymers was determined by the alpha-1,4 and alpha-1,6 glycosidic bond and methylene peak area.
Preparation and Characterization of NPs
CHP, CHSP, and CHAP NPs were prepared by the dia-lysis method [33]. Briefly, CHP, CHSP, and CHAP were dissolved in 10 mL DMSO. To form NPs, the mixture solution was injected in a dialysis bag for 24 h to elim-inate the DMSO. The solution of CHP, CHSP, and CHAP NPs was screened with a membrane filter (pore size 0.45 m, Millipore, Boston, MA, USA) to remove the larger aggregated CHP, CHSP, and CHAP NPs. The size distribution and zeta potential of the obtained
Fig. 1Synthesis of CHP, CHSP, and CHAP polymers
[image:3.595.58.540.88.378.2]particles were determined by DLS (Zetasizer 3000 HS, Malvern Instruments, Malvern, UK) at 11.4 V/cm, 13.0 mA.
ITC
A certain concentration of HSA solution was dripped onto the CHP, CHSP, and CHAP NP solutions, and the change in heat was measured by ITC (VP-ITC, Microcal, Northampton, MA, USA). An amount of 0.9 mM HSA was injected into 0.01 mM CHP, CHSP, and CHAP NP titration cells, for titrating 20 times. The first drop was 2 μL, and the reaction time was 180 s; the remaining drops were 10 μL per drop and the reaction time was 210 s, and the temperature was set at 25 °C. The thermodynamic parameters and connection curves were obtained with 28 times of titration.
Fluorescence Spectroscopy
HSA and CHP NPs were mixed at a molecule ratio of HSA to CHP of 3.6:1 to prepare CHP–HSA, CHSP– HSA, and CHAP–HSA mixtures. The obtained mixtures were placed in 2-mL EP tubes and shaken at 20 rpm at 25 °C for 24 h. Fluorescence spectra and fluorescence in-tensity (FI) of free HSA and the NP-bound HSA were recorded by fluorescence spectrophotometry (Shimadzu RF-4500, Japan). The tryptophan chromophore in the HSA molecule was excited at 280 nm, and emission spectra were recorded at 290 to 450 nm. Excitation and emission slit widths were 5 and 12 nm.
Seven NP solutions at different concentrations were mixed with HSA solution. The mixed solutions were transferred to 2-mL EP tubes for a 9-h reaction. The obtained samples were collected to measure cence spectra at wavelength 290–450 nm. The fluores-cence spectra of pure HSA solution were used as a reference to determine binding constants according to Stern–Volmer analysis. Fluorescence quenching data were analyzed by using the improved Stern–Volmer equation [34]:
F0=ðF0−FÞ ¼1=faþ1= faKq½ Q
where Kq is the quenching constant of Stern–Volmer,
F0 and F are fluorescence intensities at 342 nm in ab-sence and preab-sence of quencher, and [Q] is the concen-tration of quencher.
Circular Dichroism Analysis
CHP–HSA complexes were prepared through two different ways. The first one (complex I) was pre-pared by simply mixing HSA and CHP solutions. The second one (complex II) was kept in 2-mL EP tubes, which were set in shaking table with 20 rpm for 12 h at 25 °C. Circular dichroism (CD) spectra
for free HSA and NPs added to protein were re-corded at wavelength 200–250 nm by using a CD spectrometer (JASCO J-810, Japan) at 37 °C with a 0.1-cm cuvette cell. The concentration of HSA was 1.0 mg/mL in all samples. The relative α-helix con-tent in HSA was calculated as follows [35]:
θ208
½ ¼ θM 10CLNr
where θ208 is the mean residue ellipticity
(deg cm−2 dmol−1) at 208 nm, θ is the ellipticity, M is molecular weight of HSA,Cis the concentration of HSA (mg/mL), Lis length of the cuvette cell (cm), and Nris
the number of amino acids in the HSA molecule.
Drug Release In Vitro
Mitoxantrone (MTO)-loaded NPs were prepared by a dialysis method [36]. The standard curve for mitoxan-trone was acquired by UV spectrophotometry. Drug loading and encapsulation efficiency were calculated as described [33]. MTO release was studied in vitro by dia-lysis in phosphate buffered saline. Briefly, the solution of MTO-loaded NPs (2 mg/mL) was placed into visking dialysis tubing and dialyzed against the release media at 37 °C in an air-bath shaker at 50 rpm. At predefined times, the release media was collected and the fresh re-lease media was added. The rere-leased amount of MTO was determined by UV spectrophotometry (UV-384 plus, Molecular Devices, USA) at 608 nm. The accumulated release percentage (Q%) was calculated as described pre-viously [37]. A certain amount of HSA solution (0.1 mg/ mL) was added to the dialysis tube to determine the drug release of three types of NPs.
Results
Characterization of CHP, CHSP, and CHAP Polymers FTIR Spectra
Figure 2 shows the FTIR spectra for CHP, CHSP, and CHAP. The data for CHP spectra were 1731 cm−1(–C=O stretching vibration peak) and 1161 cm−1(–C=O stretch-ing vibration peak). This result demonstrates the forma-tion of ester bonds on pullulan, indicating that the CHP had been successfully synthesized.
As compared with CHP spectra, data for CHAP spectra were 1648 cm−1 (–C=O vibration absorption peak), 1734 cm−1(–C=O vibration absorption peak), 1539 cm−1 (–N–H bending vibration peak), and 3742 cm−1 (–NH2 stretching vibration peak). According to these characteristic peaks, there were amide bonds on CHP, and CHAP was successfully synthesized by the esterification reaction.
1560 cm−1(double –C=O coupling vibration peak), and 1421 cm−1(–O–H bending vibration peak). This shows that there were carboxyl groups on CHP and part of them became salts.
1H NMR
Figure 3 shows the 1H NMR spectra for CHP, CHSP, and CHAP. A total of 0 to 2.40 ppm belonged to the hydrogen signal of cholesterol, which demonstrated the successful synthesis of CHP. The characteristic peaks of DMSO-d6 and methylene (–CH2CH2–) showed signals at 2.49 and 2.53 ppm, respectively. As compared with CHP, CHAP showed signals at 8–9 ppm, which belonged
to the amino group and proved that ethylenediamine was grafted onto CHP. The degree of substitution of cholesterol per 100 glucose units in CHP could be calcu-lated by the ratio of methylene protons to sugar proton with the following equation [38]:
DS¼ A∂2:53 4ðA∂4:74þA∂5:01Þ
whereAδ2.53is the spectrum area under the character-istic absorption peak of methylene (hydrogen), and
Aδ4.74 and Aδ5.01 are the spectrum area under the
Fig. 2FTIR spectra of CHP (a), CHAP (b), and CHSP (c)
Fig. 31HNMR spectra for CHP (a), CHSP (b), and CHAP (c) NPs
[image:5.595.59.540.87.273.2] [image:5.595.59.540.470.722.2]characteristic absorption peaks for alpha-1,6 and alpha-1,4 glycosidic bonds, respectively.
From the1H NMR spectra in CHP, the degree of substi-tution of cholesterol succinate (CHS) was 4.50%. For CHSP NPs, the methylene groups (–CH2CH2–) included two as-pects: succinic anhydride and CHS. The degree of substitu-tion was 12.34% for methylene groups (–CH2CH2–) and 7.84% for carboxyl groups. For CHAP NPs, the methylene groups (–CH2CH2–) included two aspects: ethylenediamine and CHS. The degree of substitution was 18.6% for methy-lene groups (–CH2CH2–) and 14.1% for the amino groups.
Properties of CHP, CHSP, and CHAP NPs
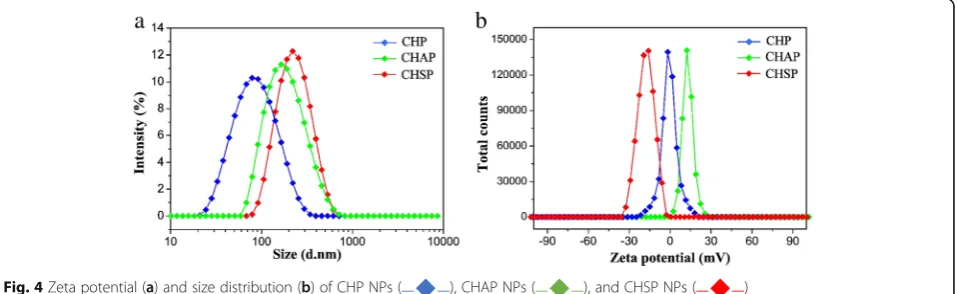
Amphiphilic polymers can be self-assembled by dialysis to form core–shell NPs with a hydrophilic shell and hydrophobic core, which can be loaded with anti-cancer drugs to form drug-loaded NPs. The NP properties such as surface charge and size played a vital influence on the treatment efficacy as a drug carrier [39,40]. The size dis-tribution and zeta potential of CHP, CHSP, and CHAP NPs measured by DLS are presented in Fig.4. The mean size of NPs was 73.1, 116.9, and 156.9 nm for CHP, CHAP, and CHSP, respectively. The zeta potential was− 0.698, + 12.9, and−15.4 mV, respectively (Table1).
For pullulan NPs with the same hydrophobic group, the size was larger for negatively charged CHSP and positively charged CHAP than neutral CHP NPs. Thus, the charged group interferes with the self-assembly behavior of NPs, forming larger sized NPs with a loose structure in aqueous solution. The zeta poten-tials of CHP NPs, CHAP, and CHSP NPs were − 0.698 mV, + 12.9 mV, and −15.4 mV, respectively. Thus, the amino and carboxyl groups in the polymer could create NPs with different surface charges and thus change surface properties.
Thermodynamic Analysis
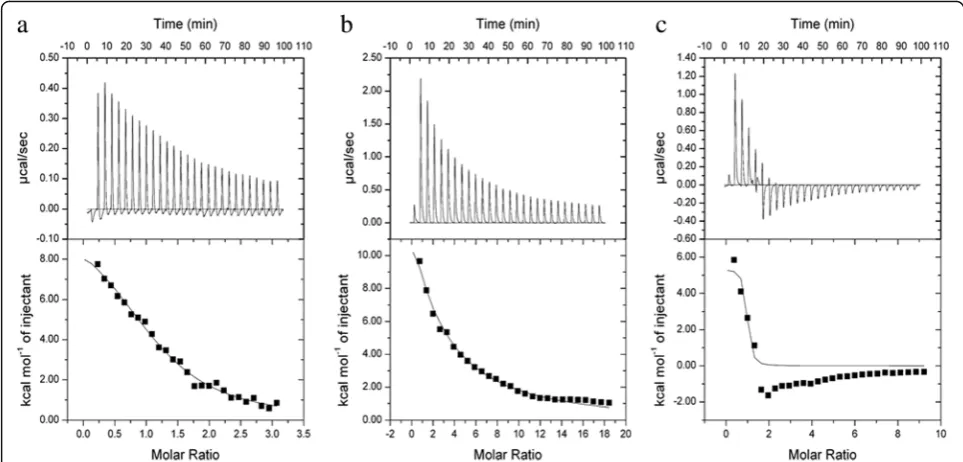
The thermodynamic analysis was performed using ITC with HSA titrating to CHP, CHSP, and CHAP NP solu-tions. As HSA titration to pullulan NP solution with
different charges, we determined the changes of heat, fit-ting out the connection properties of three kinds of materials, connection, and connection number of mole-cules. The original spectrum of the isothermal titration thermometer reflects the change in heat. The upward peak indicates a heat-releasing reaction, and the down-ward peak indicates a heat-absorbing reaction [41, 42]. When CHP, CHAP, and CHSP NPs were titrated with HSA, the released heat from the combination gradually decreased over time (Fig. 5). Overall, 26 drops of HSA solution were titrated into CHP NP solution, and the peaks of the spectrum were upward, indicating the exo-thermic nature of the reaction. The same phenomenon was observed when the HSA solution was titrated into the CHSP NP solution. However, when the HSA solu-tion was titrated into the CHAP NP solusolu-tion, the peaks of the spectrum for the first four drops were upward, while from the fifth drop, the peaks turned to down-ward, indicating an endothermic reaction. The HSA absorption of CHP and CHSP NPs was exothermic, so the reaction was spontaneous. The HSA absorption of CHAP NPs was partially endothermic and partially exothermic, which may be related to the positive charge of CHAP.
The enthalpy value reflects the heat released by the combination of HSA and NPs. The enthalpy changes of CHP, CHSP, and CHAP NPs by HSA were 42.827, 80.3712, and 22.3951 KJ/mol, respectively (Table 2). Combined with the enthalpy change, the exothermic
[image:6.595.305.538.109.165.2]Fig. 4Zeta potential (a) and size distribution (b) of CHP NPs ( ), CHAP NPs ( ), and CHSP NPs ( )
Table 1Zeta potential and size distribution of CHP, CHAP, and CHSP NPs
Sample Da(nm) PIa ZPb(mV)
CHP 73.1 ± 3.6 0.243 ± 0.015 −(0.698 ± 0.14)
CHAP 116.9 ± 2.7 0.297 ± 0.023 + (12.9 ± 0.13)
CHSP 156.9 ± 4.1 0.299 ± 0.074 −(15.4 ± 0.18) PIpolydispersity index
a
Average diameter (mean value ± SD) determined by dynamic laser light-scattering with three times
b
[image:6.595.61.540.578.725.2]reaction, the chemical structure of the amphiphilic NPs, and the negative charge of HSA, the hydrophobic inter-action may mainly drive the HSA interinter-action with CHP and CHSP NPs. Of note, in the HSA titration of CHAP, the heat included a negative value. HSA molecules con-tain a hydrophobic pocket that can be combined with the hydrophobic center of the NP [43], so the interaction triggered by the first four drops of HSA and CHAP are primarily driven by hydrophobic forces. Although HSA is negatively charged and CHAP is positively charged, starting from the fifth drop, there is also a charge force between HSA and CHAP because of the endothermic nature of the reaction.
The value of entropy change can reflect the difficulty of the reaction between HSA and NPs. The entropies of HSA and CHP, CHSP, and CHAP NPs were 0.251, 2.775, and 0.201 KJ/mol K, respectively (Table 2), so CHP and CHAP NPs are more easily to bind to HSA, while CHSP NPs are more difficult to bind to HSA.
The coverage of HSA and CHP, CHSP, and CHAP NPs was 1.17, 0.404, and 0.845, respectively. The concentration of NPs is calculated based on the concentration of the
polymer rather than the number of particles. We do not know how many single polymer particles contain a single NP, so we cannot determine exactly how much of each NP is adsorbed by HSA, but based on the value of cover-age, we can conclude that CHP NPs have the highest ad-sorption of HSA.
In previous experiments, we showed that the affinity value, KA, reflects the strength of the binding force be-tween NPs and HSA [32]. The stronger the hydrophobi-city of CHP NPs, the stronger the affinity [44]. The binding constant of HSA and CHP was 27.7 × 10⁴M−1, that of HSA and CHSP was 1.41 × 10⁴M−1, and that of HSA and CHAP was 412 × 104M−1. So, the combination of HSA and positively charged CHAP was the strongest, followed by neutral-charged CHP and negatively charged CHSP. The strongest combination of HSA and CHAP may be attributed to the hydrophobic force, a mutual at-traction of the charge force and probably a mutually ex-clusive charge between HSA and CHSP.
Fluorescence Spectroscopy
With fluorescence spectra, we studied the interaction between HSA and the three NPs with different surface charges. HSA contains 585 amino acid residues, with only one Trp residue at 214 (Trp214), and its fluores-cence spectrum dominates in the UV region. When other molecules interact with HSA, the fluorescence spectrum of Trp may change, depending on the inter-action between HSA and other molecules. When the three NPs were mixed with HSA, the maximum emis-sion peak of the HSA fluorescence spectrum did not
[image:7.595.56.538.88.319.2]Fig. 5Isothermal titration calorimetry data for HSA titration intoaCHP,bCHSP, andcCHAP NPs at 25 °C. NP concentration in the cell (250μL) was 12μM and the protein concentration in the syringe was 230μM. Upper graphs show raw data, and lower graphs show integrated heats
Table 2Degree of coverage, affinity (KA), and enthalpy and entropy changes for binding with HSA titrated into NP solutions of different surface charge at 25 °C
Sample Coverage KA(104M−1) ΔH (KJ/mol) ΔS (KJ/mol K)
CHP 1.17 ± 0.0831 27.7 ± 3.26 43.827 ± 2.353 0.251
CHSP 0.404 ± 0.0435 1.41 ± 0.199 80.3712 ± 16.84 2.775
CHAP 0.845 ± 0.0922 412 ± 9.16 22.395 ± 3.949 0.201
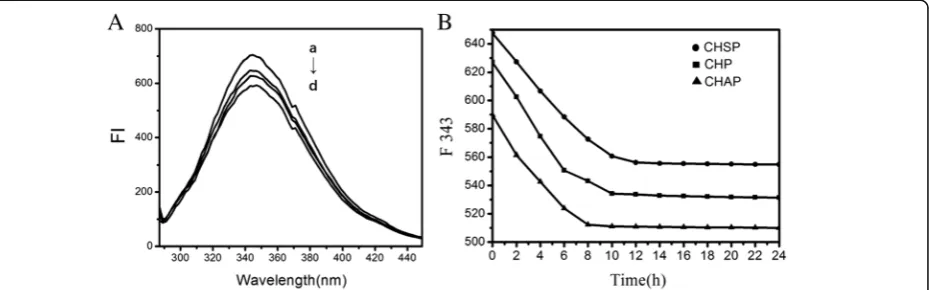
[image:7.595.57.291.676.732.2]undergo a chemical shift; only the intensity was weak-ened to a certain extent (Fig. 6A). The maximum emis-sion peak of HSA was observed when HSA combined with CHAP NPs.
Experimental study showed that combining HSA and pullulan NPs displayed a complexed process [45]. We added the three NPs into HSA solution and found that the fluorescence intensity of the three NP–HSA com-plexes decreased gradually (Fig. 6B). The equilibrium was reached for HSA–CHSP at 556.3 nm after 12 h, for CHP–HSA at 534.3 nm after 10 h, and for CHAP–HSA at 512.3 nm after 8 h. The required time when the fluor-escence intensity of different NP–HSA complexes is bal-anced is related to the charge carried by the NP. The longest time required to reach equilibrium was observed on negatively charged CHSP–HSA, followed by un-charged CHP–HSA.
The rapid reduction in initial fluorescence intensity of the three NP–HSA complexes (shown in Fig.6A) is due to the rapid adsorption of NPs and HSA. The subse-quent fluorescence intensity shows a slow decrease to the constant status because the interaction of NPs with HSA is a slow process of combination. The constant fluorescence intensity reflects the saturation status of the complexation. The interaction between the three different-charged NPs and HSA underwent an early rapid recombination process and a later slow recombin-ation process. The combinrecombin-ation of negatively charged HSA with negatively charged CHSP required a longer time to achieve complex saturation compared with un-charged CHP. Negatively un-charged HSA combining with positively charged CHAP required the shortest time to reach complex saturation.
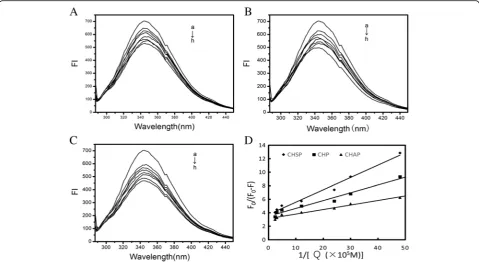
Figure7A–Cshows the spectra of HSA combined with different concentrations of CHSP, CHP, and CHAP NPs to form NP–HSA complexes. With increasing concentration of NPs, the maximum absorption peak of the NP–HSA complex decreased showing a reverse correlation.
The positively charged CHAP-HSA displayed the shortest time to reach equilibrium.
We used a modified Stern–Volmer equation to analyze the fluorescence quenching data:
F0=ðF0−FÞ ¼1=faþ1= faKq½ Q
where fa is the contact fraction of the fluorescent
sub-stance with the quencher, Kq is the Stern–Volmer
quenching constant, F0 is the fluorescence intensity at
342 nm without the quencher, Fis the fluorescence in-tensity at 342 nm with the quencher, and [Q] is the con-centration of quencher.
From the functional image ofF0/(F0−F) pair 1/[Q], we can obtain the values offaandKqfrom the slope and the intercept (Fig. 7D). Assuming that the observed fluores-cence intensity changes mainly due to the interaction be-tween NPs and HSA, the quenching constant can be seen as a binding constant for the formation of complexes. The binding constants for HSA and CHSP, CHP, and CHAP molecules were 2.02, 2.99, 4.72 × 10⁵M−1, respectively. In the previous study, we discussed the interaction between HSA and CHP NPs with different hydrophobicity substi-tutions [30]. The hydrophobic interaction between HSA molecules and CHP cholesterol played an important role in the formation of CHP–HSA. The greater the hydropho-bic substitution of CHP, the greater the binding constant of CHP and HSA.
In the present study, we found that the value of the binding constant (Kb) is related to the electrical proper-ties of the NP. A surface with a positive charge, such as CHAP, has the largest Kb, and a surface without a charge, such as CHP, has the second largest Kb. TheKb for CHSP, with a negative charge, was the lowest. There-fore, in addition to the hydrophobic interaction between NPs and HSA, the electrostatic interaction between them also plays an essential part in the formation of NP–HSA complexes.
[image:8.595.74.539.558.703.2]In addition, the fa values for CHSP, CHP, and CHAP NPs were 0.269, 0.288, 0.38, respectively, so part of the Trp residue was involved in this reaction. Furthermore, the amount of HSA was too much at a given NP/HSA concentration, so free HSA molecules presented in the reaction system.
CD Spectrum Analysis
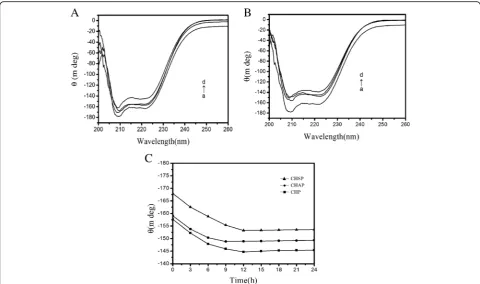
Figure 8A shows the CD spectra (a) free HSA, (b) CHSP–HSA, (c) CHAP–HSA, and (d) CHP–HSA in so-lution at 25 °C. The samples were complex I. There are two negative bands at 208 and 222 nm of the UV region in HSA spectra, which are the characteristic peaks of the α-helical structure. The α-helical content of free HSA was 55%. At the beginning of the complex, with the recombination of HSA and CHSP, CHAP, and CHP NPs, the α-helical content of HSA was reduced to 52.0%, 48.57%, and 48.0%, respectively.
Figure 8C shows that the ellipticity changes of the three samples at 208 nm over time. The ellipticity of HSA combined with CHAP and CHP NPs increased from 0 to 12 h and leveled off at 12 h, but that of HSA with CHSP NPs increased faster, i.e., the ellipticity in-creased from 0 to 9 h and leveled off at 9 h. Therefore, the ellipticity of the three samples gradually increased over time and the α-helical content gradually decreased; when the ellipticity maintained constant, the recombin-ation of the sample and HSA was completed.
Figure8C illustrates that the fastest surface absorption rate was presented on the combination of CHSP and HSA. The size, charge, and hydrophobicity of NPs can influence the migration rate of HSA to the center of NPs. The surface of CHP is not charged, the surface of CHSP is negatively charged, and the surface of CHAP is positively charged. Owing to the presence of the negative-charge mutual exclusion between CHSP and HSA, the resistance of HSA migrating to the CHSP NP center becomes larger. The traction of NPs on HSA is driven by the hydrophobic interaction forces. The trac-tion of the three NPs on HSA is identical, so the lowest velocity of HSA migrating to the center of NPs was ob-served on the combination of HSA and CHSP NPs. Be-cause the particle size is in the order of CHSP > CHAP > CHP, the particle density displays a reverse order, i.e., CHSP < CHAP < CHP. In principle, the speed that HSA migrates toward the NP center is fastest for CHSP NPs and slowest for CHP NPs.
The ITC results show that the amount of HSA migrat-ing toward the center of CHSP NPs is the smallest but with the fastest speed compared with other types of NPs. Table3 shows that theα-helix content of HSA mi-grating toward the center of CHP NPs was the lowest. The more the secondary structure of HSA was damaged, the faster the HSA migrated toward the center. The fast-est speed was observed on HSA migrating to the center of CHSP NPs (Fig.8C).
Fig. 7Fluorescence spectra of HSA (1.5 × 10⁻⁵mol/L) with CHSP (A), CHP (B), and CHAP (C) at different concentrations (a) 0, (b) 2.07 × 10⁻⁷, (c) 3.31 × 10⁻⁷, (d) 4.14 × 10⁻⁷, (e) 8.28 × 10⁻⁷, (f) 20.7 × 10⁻⁷, (g) 33.1 × 10⁻⁷, and (h) 41.4 × 10⁻⁷mol/L.DPlots (n= 7) forF
0/(F0−F) vs 1/[Q],Qis the concentration of CHSP (–◆–), CHP (–■–) and CHAP (–▲–), respectively
[image:9.595.58.538.88.350.2]Figure 8B shows CD spectra for (a) free HSA, (b) CHSP–HSA, (c) CHAP–HSA, and (d) CHP–HSA in solution at 25 °C. The samples were complex II. After the complexation is completed, the α-helical content of HSA recombined with CHSP, CHAP, and CHP was reduced to 46.27%, 44.55%, and 42.91%, respectively (Table 3). With the increase in interaction time, the secondary structure of HSA was changed and theα -he-lical content was reduced during the process of com-plexation with NPs.
Drug Release
We measured the drug release rate of MTO with the three kinds of drug-loaded NPs and drug-loaded NP–HSA complexes. The drug release for free MTO was about 99.8% at 4 h (Fig. 9). The release rate in 48 h for CHP, CHAP, and CHSP NPs was 53.68%, 58.54%, and 63.24%, re-spectively. The drug release from all NPs was fast in the first 8 h, which was a burst release process, and the drug release remained stable after 12 h, which was a sustained
release process. In vitro drug release from NPs is not af-fected by gastrointestinal pH and enzymes, and the dissol-ution of nanomaterials results in little drug release. The release is mainly determined by dissolution and diffusion [46]. The 48-h drug release rate was in the order of CHSP > CHAP > CHP, corresponding to the size of NPs. The fastest release rate was found on CHSP, which was
Fig. 9Mitoxantrone (MTO) release of pullulan NPs in phosphate-buffered saline (PBS) at 37 °C in vitro (□: free mitoxantrone,○: CHP,
[image:10.595.57.538.87.371.2]△: CHAP,▽: CHSP,◁: CHAP–HSA,◇: CHP–HSA,▷: CHSP–HSA) Fig. 8ACD spectra for (a) free HSA, (b) CHSP–HSA, (c) CHAP–HSA, and (d) CHP–HSA in solution at 25 °C. The samples were complex I.BCD spectra for (a) free HSA, (b) CHSP–HSA, (c) CHAP–HSA, and (d) CHP–HSA in solution at 25 °C. The samples were complex II.CEllipticity at 208 nm for HSA interacting with CHSP (–▲–), CHAP (–●–) and CHP (–■–) over time
Table 3Theα-helical contents of three samples
Samples CHP–HSA (%) CHAP–HSA (%) CHSP–HSA (%)
Complex I 48.01 48.57 52.04
[image:10.595.306.539.525.693.2] [image:10.595.57.290.688.731.2]negatively charged with the largest size. The second fast drug release rate was found on which was positively charged with the size smaller than CHSP. CHP was elec-trically neutral, and its drug release rate was minimal. Hence, the polymer surface groups involved in the forma-tion of NPs affect the size of NPs and ultimately the drug release of NPs.
The drug release rate from the combinations of HSA and CHAP, CHP, and CHSP in 48 h was 32.45%, 33.86%, and 35.76%, respectively. After the combination of NPs and HSA, the drug release in 48 h was significantly de-creased as compared with HSA-free NPs, which was mainly attributed to the resistive effect and adsorption effect of HSA. At 48 h, the drug release of the com-pounds was in the order of CHSP–HSA > CHP–HSA > CHAP–HSA, while the drug release of HSA-free NPs was in the order of CHSP > CHAP > CHP. Although NP–HSA compounds showed significantly slow drug re-lease, the total release of CHP-HSA decreased by 21.23% in 48 h, whereas the total release of CHAP-HSA de-creased by 25.68% and that of CHSP-HSA by 28.48%. The drug release of the NPs is related to the size of the NPs and the polymer hydrophobic groups on NP sur-face. The adsorption of HSA can lead to significant slowdown in drug release, which is related to the hydro-phobicity of NPs and also to the surface charge of NPs
[46]. The adsorption of HSA is closely related to the size of the NPs and the degree of substitution of the hydro-phobic groups of the polymer during the self-assembly process. Nevertheless, the drug release of the NPs is ul-timately determined by the properties of the NP itself.
Discussion
As shown in Fig. 10, the formation of the NP–HSA
complex is driven by a hydrophobic force between chol-esterol groups of the particle core and the aromatic amino acid of the hydrophobic domain of HSA. After mixing, HSA interacts with the surface cholesterol unit and is rapidly adsorbed to the NP surface. Then, the adsorbed HSA on the NP surface is processed because of the hydrophobic forces derived from the cholesteric unit in the particle core. When overcoming the steric hindrance of polysaccharide chains in the NP shell, the adsorbed HSA gradually migrates to the core. After the hydrophobic interaction and resistance of the hydrophilic polysaccharide chain are balanced, the HSA molecule enters the particle core to become hydrophobically bound to cholesterol groups to form the NP–HSA complex.
[image:11.595.58.536.411.715.2]For CHAP and CHSP NPs, the recombination of HSA is a complex process also subjected to the charge
Fig. 10Adsorption of HSA to NPs
interaction with HSA under the traction of the hydro-phobic driving force. The binding constants of the three kinds of NPs with the same hydrophobic substitution and different surface charge were in the order of CHAP > CHP > CHSP. The electrical properties also play a major part in the formation of NP–HSA. In this process, the formation of the CHSP–HSA complex was blocked by the structure of the NP shell and the repulsive force between the negative charges, which led to their loose connection. During the rapid adsorption and slow re-combination, the degree of spiraling of HSA is lower for CHSP NPs than CHP NPs and CHAP NPs. There-fore, the surface charge of NPs not only changes the nature of the particles themselves but also affects the protein complex.
In the current study, we investigated the effect of NP surface charge on the interaction between NPs and pro-teins (Fig. 10). Three different charges of pullulan NPs with HSA adsorption still showed rapid adsorption and slow recombination. The number of HSA molecules with positively charged CHAP complex was the most, including rapid adsorption of NP–HSA by hydrophobic forces, HSA molecule migration to the center, and the HSA molecules adsorbed on the surface of NPs by charge action. CHP- and CHSP-adsorbed HSA mole-cules were mainly distributed in the hydrophobic center of NPs, with CHSP adsorbing fewer HSA molecules. The adsorbed number of HSA molecules is related to the hydrophobicity of NPs. The greater the degree of substitution of hydrophobicity, the more HSA is adsorbed [41]. The cholesterol substitutions of the three NPs were the same, and the number of HSA molecules adsorbed by positively charged NPs was the highest, so the adsorption of NPs and HSA was related to the hydrophobicity and surface charge of the NPs.
The surface adsorption capacity between NPs and HSA is also related to the hydrophobicity and charge of NPs. The binding force between HSA and NPs is deter-mined by the hydrophobicity, surface charge, size, and structure of NPs. The α-helicity was decreased most at the beginning of adsorption and the complete CHP– HSA complex. CHP NP has the smallest size and highest density. The CHP NPs migrated toward the center by the hydrophobic traction; the sugar chain of the CHP NP shell was larger to inhibit the migration toward the center. The extension of the peptide chain of HSA is lar-ger, with the α-helix decreased the most. Although CHAP NPs have hydrophobic and charge forces, they possess relatively large size, loose structure, small resist-ance in the periphery, small extension of the peptide chain, and small content of the α-helix. Some HSAs remained on the surface of NPs through the charge force of adsorbing, and the α-helical content is also smaller in this part of the HSA. The α-helix content of CHAP
decreased less than that of CHP, mainly due to the pep-tide chain extension-induced central pulling force which led to α-helix content decline. During the process of the CHSP and HSA complexation, the role of the central pulling force has a reverse direction of the charge force, thereby resulting in weakening the center of the migration force. CHSP NPs are larger than CHAP NPs, and the structure of CHAP NPs is loose. Because the adsorbed number of HSA on CHAP is higher than that on CHSP, the decrease of α-helicity in CHSP is less than that in CHAP NPs. Therefore, the interaction between NPs and HSA and the decrease in
α-helicity are all related to the size, density, hydropho-bicity of substitution, surface charge of the NPs, and number of HSA connections.
After the NPs enter into the blood, protein adsorption affects the functions of NPs, such as the slow and con-trolled drug release, the travel from the blood circulation passing through the vascular barrier, targeting tissue, and entering cells. NPs interact with the HSA in the body and affect the in vivo behavior of NPs. The number of adsorbed proteins is closely related to the properties of the NPs. HSA adsorbs NPs, which affects the distribu-tion in organs and removal of NPs, thereby altering the concentration of the drug in the body and the efficacy of the drug.
Finally, the properties of NPs, such as size, hydropho-bicity, and surface charge, affect the drug release of NPs in vivo. We can design specific materials to perform spe-cific functions with spespe-cific protein adsorption.
Conclusions
In this study, three kinds of nano-drug carriers were constructed, CHP, CHSP, and CHAP. The size, charge, drug loading properties of NPs, interaction between NPs and HSA, and drug release were all closely related to charge amount and charge type of nanomaterials. With the same degree of substitution of hydrophobicity, CHAP NPs with larger amino substitutions were the lar-gest, CHSP NPs the second larlar-gest, and CHP NPs the smallest. The size and surface charge of the NPs were essential to the coverage of HSA, the binding constant, and the slow drug release. The positively charged CHAP binding constant was the strongest, showing the fastest drug release, and CHP NPs had the highest coverage. The combination of HSA further retarded the drug re-lease of NPs. CHAP NPs adsorbed HSA had the slowest drug release rate.
Abbreviations
CH:Cholesteric hydrophobically; CHAP: CH-modified animated pullulan; CHP: Cholesteric hydrophobically (CH) modified pullulan; CHSP: CH-modified carboxylated pullulan; DMSO: Dehydrated dimethyl sulfoxide; HSA: Human serum albumin;Kb: The binding constant; MTO: Mitoxantrone;
Funding
This project was supported by the National Natural Science Foundation of China (No. 81303254, No. 81641140) and Hubei Province Health and Family Planning Scientific Research Project (No. WJ2017M214) to Qiufang Zhang; the Health and Family Planning Commission of Hunan Province Research Project(No.B2017073) to Xiaojun Tao; and the Natural Science Foundation of Hunan Province (No. 2016JJ2088) to Liming Yuan.
Availability of Data and Materials Please contact the author for data requests.
Authors’Contributions
XT and XY conceived the idea. XT, LY, QZ, XW, QL, and YC performed the experiments. XT, WY and XC analyzed the results. XT, DW, ST, GQ, JZ, and YZ wrote the paper. XY and QZ guided and supervised the work. All authors read and approved the final manuscript.
Competing Interests
The authors declare that they have no competing interests.
Publisher’s Note
Springer Nature remains neutral with regard to jurisdictional claims in published maps and institutional affiliations.
Author details
1Department of Pharmacology, Hubei University of Medicine, Shiyan 442000,
Hubei, China.2Key Laboratory of Study and Discovery of Small Targeted Molecules of Hunan Province, School of Medicine, Hunan Normal University, Changsha 410013, China.
Received: 20 July 2018 Accepted: 24 September 2018
References
1. Gong R, Chen G (2016) Preparation and application of functionalized nano drug carriers. Saudi Pharm J Spj Official Publication of the Saudi Pharmaceutical Society 24:254–257
2. Mody VV et al (2014) Magnetic nanoparticle drug delivery systems for targeting tumor. Appl Nanosci 4:385–392
3. Dizaj SM et al (2014) A sight on the current nanoparticle-based gene delivery vectors. Nanoscale Res Lett 9:252–260
4. Wohlfart S et al (2012) Transport of drugs across the blood-brain barrier by nanoparticles. J Control Release 161:264–273
5. Johnsen KB, Moos T (2016) Revisiting nanoparticle technology for blood– brain barrier transport: unfolding at the endothelial gate improves the fate of transferrin receptor-targeted liposomes. J Control Release 222:32–46 6. Qiu B et al (2012) Co-delivery of docetaxel and endostatin by a
biodegradable nanoparticle for the synergistic treatment of cervical cancer. Nanoscale Res Lett 7:666–678
7. Vishwakarma SK et al (2018) Real-time cellular and molecular dynamics of bi-metallic self-therapeutic nanoparticle in cancer cells. Appl Nanosci 2:1–10 8. Immacolata R et al (2014) Diatomite silica nanoparticles for drug delivery.
Nanoscale Res Lett 9:1–7
9. Roy U et al (2015) Preparation and characterization of anti-HIV nanodrug targeted to microfold cell of gut-associated lymphoid tissue. Int J Nanomedicine 10:5819–5835
10. Koo OM et al (2005) Role of nanotechnology in targeted drug delivery and imaging: a concise review. Nanomed Nanotechnol Biol Med 1:193–212 11. Sivaraman B et al (2009) Investigation of the effects of surface chemistry and
solution concentration on the conformation of adsorbed proteins using an improved circular dichroism method. Langmuir Acs J Surf Colloids 25:3050–3056 12. Ding YX et al (2010) Spatial variation of charge and sulfur oxidation state in a surface gradient affects plasma proteins adsorption. Langmuir Acs J Surf Colloids 26:12140–12146
13. Lindman S et al (2007) Systematic investigation of the thermodynamics of hsa adsorption to n-iso-propylacrylamide/n-tert-butylacrylamide copolymer nanoparticles. Effects of particle size and hydrophobicity. Nano Lett 7:914–920
14. Arkan E et al (2014) Multiwall carbon nanotube-ionic liquid electrode modified with gold nanoparticles as a base for preparation of a novel
impedimetric immunosensor for low level detection of human serum albumin in biological fluids. J Pharm Biomed Anal 92:74–81
15. Docter D et al (2015) No king without a crown--impact of the nanomaterial-protein corona on nanobiomedicine. Nanomedicine 10:503–519
16. Kolter M et al (2015) Nanotoxicity of poly(n-butylcyano-acrylate)
nanoparticles at the blood-brain barrier, in human whole blood and in vivo. J Control Release 197:165–179
17. Garro AG et al (2011) Reversible exposure of hydrophobic residues on albumin as a novel strategy for formulation of nanodelivery vehicles for taxanes. Int J Nanomedicine 6:1193–1200
18. Saberi AH et al (2013) Fabrication of vitamin E-enriched nanoemulsions: factors affecting particle size using spontaneous emulsification. J Colloid Interface Sci 391:95–102
19. Lynch I, Dawson KA (2013) Protein-nanoparticle interactions. Nano Today 3:40–47 20. Slepička P et al (2015) Nano-structured and functionalized surfaces for
cytocompatibility improvement and bactericidal action. Biotechnol Adv 33: 1120–1129
21. Cheng M et al (2013) Synthesis of liver-targeting dual-ligand modified gcga/ 5-fu nanoparticles and their characteristics in vitro and in vivo. Int J Nanomedicine 8:4265–4276
22. Malekzad H et al (2017) Plant protein-based hydrophobic fine and ultrafine carrier particles in drug delivery systems. Crit Rev Biotechnol 38(1):47–67 23. Kralj S et al (2011) Controlled surface functionalization of silica-coated
magnetic nanoparticles with terminal amino and carboxyl groups. J Nanopart Res 13:2829–2841
24. Treuel L et al (2014) Impact of protein modification on the protein corona on nanoparticles and nanoparticle-cell interactions. ACS Nano 8:503–513 25. Abouzied OK (2015) Understanding the physical and chemical nature of the
warfarin drug binding site in human serum albumin: experimental and theoretical studies. Curr Pharm Des 21:1800–1816
26. Sonu VK et al (2017) Serum albumin interaction with xanthine drugs at nano-bio interfaces: a combined multi-spectroscopic and molecular modelling approach. J Mol Liq 242:242–252
27. Giri J et al (2011) Interactions of poly(amidoamine) dendrimers with human serum albumin: binding constants and mechanisms. ACS Nano 5:3456–3468 28. Akiyama E et al (2007) Self-assembled nanogels of cholesteryl-modified
polysaccharides: effect of the polysaccharide structure on their association characteristics in the dilute and semidilute regimes. Biomacromolecules 8(8): 2366–2373
29. Shen S et al (2014) The preliminary evaluation on cholesterol-modified pullulan as a drug nanocarrier. Drug Deliv 21(7):501–508
30. Tao X et al (2012) The interaction between human serum albumin and cholesterol-modified pullulan nanoparticle. Curr Nanosci 8:830–837 31. Kumari M et al (2014) Probing HSA-ionic liquid interactions by spectroscopic
and molecular docking methods. J Photochem Photobiol B Biol 138:27–35 32. Tao X et al (2016) Effects of particle hydrophobicity, surface charge,
media ph value and complexation with human serum albumin on drug release behavior of mitoxantrone-loaded pullulan nanoparticles. Nanomaterials 6:2–16
33. Tao X et al (2016) Cholesterol-modified amino-pullulan nanoparticles as a drug carrier: comparative study of cholesterol-modified carboxyethyl pullulan and pullulan nanoparticles. Nanomaterials 6:165–180
34. Kumar HMS et al (2006) Analysis of fluorescence quenching of new indole derivative by aniline using Stern–Volmer plots. J Lumin 116:35–42 35. Hu YJ et al (2010) Site-selective binding of human serum albumin by
palmatine: spectroscopic approach. Biomacromolecules 11:106–112 36. Yang, W. Z., et al. (2010) Self-aggregated nanoparticles of
cholesterol-modified pullulan conjugate as a novel carrier of mitoxantronep. Curr Nanosci 6:298–306
37. Li X et al (2012) Application of model-based methods to characterize exenatide-loaded double-walled microspheres: in vivo release, pharmacokinetic/pharmacodynamic model, and in vitro and in vivo correlation. J Pharm Sci 101:3946–3961
38. Tao X et al (2012) Effect of pullulan nanoparticle surface charges on HSA complexation and drug release behavior of HSA-bound nanoparticles. PLoS One 7:49304–49317
39. Albanese A et al (2012) The effect of nanoparticle size, shape, and surface chemistry on biological systems. Annu Rev Biomed Eng 14:1–19
40. Lundqvist M et al (2008) Nanoparticle size and surface properties determine the protein corona with possible implications for biological impacts. Proc Natl Acad Sci U S A 105:14265–14270
41. Werber L et al (2015) Isothermal titration calorimetry of chiral polymeric nanoparticles. Chirality 27:613–618
42. Bereznyak E et al (2015) Thermal analysis of ligand-DNA interaction: determination of binding parameters. Aims Biophysics 2(4):423–440 43. Aghaee E et al (2014) Combined docking, molecular dynamics simulations
and spectroscopic studies for the rational design of a dipeptide ligand for affinity chromatography separation of human serum albumin. J Mol Model 20(10):2446–2453
44. Chen K et al (2014) Optimizing the selective recognition of protein isoforms through tuning of nanoparticle hydrophobicity. Nanoscale 6:6492–6495 45. Walkey CD et al (2012) Nanoparticle size and surface chemistry determine
serum protein adsorption and macrophage uptake. J Am Chem Soc 134: 2139–2153