comm
en
t
re
v
ie
w
s
re
ports
de
p
o
si
te
d r
e
se
a
rch
refer
e
e
d
re
sear
ch
interacti
o
ns
inf
o
rmation
Patterns and rates of intron divergence between humans and
chimpanzees
Elodie Gazave
*
, Tomàs Marqués-Bonet
*
, Olga Fernando
*†
,
Brian Charlesworth
‡
and Arcadi Navarro
§
Addresses: *Unitat de Biologia Evolutiva, Departament de Ciències Experimentals i de la Salut, Universitat Pompeu Fabra, Carrer Dr Aiguader 88, 08003 Barcelona, Catalonia, Spain. †Instituto de Tecnologia Química e Biológica (ITQB), Universidade Nova de Lisboa, Av. da República (EAN) 2781-901 Oeiras, Lisboa, Portugal. ‡Institute of Evolutionary Biology, University of Edinburgh, West Mains Road, Edinburgh, Scotland, EH7 3JT, UK. §Institucio Catalana de Recerca i Estudis Avancats (ICREA), Unitat de Biologia Evolutiva, Departament de Ciències
Experimentals i de la Salut, Universitat Pompeu Fabra, Carrer Dr Aiguader 88, 08003 Barcelona, Catalonia, Spain.
Correspondence: Arcadi Navarro. Email: [email protected]
© 2007 Gazave et al.; licensee BioMed Central Ltd.
This is an open access article distributed under the terms of the Creative Commons Attribution License (http://creativecommons.org/licenses/by/2.0), which permits unrestricted use, distribution, and reproduction in any medium, provided the original work is properly cited.
Primate intron divergence
<p>An analysis of human-chimpanzee intron divergence shows strong correlations between intron length and divergence and GC-con-tent.</p>
Abstract
Background: Introns, which constitute the largest fraction of eukaryotic genes and which had been considered to be neutral sequences, are increasingly acknowledged as having important functions. Several studies have investigated levels of evolutionary constraint along introns and across classes of introns of different length and location within genes. However, thus far these studies have yielded contradictory results.
Results: We present the first analysis of human-chimpanzee intron divergence, in which differences in the number of substitutions per intronic site (Ki) can be interpreted as the footprint of different intensities and directions of the pressures of natural selection. Our main findings are as follows: there was a strong positive correlation between intron length and divergence; there was a strong negative correlation between intron length and GC content; and divergence rates vary along introns and depending on their ordinal position within genes (for instance, first introns are more GC rich, longer and more divergent, and divergence is lower at the 3' and 5' ends of all types of introns).
Conclusion: We show that the higher divergence of first introns is related to their larger size. Also, the lower divergence of short introns suggests that they may harbor a relatively greater proportion of regulatory elements than long introns. Moreover, our results are consistent with the presence of functionally relevant sequences near the 5' and 3' ends of introns. Finally, our findings suggest that other parts of introns may also be under selective constraints.
Background
Introns are neither neutrally evolving sequences nor junk DNA, as they were once considered to be. Increasing amounts of evidence show that they harbor a variety of untranslated
RNAs, including microRNAs, small nucleolar RNAs, and guide RNAs for RNA editing [1]. Introns are also important for mRNA processing and transport [2]. Moreover, micro-array tiling experiments [3] have shown that a substantial Published: 19 February 2007
Genome Biology 2007, 8:R21 (doi:10.1186/gb-2007-8-2-r21)
Received: 2 August 2006 Revised: 8 December 2006 Accepted: 19 February 2007 The electronic version of this article is the complete one and can be
part of the cell's transcriptional activity involves polyade-nylated RNA that appears to be derived from intergenic regions, antisense sequences of known transcripts, and introns. Also, recent studies [4,5] show that almost all small nucleolar RNAs and a large proportion of microRNAs in ani-mals are encoded in introns. Finally, novel intronic tran-scripts are continually being reported (for instance, see the report by Kampa and coworkers [6]), even though their func-tional properties are still largely unknown. This evidence implies that at least a fraction of intronic regions have func-tions and that they are likely to be evolving under the influ-ence of natural selection, mostly purifying selection.
The effects of selective constraints on patterns of nucleotide divergence and polymorphism have been used by previous authors as a way to investigate the functional properties of
introns. Several studies have been performed using
Dro-sophila data. Marais and coworkers [7] showed that first introns are on average two times longer than other introns. They also found a negative correlation between protein
diver-gence rates between D. melanogaster and D. yakuba and the
lengths of introns in the corresponding genes. However, sub-sequent studies contradict those results. In a comparison of D. melanogaster and D. simulans, Haddrill and coworkers [8] found that first introns are not evolving more slowly or faster than other introns, whereas the class of long introns had higher GC content and lower divergence than short introns.
Evidence from mammalian introns is also contradictory. Var-ious studies have demonstrated the presence of regulatory elements in mammalian introns, particularly first introns [9-11]. Also, in both mouse [12] and human [13], it has been shown that first introns enhance gene expression more than any others. If first introns were enriched with regulatory ele-ments, they should thus have lower rates of evolution than other introns. Chamary and Hurst [14] showed that this is the case when comparing mouse and rat sequences. Consistent with this, Gaffney and Keightley [15] observed a negative cor-relation between mean intronic selective constraint and intron ordinal number, meaning that first introns are more conserved between rat and mouse than other introns. How-ever, this contradicts a previous analysis [16] of divergence between human and mouse introns, which found that first introns evolve faster than other introns. Although these stud-ies are difficult to compare because they use different pairs of species, the discrepancy remains puzzling. It may be attrib-uted to difficult alignment of introns over the long evolution-ary distances between human and mouse, or perhaps to different selective pressures acting in different lineages. Thus far, no clear resolution to this puzzle has been provided.
Among this confusing set of contradictory results, two undis-putable facts about human introns emerge. First, human introns contain regulatory elements and splicing control ele-ments that may affect patterns of genetic divergence. Second,
first introns tend to be longer than introns in other positions of the gene [17,18]. Majewski and Ott [19] showed that, in humans, introns possess splicing control elements, at least within a distance of 150 nucleotides from intron-exon bound-aries. They found that insertions of short interspersed repeats, microsatellite repeats, and the presence of single nucleotide polymorphisms were greatly reduced in such regions, especially in first introns. This suggests that these intron fragments are likely to be under purifying selection. Also, low complexity regions and simple repetitive elements are more abundant near intron-exon boundaries, suggesting a role in splicing regulation. Furthermore, human first introns are enriched in transcription regulatory elements, especially in the first 1,000 nucleotides from the intron-exon boundary at the 5' end [19].
We would expect that putatively regulatory intronic regions would be conserved between human and a closely related spe-cies such as chimpanzee. The availability of genome assem-blies for both species offers the possibility to assess intron characteristics at the whole genome scale. Here, we investi-gate intron divergence patterns between these two species, as
indicated by Ki (the number of substitutions per nucleotide in
introns), between truly orthologous pairs of human-chim-panzee introns. We describe the levels of molecular diver-gence between human and chimpanzee introns and show that these depend on characteristics such as intron length, order in the gene, and nucleotide composition. In addition, we pro-pose that although the differences in size and rate of evolution among introns depend on many factors, they are mainly determined by their regulatory element content.
Results
Divergence, length, GC content, and CpG islands
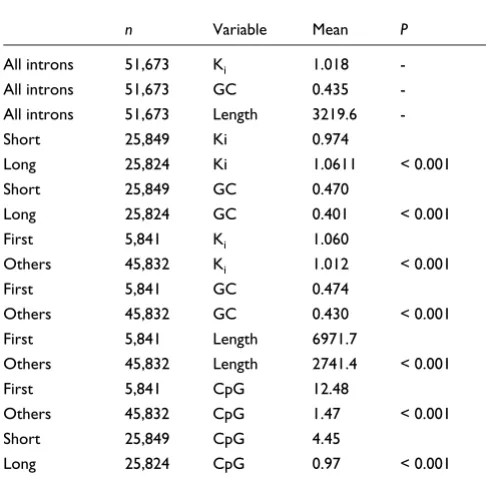
Introns have an average human-chimpanzee divergence of
1.018% (measured as Ki, the percentage of nucleotide changes
per intron), a mean length of 3,219.59 nucleotides, and a mean GC content of 43.51%. The mean proportion of intron sequence represented by CpG islands is 2.71% (Table 1). A first analysis shows that intron divergence is positively
corre-lated with GC content (r = 0.115, P < 10-5). Also, introns
longer than the median of 1,029 nucleotides (defined as 'long' introns; see Materials and methods, below) are more
diver-gent than short introns (Ki = 0.974 versus Ki = 1.061; Table 1).
However, GC content correlates negatively with length (r =
-0.107, P < 10-5). That is, long introns diverge more but they
are poorer in GC content.
comm
en
t
re
v
ie
w
s
re
ports
refer
e
e
d
re
sear
ch
de
p
o
si
te
d r
e
se
a
rch
interacti
o
ns
inf
o
rmation
same trends within the short and long intron classes (Table 2). Differences in GC content between first and nonfirst introns are almost equivalent for short and long introns. In contrast, divergence differences between first and nonfirst introns are clearly greater within the short category (Addi-tional data file 2). This suggests that divergence differences between first and nonfirst introns are at least partly accounted for by factors related to their length rather than factors related to their nucleotide composition. To further tease out the possible confounding effect of GC content on the relationship between intron divergence and length in first introns, we conducted a nonparametric partial correlation analysis between length and divergence. The relationship between intron length and divergence remains after
control-ling for the effect of GC content (Spearman r = 0.138, P <
0.01).
Nevertheless, a relationship between GC content and diver-gence exists, suggesting that mutational biases may explain
part of the divergence differences between intron classes. In mammals, nucleotide composition is correlated with the presence of CpG islands, whose relationship with divergence is unclear. To check whether the differential divergence between short and long and between first and nonfirst introns is associated with the presence of CpG islands, we measured the proportion of intron sequence constituted by these genomic features. Table 1 shows that first introns are tenfold richer in CpG islands than are other introns. This is also the case for short introns, which contain a four times greater pro-portion of CpG islands than long introns (long and first introns diverge more but they have, respectively, low and high CpG island coverage).
We also studied in detail the relationship between the ordinal position of introns in a gene (first intron, second intron, and so on) and divergence. The global correlation between intron
order and Ki is significant but very weak (r = -0.020, P < 10-4)
and mostly due to first introns, because the correlation drops
dramatically when they are removed (r = -0.010, P = 0.04).
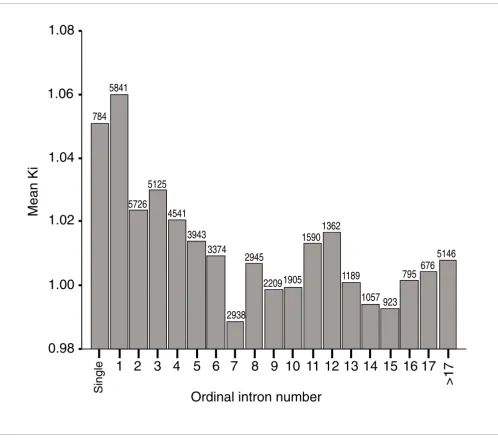
This indicates that divergence does not decay slowly and reg-ularly with the ordinal position of introns in a gene, but that high average divergence is exclusive to first introns (Figure 1).
Also, the relationship between intron length and Ki is
nonlin-ear. At first, there is a steep increase in divergence for the 35% shortest introns of the dataset (that is, the seven first classes of percentiles of length in Figure 2), followed by a higher homogeneity in divergence for larger introns (Figure 2). Because 35% is somewhat below the threshold that we used to define the class labeled as 'short' (median of the size
distribu-tion), we can say that the relationship between Ki and length
is especially strong for the shortest of short introns.
Finally, and as an additional way of ensuring that the higher divergence of first introns was not due to their higher average size, we separated them into 'long' and 'short' categories according to their median size. In this way, and only for this analysis, long first introns were those above 2,020 nucleo-tides and short first introns were those equal to or below this length. When comparing the 2,921 long and 2,920 short first introns classified according to this criterion, we observed that short first introns were significantly more conserved and sig-nificantly richer in GC content than were long first introns, following exactly the same trends as described above for
non-first introns (Ki short = 1.041, Ki long = 1.079 [P = 0.0030]; GC
Table 1
Ki, GC, CpG and length measures for all introns
n Variable Mean P
All introns 51,673 Ki 1.018
-All introns 51,673 GC 0.435
-All introns 51,673 Length 3219.6
-Short 25,849 Ki 0.974
Long 25,824 Ki 1.0611 < 0.001
Short 25,849 GC 0.470
Long 25,824 GC 0.401 < 0.001
First 5,841 Ki 1.060
Others 45,832 Ki 1.012 < 0.001
First 5,841 GC 0.474
Others 45,832 GC 0.430 < 0.001
First 5,841 Length 6971.7
Others 45,832 Length 2741.4 < 0.001
First 5,841 CpG 12.48
Others 45,832 CpG 1.47 < 0.001
Short 25,849 CpG 4.45
Long 25,824 CpG 0.97 < 0.001
[image:3.612.53.296.117.356.2]Shown are results of permutation tests between short and long introns and between first and other introns.
Table 2
Short versus long and first versus non-first introns
Short introns Long introns
N Ki P GC P N Ki P GC P
First 1,880 1.028 0.550 3,961 1.075 0.438
Others 23,969 0.970 < 0.001 0.463 < 0.001 21,863 1.059 0.016 0.339 < 0.001
short = 0.522, GC long = 0.425 [P < 10-5]). This therefore
con-firms an intrinsic length effect.
Divergence, splicing control sites, and regulatory elements
To assess whether the greater divergence of long and first introns was related to their relative amount of regulatory ele-ments, we performed some additional analyses. Introns pos-sess splicing control elements in their 150 first 5' and 3' nucleotides from the intron-exon boundary [19]. Further-more, human first introns are enriched in transcription regu-latory elements, especially in their first 1,000 nucleotides at
the 5' end [19]. Short introns may possess a greater propor-tion of such elements, thereby explaining their lower divergence.
To test this hypothesis, we divided all introns into three frag-ments: the first 150 nucleotides from the 5' end, the last 150 nucleotides from the 3' end, and the remaining central part. We also split first introns into three fragments: the first 1,000 nucleotides at the 5' end, the last 150 nucleotides at the 3' end, and the remaining part. Because all the comparisons on these fragments were performed on the unmasked dataset (see
Material and methods, below), the raw values of Ki and GC
[image:4.612.58.556.84.527.2]Mean Ki as a function of the ordinal position of introns (relative to other introns of the same gene)
Figure 1
Mean Ki as a function of the ordinal position of introns (relative to other introns of the same gene). Single introns constitute a special category. All introns whose number within the gene was above 20 were pooled together, to avoid classes of sample size that was too different. The number above each bar represents the sample size of each category. First and single introns are the more divergent ones.
Single
1 2 3 4
5 6 7
8 9 10 11 12 13 14 15 16 17
>17
0.98
1.00
1.02
1.04
1.06
1.08
Mean Ki
784
5841
5726
5125
4541
3943
3374
2938
2945
22091905
1590
5146
1189
1057
1362
923
795
676
comm
en
t
re
v
ie
w
s
re
ports
refer
e
e
d
re
sear
ch
de
p
o
si
te
d r
e
se
a
rch
interacti
o
ns
inf
o
rmation
content cannot directly be compared with those of the analy-sis above. For example, the addition of repetitive elements
has the effect of increasing the average Ki value of the whole
sample (Ki masked = 1.043, Ki unmasked = 1.142, n = 37,682; P <
0.001).
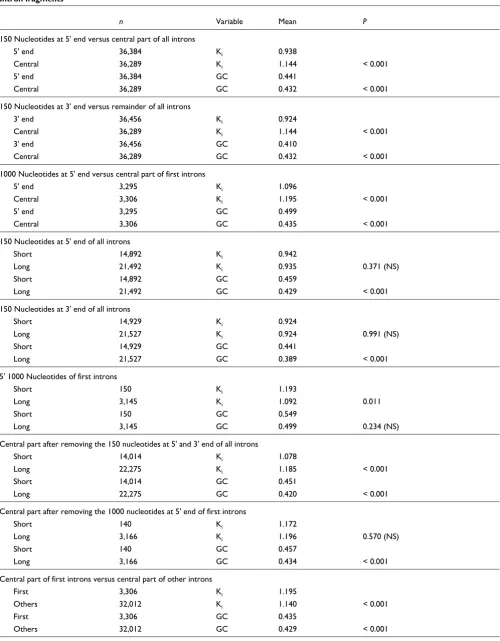
The regions that were previously shown to harbor splicing control sites (150 nucleotides at the 5' and 3' ends of all introns) diverge much less than the central part of the introns (Table 3). Furthermore, these highly conserved regions do
not differ in Ki between long and short introns (Table 3),
sup-porting the hypothesis that they contain elements common to all introns, independent of their length. The central parts of
all introns (what remains after removing the 150 nucleotides at the 5' ends and 150 nucleotides at the 3' ends) still exhibit greater divergence in long introns than in short ones. Low divergence of short introns is therefore not due only to a higher proportion of known splicing control elements in their boundaries. Also, the central parts of longer introns have lower GC contents (Table 3).
The 1,000 nucleotides at the 5' ends of first introns, poten-tially containing regulatory elements such as transcription factor binding sites [19,20], are also more conserved than the central part of first introns (Table 3). However, the difference in divergence for these 1,000 nucleotides between long and Average Ki for 20 classes of percentiles of length
Figure 2
Average Ki for 20 classes of percentiles of length. Although there is a global increase in divergence with size, the shortest class of size presents an especially low divergence compared with all of the following classes of intron size.
Ntiles of Length
20
19
18
17
16
15
14
13
12
11
10
9
8
7
6
5
4
3
2
1
Mean Ki
1.20
1.10
1.00
0.90
0.80
Table 3
Intron fragments
n Variable Mean P
150 Nucleotides at 5' end versus central part of all introns
5' end 36,384 Ki 0.938
Central 36,289 Ki 1.144 < 0.001
5' end 36,384 GC 0.441
Central 36,289 GC 0.432 < 0.001
150 Nucleotides at 3' end versus remainder of all introns
3' end 36,456 Ki 0.924
Central 36,289 Ki 1.144 < 0.001
3' end 36,456 GC 0.410
Central 36,289 GC 0.432 < 0.001
1000 Nucleotides at 5' end versus central part of first introns
5' end 3,295 Ki 1.096
Central 3,306 Ki 1.195 < 0.001
5' end 3,295 GC 0.499
Central 3,306 GC 0.435 < 0.001
150 Nucleotides at 5' end of all introns
Short 14,892 Ki 0.942
Long 21,492 Ki 0.935 0.371 (NS)
Short 14,892 GC 0.459
Long 21,492 GC 0.429 < 0.001
150 Nucleotides at 3' end of all introns
Short 14,929 Ki 0.924
Long 21,527 Ki 0.924 0.991 (NS)
Short 14,929 GC 0.441
Long 21,527 GC 0.389 < 0.001
5' 1000 Nucleotides of first introns
Short 150 Ki 1.193
Long 3,145 Ki 1.092 0.011
Short 150 GC 0.549
Long 3,145 GC 0.499 0.234 (NS)
Central part after removing the 150 nucleotides at 5' and 3' end of all introns
Short 14,014 Ki 1.078
Long 22,275 Ki 1.185 < 0.001
Short 14,014 GC 0.451
Long 22,275 GC 0.420 < 0.001
Central part after removing the 1000 nucleotides at 5' end of first introns
Short 140 Ki 1.172
Long 3,166 Ki 1.196 0.570 (NS)
Short 140 GC 0.457
Long 3,166 GC 0.434 < 0.001
Central part of first introns versus central part of other introns
First 3,306 Ki 1.195
Others 32,012 Ki 1.140 < 0.001
First 3,306 GC 0.435
Others 32,012 GC 0.429 < 0.001
comm
en
t
re
v
ie
w
s
re
ports
refer
e
e
d
re
sear
ch
de
p
o
si
te
d r
e
se
a
rch
interacti
o
ns
inf
o
rmation
short first introns is marginally significant, in the opposite direction to what we observed for the 150 nucleotides in 5' ends of all introns (Table 3). That is, the first 1,000 nucleo-tides at the 5' end are more divergent in short than in long introns. This may mean that regulatory elements in short first introns are different from those in long first introns. How-ever, we must be cautious with this interpretation, given the small sample size available for this test. This is because of the fact that the analysis above includes only the longest introns of the 'short' class (introns above 1,199 nucleotides), because we removed 1,000 + 150 nucleotides at both ends and we did not retain the central part when its size was less than 49 nucleotides (corresponding to the minimum intron size that we decided to include in the analysis). It is possible to have introns labeled as 'short' although they have a size above 1,199 nucleotides because we used the unmasked dataset for the analysis of intron fragments (see Material and methods, below, for more details). An alternative explanation would be that the conserved part of first introns does not span as much as 1,000 nucleotides. We can also see in Table 3 that, in the case of first introns, the difference in divergence between short and long introns after removing the 1,000 nucleotides at the 5' end is no longer significant. This suggests that, in contrast to other introns, divergence in first introns is inde-pendent of size, once the portion of their sequence composed by elements under very strong purifying selection is removed. Finally, when comparing the central part of all nonfirst introns with the central part of first introns alone, we see that first introns still diverge significantly more than other introns (Table 3). In other words, even after removing the outermost intron regions, where most constrained sequences are located, first introns are still characterized by higher diver-gence rates.
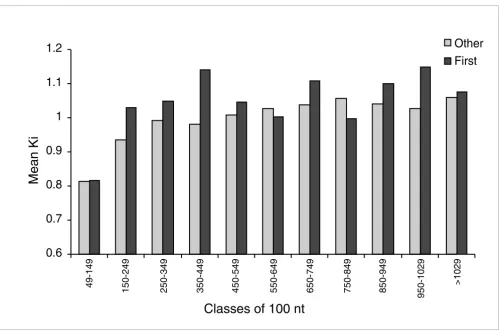
To further study the relationship between intron length and divergence, we divided introns into different categories of size, grouping them into intervals of 100 nucleotides. Figure
3 shows Ki for introns of these different length classes. In the
same figure, we can see that, after a steep increase, divergence seems to reach a plateau for introns of 300 nucleotides and more. This pattern looks less even for first introns than for other introns, perhaps because of lower sample size in each length class. This value of 300 nucleotides closely corre-sponds to the 150 nucleotides at the 5' ends plus the 150 nucleotides at the 3' ends that are probably under purifying selection. Introns of shorter size than 300 nucleotides mostly have highly conserved sequences. We can also see that, in the shortest class of introns (49-150 nucleotides), there is appar-ently almost no difference between first and nonfirst introns (Figure 3).
Finally, we wished to investigate whether introns of single-intron genes had special characteristics. We observe that sin-gle introns are significantly longer than the other introns. The
difference in mean Ki values between single and other introns
is not significant, although the divergence of single introns is
almost as high as that of first introns (Ki first = 1.060, Ki single =
1.051; Table 4 and Figure 1). Low sample sizes may account for the lack of significant results. If that were the case, then the high divergence of single introns could perhaps be explained by their size, but - as for first introns - an explana-tion for their length would still be needed.
Regarding variation in GC content among the different intron fragments, no consistent patterns were found. In some cases,
higher GC is associated with higher Ki, whereas in others the
more divergent category is associated with the lowest GC con-tent (Table 3).
Housekeeping genes and divergence in intact introns
After removing the outmost parts of introns, which are puta-tively under stronger purifying selection than their central parts, we still observe lower substitution rates in short introns. This can be due either to an enrichment in conserved regulatory elements or to other factors that are correlated with length. Castillo-Davis and coworkers [21] showed that introns of housekeeping genes were shorter and richer in GC content. These patterns were also detected in our dataset. In addition, we found that introns of housekeeping genes are more conserved, although the difference is only marginally significant (Table 5). To determine whether the class of short introns diverges less because it is enriched in housekeeping genes, we removed housekeeping genes and repeated our long/short analysis. The difference between short and long introns is still significant (Table 5), meaning that the effect of housekeeping genes is not the only factor affecting the differ-ence in evolutionary rates between introns of different lengths.
Recombination
As expected, divergence and recombination are significantly
correlated in the masked dataset (r = 0.118, P < 0.001), the
correlation being observed in both short and long introns (rshort = 0.083, P < 0.001; rlong = 0.156, P < 0.001). We also confirm that recombination positively correlates with GC
content (r = 0.175, P < 0.001). Finally, there is no overall
cor-relation between intron length and recombination (r = 0.006,
P = 0.255). When performed within each class of size (short
and long), the correlations between recombination and length are significant, but their signs are different. That is, recombination rate does not have a linear relationship with length; it is negatively correlated with length for short introns (rshort = - 0.045, P < 0.001), but positively correlated - albeit
weakly - with length for long introns (rlong = 0.014, P = 0.036).
Recombination rates are higher in first and in short introns (Table 6). That is, first introns recombine more, perhaps because - on average - they are longer. When focusing only on these, we observed the same pattern of variation between recombination and length as for the whole dataset, although
correlations are not significant (rshort = - 0.022, P = 0.436;
Known evolutionary factors affecting sequence divergence
Some of the analyses presented above might have been biased by factors that are known to affect rates of divergence and/or intron length. For example, if genes in the X chromosome had shorter and less divergent introns, then this could artefactu-ally give rise to some of the patterns we detected. To ensure that this is not the case, we repeated our main tests after con-trolling for these factors (see Material and methods, below, and Additional data file 1). This analysis revealed a few biases, some of which are conservative (they go in the opposite direc-tion to our overall results). For example, introns of chromo-some 19, which are highly divergent, tend to be shorter than introns elsewhere in the genome. Also, introns located in telomeres and centromeres are shorter than introns outside these regions but, in contrast, divergence rates go in opposite directions, being higher in telomeres and lower in centro-meres (Additional data file 1). At any rate, our results remain the same after removing genes located in these regions, meaning that introns of different classes are equally affected by these factors. This indicates that the differences in diver-gence between short and long introns that we reported above
are not due to a higher proportion of certain intron classes in given chromosomes or genomic regions.
Discussion
[image:8.612.59.558.82.416.2]The overall picture that emerges from our findings is that, as revealed by human and chimpanzee divergence, different introns and different parts of introns may have been sub-jected to different evolutionary forces, among which is natu-ral selection. Our first series of results are related to intron length and nucleotide composition, showing a negative corre-lation between intron size and GC content. A steep decrease in GC content with intron length had previously been reported in the human genome [18]; in contrast, no such rela-tionship has been reported for exon length. Moreover, Majewski and Ott [19] showed that first introns have the striking feature of being the most GC-rich elements of a gene, with an average GC content up to 65% near the 5' splicing site. According to those authors, this pattern is due to an over-abundance of regulatory motifs such as CpG and GGG trinu-cleotides. In the same study, an excess of CCC triplets was found near both splice sites, whereas other dinucleotides or Evolution of Ki within short introns (49 to 1029 nucleotides)
Figure 3
Evolution of Ki within short introns (49 to 1029 nucleotides). The last bar of the histogram represents the cumulative data for all long introns. Data are
presented for first and nonfirst introns separately, and are pooled in categories of increasing size class of 100 nucleotides for visual clarity. Nonfirst introns reach a plateau of mean Ki around 300 nucleotides, whereas this pattern is not as clearly discernable in first introns. nt, nucleotides.
0.6
0.7
0.8
0.9
1
1.1
1.2
Classes of 100 nt
Mean Ki
Other
First
49-149
150-249 250-349 350-449 450-549 550-649 650-749 750-849 850-949
950-1029
comm
en
t
re
v
ie
w
s
re
ports
refer
e
e
d
re
sear
ch
de
p
o
si
te
d r
e
se
a
rch
interacti
o
ns
inf
o
rmation
trinucleotides did not exhibit such effects. Finally, G-rich ele-ments have been shown to act as splicing enhancers [22]. Majewski and Ott [19] also emphasized that the internal parts of introns do not exhibit an excess of CpG. The global GC enrichment that we found in first introns compared with
other introns may thus reflect their higher density of GC-rich regulatory elements. We observed that the categories with a higher GC content are enriched in CpG islands, which is consistent with results from previous authors (see, for exam-ple, Takai and Jones [23]). CpG islands are frequently associ-ated with the 5' ends of genes and are thought to play an important role in the regulation of gene expression [24]; this may explain their abundance in first introns.
Another series of results involves patterns of divergence. GC content is positively correlated with intron divergence. How-ever, as mentioned above, intronic regulatory sequences are expected to be enriched in GC. Therefore, the higher diver-gence of GC-rich introns may seem paradoxical, because we would expect GC-rich regulatory motifs to be selectively con-strained. However, the positive correlation between intron size and divergence that we detected suggests that the density of conserved sequences is lower in long introns. This may explain why long introns are, simultaneously, GC poorer and more divergent. A class of constrained sequences that could account for this effect are splicing control sites, located close to exon-intron boundaries. However, after removing the out-most 150 nucleotides at both ends of all introns, divergence is still lower in short introns, so their relative higher density of splicing control sites cannot explain the positive correlation between intron size and divergence.
Thus, other factors need to be invoked to explain the lower divergence of short introns. First of all, it is possible that other classes of regulatory elements, in particular not GC-based motifs, that we did not take into account are distributed all over the introns, and are not only located in the 150 nucleo-tides close to intron-exon boundaries. This would be consist-ent with previous experimconsist-ental work describing some such elements [25,26]. If this were the case, then short introns would diverge less because of their relatively higher propor-tion of regulatory elements.
As mentioned above, CpG islands are associated with gene expression regulation. They are also constitutively hypometh-ylated, and lack the mutagenic effect seen in their methylated CpG counterparts [27]. We found that short introns contain a higher proportion of CpG islands, which could account for their lower divergence compared with long introns. However, first introns are more divergent than other introns, and also have a much higher density of CpG islands than nonfirst introns. In summary, a higher density of CpG islands is found in both slowly diverging short introns and rapidly diverging first introns. This suggests that CpG islands do not have a direct overall effect upon rates of divergence in introns.
A potential factor directly linking intron length and diver-gence is recombination. In agreement with previous studies [28,29], we found that length is negatively correlated with GC content in human introns; divergence and GC content are both positively correlated with recombination rate. Still, the Table 4
Single introns
n Variable Mean P
Single 784 Length 6253.5
Others 50,889 Length 3172.8 < 0.001
Single 784 GC 0.486
Others 50,889 GC 0.443 < 0.001
Single 784 Ki 1.051
Others 50,889 Ki 1.017 0.086
Shown are the average length, GC content, and Ki for single introns
[image:9.612.53.296.96.219.2]versus other introns.
Table 5
Housekeeping genes
n Variable Mean P
All introns
Housekeeping 1129 Length 1513.4
Others 50,544 Length 3257.7 < 0.001
Housekeeping 1,129 GC 0.450
Others 50,544 GC 0.435 < 0.001
Housekeeping 1,129 Ki 0.984
Others 50,544 Ki 1.018 0.037
Without housekeeping genes
Short 25,116 Ki 0.975
Large 25,428 Ki 1.061 < 0.001
First 5,689 Length 7083.7
Others 44,855 Length 2772.5 < 0.001
Shown are the mean length, GC content and Ki for housekeeping genes
versus other genes. Also shown are mean Ki and length for short versus
large introns, and first versus other introns in all introns without housekeeping genes.
Table 6
Recombination
n Variable mean P
First 4,943 R 1.204
Others 27,925 R 1.035 < 0.001
Short 10,895 R 1.116
Large 21,973 R 1.033 < 0.001
[image:9.612.53.298.274.478.2]correlations we detected are too weak to have any biologic rel-evance; also, the fact that in the human genome most recom-bination takes place in hotspots separated by an average distance of 200 kilobases [30] may be artefactually inflating recombination in long introns compared with shorter ones. Recombination thus does not seem able to explain our results.
Another hypothesis to explain the relationship between size and divergence in our data is that the class of short introns is enriched in introns from housekeeping genes, because introns are substantially shorter [31] and GC richer [21] in such highly expressed genes. The shorter size of introns in housekeeping genes has been suggested to reflect the influ-ence of strong selective pressures to reduce their transcrip-tional cost [21]. This hypothesis is referred to by some authors as the 'selection for economy' hypothesis, and implicitly assumes a neutralist interpretation of the accumulation of DNA in eukaryotic genomes. However, even if the introns of housekeeping genes are indeed less divergent, GC richer, and shorter, our results remain the same after removing them, suggesting that the 'selection for economy' model cannot explain intron evolution on its own. In a recent report, Vinogradov [32] tested alternative hypotheses to explain variations in intron size within the genome. In particular, he investigated the adaptationist 'genome design' hypothesis, which proposes that the intragenic and intergenic noncoding DNA, in which tissue specific genes are embedded, is involved in regulation. In other words, the variation in length of genomic elements such as introns is determined by their function. Elements such as transcription factor binding sites and noncoding RNAs present in introns may be in a higher proportion in development-specific and condition-specific genes, which need fine and very complex regulation, and would thus have longer introns than housekeeping genes. Vinogradov [32] found a strong relationship between the length of conserved intronic sequences between human and mouse and the number of functional domains in the corre-sponding proteins, and therefore favored the 'genome design' model over the 'selection for economy' one. The results on Drosophila reported by Haddrill and coworkers [8] also sup-port this model, even though they differ from our findings in other aspects, as discussed below.
Many studies have shown that selectively constrained non-coding DNA and intron-associated control elements are more frequently found in first introns than other introns [9-11,20], especially close to the 5' end of first introns [19] or close to the start codon [33]. Again, it may seem contradictory that first introns harbor more regulatory and control elements and are simultaneously more divergent than other introns. However, as underlined by Chamary and Hurst [14], the fact that first introns are longer and harbor a higher number of regulatory elements does not imply that their overall density of con-strained sites is higher. For example, if an interaction between transcription factor binding sites with chromatin
structure is necessary for correct transcriptional regulation, as suggested by Vinogradov [32], then a minimum spacing between these binding sites might be required. This would explain why first introns are on average longer than other introns. Unfortunately, this hypothesis is difficult to test because regulatory motifs are short sequences of low infor-mational content [34,35], so that most of them are still unknown or difficult to differentiate from spurious sequences.
Thus far we have tried to describe the patterns of intron diver-gence between humans and chimpanzees, and to propose hypotheses regarding the forces that act on intron evolution, comparing our results to findings from other species. In many cases, these results are contradictory to ours. An example of such contradiction is the positive correlation between GC content and divergence that we report here, which is in con-rast to the results reported by Haddrill and coworkers [8] on Drosophila. Apart from the fact that the difference in
distri-bution of intron size between Drosophila and
human/chim-panzee makes it difficult to compare the two sets of findings (Additional data file 3), the discrepancy must be somehow related to the fact that forces acting on nucleotide
composi-tion are very different in different lineages. Indeed, Aerts et
al. [36] detected opposite changes of relative AT richness in
humans and flies around transcription start sites, proposing that fly genes differ from humans in their AT content because of differences in their concentration of AT-rich transcription factor binding sites around transcription start sites. Another example also comes from the analysis conducted by Haddrill and coworkers [8]. These authors provided evidence that var-iation in GC content may reflect local varvar-iation in mutational rates or biases, or the effects of biased gene conversion favor-ing GC over AT, which mimics selection in favor of GC dinucleotides. However, in a study of mouse-rat genome divergence, Chamary and Hurst [14] showed that transcrip-tion-coupled mutational processes and biased gene conver-sion cannot explain sequence evolution. Rather, they presented strong evidence for selectively driven codon usage in mammals.
A further example of contradictory data coming from differ-ent species is reported by Presgraves [37]. In that study of the
pattern of small insertions and deletions in different
Dro-sophila species, Presgraves suggested that intron length evo-lution is affected by chromosome-specific and
lineage-specific forces. Using Drosophila yakuba as an outgroup, he
showed that in D. melanogaster X-linked introns have
slightly increased in size, whereas autosomal ones have
slightly decreased in size. In contrast, in D. simulans both
autosomes and the X chromosome have decreased in size
since their divergence from D. yakuba. Presgraves'
comm
en
t
re
v
ie
w
s
re
ports
refer
e
e
d
re
sear
ch
de
p
o
si
te
d r
e
se
a
rch
interacti
o
ns
inf
o
rmation
be observed in sister species, then it is only to be expected that results between more distant species are even more dissimi-lar. In the data analyzed here, we found X chromosome introns to be shorter and more divergent than autosomal introns. Comparing pairs of paralogous introns in the human genome, Cardazzo and coworkers [38] also found that introns of autosomal genes are significantly longer than X-linked introns. Therefore, although our results are not identical to those with other species, they are at least consistent with pre-vious studies on the lengths of human introns.
The importance of functional elements in noncoding sequences of the genome is becoming increasingly acknowl-edged. Conserved noncoding sequences have been shown to be selectively constrained [39]. Among the 327,000 con-served nongenic sequences that were recently found in the human genome, 35% were located in introns (for review, see Dermitzakis and coworkers [40]). Bejerano and colleagues [41] showed that around 100 of the 481 ultraconserved ele-ments in the human genome (that is, sequences having 100% similarity between human and mouse and stretching over = 200 nucleotides) map within introns. Although the functions of these noncoding conserved sequences is mostly unknown, at least some of them play a regulatory role [42]. Until now, only very few studies have evaluated the action of selection on noncoding regions through the study of their divergence lev-els among species [34,43,44]. This confirms that selection is acting on upstream regions of genes [34,43] and 5'-untrans-lated regions [45]. However, to our knowledge, no study has yet been performed on introns. Such an analysis is currently underway.
Conclusion
We showed that, even after correcting for some potentially confounding factors, long introns have higher divergence between humans and chimpanzees than short introns, whereas GC content and length are negatively correlated. Another pattern is that divergence rates are higher in first introns than in nonfirst introns. The higher divergence of first introns is partly related to their longer length. This may reflect a high proportion of functional elements distributed along their sequence, separated by unconstrained regions. Finally, we also show that the 5' and 3' ends of introns, which are known to contain regulatory elements and splicing con-trol sites, have lower divergence than the remaining parts of introns. The best explanation for all these patterns is that purifying selection has a strong effect on shaping intron sequence evolution. It is also possible that divergence pat-terns and rates between human and chimpanzee introns have been affected by positive selection. To follow up this work, the next step would be to determine whether this is true and, if so, to identify which are the introns that may have undergone positive selection.
Materials and methods
Sequence gathering and alignment
We generated a first dataset, composed of sequences obtained from the RefSeq database [45]. The sequences correspond to human genome build 35 and chimpanzee genome build 1. Human intron positions were obtained from the UCSC Human RefSeq table [46]. Sequences were gathered from the masked human genome and their corresponding chimpanzee sequences were obtained from the positions of UCSC Xeno-refSeq table [46].
To avoid biases introduced by misalignment, every individual intron was aligned with the local alignment tool BLAST 2 Sequences [47], which uses the BLAST algorithm with default parameter values. In contrast to global alignment tools, such as CLUSTALW, local alignments do not force alignment between two sequences; if no good alignment is possible, the algorithm does not return any output. This allowed us to exclude a large number of false orthologous introns from our analysis. All local alignments for a given intron were joined by removing any overlapping parts (that is, locally aligning sev-eral times). To further avoid false intron orthology, we removed from the analysis any aligned intron pair for which less than 80% of the shortest sequence aligned to the other species. Also, we filtered out any genes with a different number of introns in the two species. Finally, because alter-native splicing and multiple transcripts allow for sets of overlapping introns, we only kept the longest intron from each set. This produced a final intron dataset of 52,646 introns, corresponding to 7,791 genes.
To perform some analyses and comparisons (such as the exact determination of intron-exon boundaries), a second, nonmasked dataset was obtained by gathering the unmasked sequences of any intron that had passed the filtering process above.
Divergence, GC content, and housekeeping genes
For every intron, human-chimpanzee divergence was meas-ured applying the Jukes-Cantor correction to the number of
substitutions per intronic site, Ki, using the distmat
applica-tion from the EMBOSS package [48]. Although we tried to exclude poorly aligned sequences, the dataset still contained
some exceedingly high Ki values, most likely due to false
orthology assignments. The dataset was therefore filtered by
removing all Ki values three standard deviations above the
mean. The filter was applied to the masked dataset and any
intron with Ki more than 3.025% was removed from both the
masked and the unmasked datasets. This implies that some introns in the unmasked dataset may have higher divergence than this 3.025% limit if their masked version had a diver-gence below this threshold.
chim-panzees. Their size in humans varies from 49 to 955,099 nucleotides and from 49 to 592,440 nucleotides after remov-ing the masked repetitive elements. In chimpanzees, intron size varies from 49 to 974,461 nucleotides, and from 49 to 566,414 nucleotides after removing masked repetitive elements.
Ancestral intronic GC content was also estimated for every gene as the average of the current human and chimpanzee GC content. The positions of CpG islands were downloaded from the CpG island UCSC annotation database [46]. The overlap between each individual intron and CpG islands is expressed as a percentage of the total size of the masked introns. Recom-bination data were obtained from UCSC SNP RecomRecom-bination Rates table [46]. All recombination values are given in centi-Morgans per megabase (cM/Mb). The list of housekeeping genes used in this paper is the one given by Hsiao and cow-orkers [49].
Intron fragments
To study the divergence and GC content measurements in fragments of introns that are of particular interest (such as the first 150 nucleotides at the 5' and 3' boundaries of introns, where splicing control sites have been reported), a set of PERL scripts was written to cut up introns into fragments and measure their divergence and GC content. Because we were interested in these regions and because most known regula-tory elements are composed of repetitive sequences, we per-formed this part of the study on the unmasked dataset. Also, to make sure that we were not losing regulatory elements, we only kept for analysis introns for which the alignment started between nucleotides 1 to 15 from the exon-intron boundary. Introns for which alignment started beyond that boundary were removed from this part of the analysis. After
computa-tion of Ki for each segment independently (150 nucleotides at
the 5' end, central part, and 150 nucleotides at the 3' end), all
intron fragments with Ki above 3.025 were again filtered out
to make the new file similar to the one of the global sample. For the same reason, all the fragments of the central part (that is, after removing the 150 nucleotides at the 5' end and the 150 nucleotides at the 3' end, or 1,000 nucleotides at the 5' end and 150 nucleotides at the 3' end) that were less than 49 nucleotides long (corresponding to the minimum length of alignment on the global dataset) were removed from the analysis.
Short and long introns
Introns were classified into two categories according to size. We followed the criteria used by Haddrill and coworkers [8], who defined introns as 'short' or 'long' based on the median of the length distribution. All introns shorter or equal to the median value (1,029 nucleotides) are labeled as 'short', and longer introns are labeled as 'long'. These categories were established in the masked dataset and, for consistent compar-isons, the same short/long classification was kept for the
unmasked dataset, even if lengths vary slightly between the two sets.
Test of common evolutionary factors affecting molecular evolution
To study factors that are known to affect divergence rates, introns were further classified into five categories according to their genomic location: within the sex chromosomes, human chromosome 19, telomeres (10 Mb from both ends of the chromosome in either species), centromeres (5 Mb from the centromeres in either species), and/or segmental duplica-tions (as defined in the Segmental Duplication Database [50]).
Statistical tests
Divergence, length, and GC content were compared among introns belonging to different ordinal categories (for exam-ple, first versus nonfirst intron) or different classes of length (that is, short versus long introns) by means of pairwise mutation tests (based on 1,000 permutations, or 5,000
per-mutations when the P values obtained after 1,000
permutations were above 0.01). P values are the proportion of
times that the difference in the averages of two categories in a permuted dataset was equal or larger than the observed dif-ference. Correlation tests (Pearson's product-moment corre-lations) were performed with R, version 1.9.0 [51]. Nonparametric partial correlations were performed, as described by Haddrill and coworkers [8].
Additional data files
The following additional data are available with the online version of this paper. Additional data file 1 is a table listing the
mean Ki and mean lengths for the main known factors
affecting divergence rates. Additional data file 2 is a figure
representing the mean GC content and mean Ki for short and
long introns. Additional data file 3 shows the comparative
distribution of intron length between human and Drosophila.
Additional data file 4 represents the Human RefSeq of the introns included in the analysis, with the main factors and
variables we study here: Ki, GC, first, and length (lengths are
given for the sequences after masking). Additional data file 1
A table listing the mean Ki and mean lengths for the main known
factors affecting divergence rates
A table listing the mean Ki and mean lengths for the main known
factors affecting divergence rates. Click here for file
Additional data file 2
A figure representing the mean GC content and mean Ki for short
and long introns
A figure representing the mean GC content and mean Ki for short
and long introns. Click here for file Additional data file 3
Comparative distribution of intron length between human and Drosophila
Comparative distribution of intron length between human and
Drosophila.
Click here for file Additional data file 4
Human RefSeq of the introns included in the analysis, with the main factors and variables we study here: Ki, GC, first, and length Human RefSeq of the introns included in the analysis, with the main factors and variables we study here: Ki, GC, first, and length (lengths are given for the sequences after masking).
Click here for file
Acknowledgements
comm en t re v ie w s re ports refer e e d re sear ch de p o si te d r e se a rch interacti o ns inf o rmation
References
1. Mattick JS, Gagen MJ: The evolution of controlled multitasked gene networks: the role of introns and other noncoding RNAs in the development of complex organisms. Mol Biol Evol 2001, 18:1611-1630.
2. Le Hir H, Nott A, Moore MJ: How introns influence and enhance eukaryotic gene expression. Trends Biochem Sci 2003, 28:215-220.
3. Johnson JM, Edwards S, Shoemaker D, Schadt EE: Dark matter in the genome: evidence of widespread transcription detected by microarray tiling experiments. Trends Genet 2005, 21:93-102.
4. Mattick JS, Makunin I: Non-coding RNA. Hum Mol Genet 2006, 15:R17-R29.
5. Mattick JS, Makunin I: Small regulatory RNAs in mammals. Hum Mol Genet 2005, 14(Spec No 1):R121-R132.
6. Kampa D, Cheng J, Kapranov P, Yamanaka M, Brubaker S, Cawley S, Drenkow J, Piccolboni A, Bekiranov S, Helt G, et al.: Novel RNAs identified from an in-depth analysis of the transcriptome of human chromosomes 21 and 22. Genome Res 2004, 14:331-342. 7. Marais G, Nouvellet P, Keightley PD, Charlesworth B: Intron size and exon evolution in Drosophila. Genetics 2005, 170:481-485. 8. Haddrill PR, Charlesworth B, Halligan DL, Andolfatto P: Patterns of
intron sequence evolution in Drosophila are dependent upon length and GC content. Genome Biol 2005, 6:R67.
9. Oshima RG, Abrams L, Kulesh D: Activation of an intron enhancer within the keratin 18 gene by expression of c-fos and c-jun in undifferentiated F9 embryonal carcinoma cells. Genes Dev 1990, 4:835-848.
10. Rohrer J, Conley ME: Transcriptional regulatory elements within the first intron of Bruton's tyrosine kinase. Blood 1998, 91:214-221.
11. Chan RY, Boudreau-Lariviere C, Angus LM, Mankal FA, Jasmin BJ: An intronic enhancer containing an N-box motif is required for synapse- and tissue-specific expression of the acetylcholinesterase gene in skeletal muscle fibers. Proc Natl Acad Sci USA 1999, 96:4627-4632.
12. Palmiter RD, Sandgren EP, Avarbock MR, Allen DD, Brinster RL: Heterologous introns can enhance expression of transgenes in mice. Proc Natl Acad Sci USA 1991, 88:478-482.
13. Jonsson JJ, Foresman MD, Wilson N, McIvor RS: Intron require-ment for expression of the human purine nucleoside phos-phorylase gene. Nucleic Acids Res 1992, 20:3191-3198.
14. Chamary JV, Hurst LD: Similar rates but different modes of sequence evolution in introns and at exonic silent sites in rodents: evidence for selectively driven codon usage. Mol Biol Evol 2004, 21:1014-1023.
15. Gaffney DJ, Keightley PD: Genomic selective constraints in murid noncoding DNA. PLoS Genet 2006, 2:e204.
16. Levy S, Hannenhalli S, Workman C: Enrichment of regulatory sig-nals in conserved non-coding genomic sequence. Bioinformat-ics 2001, 17:871-877.
17. Hawkins JD: A survey on intron and exon lengths. Nucleic Acids Res 1988, 16:9893-9908.
18. Human Genome Sequencing Consortium: Finishing the euchro-matic sequence of the human genome. Nature 2004, 431:931-945.
19. Majewski J, Ott J: Distribution and characterization of regula-tory elements in the human genome. Genome Res 2002, 12:1827-1836.
20. Keightley PD, Gaffney DJ: Functional constraints and frequency of deleterious mutations in noncoding DNA of rodents. Proc Natl Acad Sci USA 2003, 100:13402-13406.
21. Castillo-Davis CI, Mekhedov SL, Hartl DL, Koonin EV, Kondrashov FA: Selection for short introns in highly expressed genes. Nat Genet 2002, 31:415-418.
22. McCullough AJ, Berget SM: G triplets located throughout a class of small vertebrate introns enforce intron borders and regu-late splice site selection. Mol Cell Biol 1997, 17:4562-4571. 23. Takai D, Jones PA: Comprehensive analysis of CpG islands in
human chromosomes 21 and 22. Proc Natl Acad Sci USA 2002, 99:3740-3745.
24. Bird A: DNA methylation patterns and epigenetic memory. Genes Dev 2002, 16:6-21.
25. Hural JA, Kwan M, Henkel G, Hock MB, Brown MA: An intron tran-scriptional enhancer element regulates IL-4 gene locus accessibility in mast cells. J Immunol 2000, 165:3239-3249.
26. Henkel G, Weiss DL, McCoy R, Deloughery T, Tara D, Brown MA: A DNase I-hypersensitive site in the second intron of the murine IL-4 gene defines a mast cell-specific enhancer. J Immunol 1992, 149:3239-3246.
27. Saxonov S, Berg P, Brutlag DL: A genome-wide analysis of CpG dinucleotides in the human genome distinguishes two dis-tinct classes of promoters. Proc Natl Acad Sci USA 2006, 103:1412-1417.
28. Duret L, Mouchiroud D, Gautier C: Statistical analysis of verte-brate sequences reveals that long genes are scarce in GC-rich isochores. J Mol Evol 1995, 40:308-317.
29. Eyre-Walker A: Recombination and mammalian genome evolution. Proc Biol Sci 1993, 252:237-243.
30. McVean GA, Myers SR, Hunt S, Deloukas P, Bentley DR, Donnelly P: The fine-scale structure of recombination rate variation in the human genome. Science 2004, 304:581-584.
31. Eisenberg E, Levanon EY: Human housekeeping genes are compact. Trends Genet 2003, 19:362-365.
32. Vinogradov AE: 'Genome design' model: evidence from con-served intronic sequence in human-mouse comparison. Genome Res 2006, 16:347-354.
33. Sakurai A, Fujimori S, Kochiwa H, Kitamura-Abe S, Washio T, Saito R, Carninci P, Hayashizaki Y, Tomita M: On biased distribution of introns in various eukaryotes. Gene 2002, 300:89-95.
34. Bush EC, Lahn BT: Selective constraint on noncoding regions of hominid genomes. PLoS Comput Biol 2005, 1:e73.
35. Xie X, Lu J, Kulbokas EJ, Golub TR, Mootha V, Lindblad-Toh K, Lander ES, Kellis M: Systematic discovery of regulatory motifs in human promoters and 3' UTRs by comparison of several mammals. Nature 2005, 434:338-345.
36. Aerts S, Thijs G, Dabrowski M, Moreau Y, De Moor B: Comprehen-sive analysis of the base composition around the transcrip-tion start site in Metazoa. BMC Genomics 2004, 5:34.
37. Presgraves DC: Intron length evolution in Drosophila. Mol Biol Evol 2006, 23:2203-2213.
38. Cardazzo B, Bargelloni L, Toffolatti L, Patarnello T: Intervening sequences in paralogous genes: a comparative genomic approach to study the evolution of X chromosome introns. Mol Biol Evol 2003, 20:2034-2041.
39. Drake JA, Bird C, Nemesh J, Thomas DJ, Newton-Cheh C, Reymond A, Excoffier L, Attar H, Antonarakis SE, Dermitzakis ET, Hirschhorn JN: Conserved noncoding sequences are selectively con-strained and not mutation cold spots. Nat Genet 2006, 38:223-227.
40. Dermitzakis ET, Reymond A, Antonarakis SE: Conserved non-genic sequences - an unexpected feature of mammalian genomes. Nat Rev Genet 2005, 6:151-157.
41. Bejerano G, Pheasant M, Makunin I, Stephen S, Kent WJ, Mattick JS, Haussler D: Ultraconserved elements in the human genome. Science 2004, 304:1321-1325.
42. Woolfe A, Goodson M, Goode DK, Snell P, McEwen GK, Vavouri T, Smith SF, North P, Callaway H, Kelly K, et al.: Highly conserved non-coding sequences are associated with vertebrate development. PLoS Biol 2005, 3:e7.
43. Lee S, Kohane I, Kasif S: Genes involved in complex adaptive processes tend to have highly conserved upstream regions in mammalian genomes. BMC Genomics 2005, 6:168.
44. Osada N, Hirata M, Tanuma R, Kusuda J, Hida M, Suzuki Y, Sugano S, Gojobori T, Shen CK, Wu CI, Hashimoto K: Substitution rate and structural divergence of 5'UTR evolution: comparative anal-ysis between human and cynomolgus monkey cDNAs. Mol Biol Evol 2005, 22:1976-1982.
45. UCSC Genome Bioinformatics - full data set [http://hgdown load.cse.ucsc.edu/goldenPath/hg17/bigZips/]
46. UCSC Genome Bioinformatics - annotation database [http:/ /hgdownload.cse.ucsc.edu/goldenPath/hg17/database/]
47. BLAST 2 Sequences [http://www.ncbi.nlm.nih.gov/blast/bl2seq/ wblast2.cgi]
48. Rice P, Longden I, Bleasby A: EMBOSS: The European Molecular Biology Open Software Suite. Trends Genet 2000, 16:276-277. 49. Hsiao LL, Dangond F, Yoshida T, Hong R, Jensen RV, Misra J, Dillon
W, Lee KF, Clark KE, Haverty P, et al.: A compendium of gene expression in normal human tissues. Physiol Genomics 2001, 7:97-104.
50. Segmental Duplication Database [http://humanparal ogy.gs.washington.edu/]