Organization of the pronephric kidney revealed by large-scale gene
expression mapping
Daniela Raciti
*
, Luca Reggiani
*
, Lars Geffers
†
, Qiuhong Jiang
†
,
Francesca Bacchion
*
, Astrid E Subrizi
*
, Dave Clements
‡
,
Christopher Tindal
‡
, Duncan R Davidson
‡
, Brigitte Kaissling
§
and
André W Brändli
*
Addresses: *Institute of Pharmaceutical Sciences, Department of Chemistry and Applied Biosciences, ETH Zürich, Wolfgang-Pauli-Strasse 10, CH-8093 Zürich, Switzerland. †Department of Genes and Behavior, Max Planck Institute for Biophysical Chemistry, Am Fassberg 11, D-37077 Göttingen, Germany. ‡MRC Human Genetics Unit, Western General Hospital, Crewe Road, Edinburgh EH4 2XU, UK. §Institute of Anatomy, University of Zürich, Winterthurerstrasse 190, CH-8057 Zürich, Switzerland.
Correspondence: André W Brändli. Email: [email protected]
© 2008 Raciti et al.; licensee BioMed Central Ltd.
This is an open access article distributed under the terms of the Creative Commons Attribution License (http://creativecommons.org/licenses/by/2.0), which permits unrestricted use, distribution, and reproduction in any medium, provided the original work is properly cited.
Xenopus pronephros organisation
<p>Gene expression mapping reveals 8 functionally distinct domains in the Xenopus pronephros. Interestingly, no structure equivalent to the mammalian collecting duct is identified.</p>
Abstract
Background: The pronephros, the simplest form of a vertebrate excretory organ, has recently become an important model of vertebrate kidney organogenesis. Here, we elucidated the nephron organization of the Xenopus pronephros and determined the similarities in segmentation with the metanephros, the adult kidney of mammals.
Results: We performed large-scale gene expression mapping of terminal differentiation markers to identify gene expression patterns that define distinct domains of the pronephric kidney. We analyzed the expression of over 240 genes, which included members of the solute carrier, claudin, and aquaporin gene families, as well as selected ion channels. The obtained expression patterns were deposited in the searchable European Renal Genome Project Xenopus Gene Expression Database. We found that 112 genes exhibited highly regionalized expression patterns that were adequate to define the segmental organization of the pronephric nephron. Eight functionally distinct domains were discovered that shared significant analogies in gene expression with the mammalian metanephric nephron. We therefore propose a new nomenclature, which is in line with the mammalian one. The Xenopus pronephric nephron is composed of four basic domains: proximal tubule, intermediate tubule, distal tubule, and connecting tubule. Each tubule may be further subdivided into distinct segments. Finally, we also provide compelling evidence that the expression of key genes underlying inherited renal diseases in humans has been evolutionarily conserved down to the level of the pronephric kidney.
Conclusion: The present study validates the Xenopus pronephros as a genuine model that may be used to elucidate the molecular basis of nephron segmentation and human renal disease.
Published: 20 May 2008
Genome Biology 2008, 9:R84 (doi:10.1186/gb-2008-9-5-r84)
Received: 11 January 2008 Revised: 19 March 2008 Accepted: 20 May 2008 The electronic version of this article is the complete one and can be
Background
The kidney plays a pivotal role in fluid filtration, absorption and excretion of solutes, and in maintaining chemical home-ostasis of blood plasma and intercellular fluids. Its primary architectural unit is the nephron, which is a complex struc-ture composed of at least 12 segments that differ in both cel-lular anatomy and function [1-3]. Each nephron segment is composed of one or more highly specialized cell types that exhibit different patterns of gene expression and, in some cases, even have different embryological origins [4]. In humans, there are about 1 million nephrons per kidney [5]. Each nephron is composed of a filtering component (the renal corpuscle) and a tubule (the renal tubule). Along the tubular portion of the mammalian nephron, four main compartments have been identified: proximal tubule, intermediate tubule, distal tubule, and collecting duct. These four structures can be further subdivided into separate segments based on histolog-ical criteria [2,3]. Each nephron segment fulfills distinct physiological functions. The proximal tubules, for instance, return much of the filtrate to the blood circulation in the per-itubular capillaries by actively transporting small molecules from the tubular lumen across renal epithelia to the intersti-tial space, whereas the collecting duct system plays a major role in regulating acid-base balance and urine volume [6,7].
Segmentation of the developing nephron is a crucial step for successful kidney organogenesis. Much of our knowledge of kidney development is focused on the initial stages of kidney formation, where we have gained major insights into the tran-scription factors and signaling pathways that regulate the induction of nephrogenesis [8,9]. In contrast, little is known about how distinct segments arise along the proximodistal axis of the nascent nephron. Vertebrate kidneys are derived from the intermediate mesoderm in a process that involves inductive interactions, mesenchyme-to-epithelium transi-tions, and branching morphogenesis to generate the number of nephrons appropriate for the kidney type [4,10]. Three dif-ferent kidney forms - the pronephros, the mesonephros, and the metanephros - arise sequentially during vertebrate embryogenesis. Although each kidney form differs in overall organization and complexity, they all have the nephron as their basic structural and functional unit. The pronephros is the embryonic kidney of fish and amphibians, in which its function is essential for the survival of the larvae [11]. Because of its anatomical simplicity, the pronephros has recently emerged as an attractive model in which to study human kid-ney development and disease [12,13].
In Xenopus, the pronephric kidneys form as bilateral
excre-tory organs consisting of single nephrons [14,15]. From a structural point of view, the pronephric kidney was thought to be composed of three basic components [14,15]: the glomeru-lus (or glomus), which is the site of blood filtration; the tubules, where reabsorption of solutes occurs; and the duct, which conveys the resulting urine to the cloaca. Evidence for a more complex nephron organization of the amphibian
pronephros was provided by ultrastructural studies [16], and at the molecular level by the regionalized expression of solute transporters and ion channels along the proximodistal axis [17-21]. Based on the expression domains of nine transporter genes, a more refined model of the pronephros consisting of distinct domains and subdomains within the tubules and duct was proposed [19]. To date, however, a comprehensive model of pronephric nephron organization remains elusive. Fur-thermore, the functional correspondence of the pronephric subdomains to the nephron segments of the mammalian metanephric kidney is poorly understood. We recently pro-posed a novel model of the Xenopus pronephric kidney, which served as a basis for dissecting the roles of irx genes in nephron segmentation [22]. In the present study we provide complete molecular evidence supporting our model of the segmental organization of the pronephric nephron, we define the physiological functions associated with each nephron seg-ment, and we reveal the extensive analogies with the mamma-lian metanephric nephron.
Large-scale gene expression analysis by whole-mount in situ
hybridization in Xenopus embryos has been used successfully in the past to identify new molecular markers and has pro-vided novel insights into the molecular anatomy of embryonic patterning and regionalization [23,24]. Here, we performed a large-scale gene expression screen of the developing prone-phros with more than 240 genes encoding terminal differen-tiation markers to identify previously unappreciated compartments of the mature pronephric kidney in Xenopus. Our primary focus was on studying the expression of solute carrier (slc) gene family members, which represent - with more than 350 genes - a large portion of the transporter-related genes found in vertebrate genomes [25]. In the mam-malian kidney, cohorts of slc gene family members are expressed in a segmental manner along the nephron [26].
segments. The pronephric nephron model, together with the collection of more than 100 novel segment-specific marker genes reported here, represents an essential framework with which to dissect the molecular basis of vertebrate nephron segmentation in the Xenopus embryo model and may con-tribute to our understanding of human renal disease.
Results
Genome-wide slc gene expression analysis defines a large panel of pronephric marker genes
A genome-scale, whole-mount in situ hybridization screen was performed to evaluate the expression of solute carrier (slc) genes during Xenopus pronephric kidney development. We mined public databases to identify cDNAs encoding
Xenopus laevis slc genes. In total, 225 unique slc Xenopus
cDNAs were identified that encoded genuine orthologs of human SLC genes, based on phylogenetic analyses and syn-teny mapping (DR and AWB, unpublished data). The retrieved Xenopus slc orthologs represent 64% of all human
SLC genes (total 352).
Gene expression patterns were analyzed by whole-mount in
situ hybridization using Xenopus embryos at selected
devel-opmental stages, in accordance with the terminology estab-lished by Nieuwkoop and Faber (1956) [28]: 20 (22 hours postfertilization [hpf]), 25 (28 hpf), 29/30 (35 hpf), 35/36 (50 hpf), and 40 (66 hpf). The stages were chosen to cover the key steps of pronephric kidney organogenesis: initiation of neph-rogenesis (stage 20), onset of cellular differentiation (stage 25), maturation and terminal differentiation (stages 29/30 and 35/36), and acquisition of full excretory organ functions (stage 40; Figure 1a) [14,15].
Of the 225 slc genes identified, we detected expression of 210 genes during the embryonic stages tested, and thereof 101 genes (48%) were expressed specifically during pronephric kidney development (Figure 1b). The first evidence for prone-phric expression of slc genes was identified at stage 25, at which ten genes could be detected (Figure 1b). These included the Na-K-Cl transporter slc12a1 (nkcc2), the facilitated glu-cose transporter slc2a2 (glut2) and the amino acid transporters slc6a14, slc7a3, and slc7a7 (Additional data file
Pronephric kidney development and the global expression of slc and cldn genes Figure 1
Pronephric kidney development and the global expression of slc and cldn genes. (a) Hallmarks of pronephric kidney development in Xenopus laevis. Schematic representations of Xenopus embryos are shown with the embryonic stages and hours postfertilization (hpf), in accordance with the terminology established by Nieuwkoop and Faber [28]. Stage 12.5 and 20 embryos are dorsal views with anterior to the left. All other embryos are shown as lateral views. (b,c) Complexity of slc (panel b) and cldn (panel c) gene expression at defined stages of pronephric kidney development. The number of expressed genes at a given stage of pronephric kidney development was determined by whole-mount in situ hybridization.
12.5 (14 hpf)
40 (66 hpf) 35/36
(50 hpf) 29/30
(35 hpf) 25
(28 hpf) 20
(22 hpf)
Specification of the pronephric
anlage
Onset of nephro-genesis
Acquisition of excretory functions
(a)
(c)
(b)
Onset of cellular differentiation
Number of genes
slc genes claudin genes
Expressed genes per stage Expressed genes per stage
Number of genes
Maturation and terminal differentiation
101
0 10
65
91 89
210
Genes tested
Pronephric expression
st 20 st 25 st 29/30 st 35/36 st 40 250
200
150
100
50
0
Genes tested
Pronephric expression
st 20 st 25 st 29/30 st 35/36 st 40 0
2 4 6 8 10 12 14
13
8
0 1
5
1). By stage 29/30, expression of 65 genes - representing the majority (64%) of the slc genes tested - could be detected. This correlates well with the onset of epithelial differentiation and lumen formation [14,15]. The number of expressed slc
genes increases to 91 and 89 at stages 35/36 and 40, respec-tively (Figure 1b), as the pronephric nephron undergoes ter-minal differentiation and acquires characteristics of a functional excretory organ. Complete lists of slc genes expressed for each stage of pronephric development tested are provided in Additional data file 1.
A comprehensive model for pronephric segmentation revealed by slc gene expression mapping
Our gene expression studies indicated that all 101 slc genes exhibited spatially restricted expression patterns in the devel-oping pronephric kidney. Because slc genes encode terminal differentiation markers, we reasoned that a systematic analy-sis of the slc gene expression domains could reveal the under-lying segmental organization of the differentiated pronephric nephron.
The nephron of the stage 35/36 pronephric kidney was selected for slc gene expression mapping along the proximo-distal axis. Robust expression of most slc genes was evident by this stage, which preceded the onset of pronephric func-tions by about 3 hours. Furthermore, the stage 35/36 neph-ron retains a simple structure, lacking areas of extensive tubular convolution. It is largely a linear epithelial tube stretched out along the anteroposterior body axis. Character-istic morphological landmarks (somites, thickenings, and looped areas of the nephron) facilitate the mapping of the gene expression domains that can be performed on whole embryos without need for sectioning. A contour map of the stage 35/36 nephron was developed from embryos subjected to whole-mount in situ hybridization with fxyd2, pax2, and
wnt4 probes (see Materials and methods, below, for details).
The obtained model covered the three nephrostomes, which mark the most proximal end of the nephron, followed by three tubules, which merge to form a long-stretched duct that connects at its distal end to the cloaca. Subsequently, the expression domains of each slc gene were carefully mapped onto the stage 35/36 model nephron.
The segmental organization that emerged from slc gene expression mapping is shown in Figure 2a. It revealed a pre-viously unappreciated complexity and extends an older model reported by Zhou and Vize [19]. In addition to the nephrostomes, which connect the pronephric nephron to the coelomic cavity and the glomerular filtration apparatus, eight functionally distinct segments were defined. Cross-species gene expression comparisons were performed to delineate similarities between the Xenopus pronephric and mamma-lian metanephric nephron (see below). These studies revealed striking analogies, allowing us to adopt a nomenclature for the pronephric segments that largely follows the widely accepted one used for the mammalian metanephros [2],
which is shown in Figure 2b. The pronephric nephron of
Xenopus is composed of four basic domains: proximal tubule,
intermediate tubule, distal tubule, and connecting tubule. Each tubule may be further subdivided into distinct ments. The proximal tubule (PT) is divided into three seg-ments (PT1, PT2, and PT3), whereas the intermediate tubule (IT) and the distal tubule (DT) are both composed of two seg-ments IT1 and IT2, and DT1 and DT2, respectively. In con-trast, the connecting tubule (formerly known as pronephric duct) does not appear to be further subdivided. The molecular evidence supporting the proposed segmentation model and nomenclature are discussed in detail below.
Distribution of slc gene expression in the pronephric kidney
The complete annotation of the pronephric expression domains for each slc gene can be found in Additional data file 2. The slc gene expression domains were characterized by sharp, conserved expression boundaries, which define the limits of the segments and tubules. A given expression domain could either be confined to a single segment, com-prise an entire tubule, or spread over more than one tubule. Of the 91 slc genes analyzed for expression in the stage 35/36 pronephric kidney, we detected expression of 75 genes in the proximal tubule, 27 genes in the intermediate tubule, 24 genes in the distal tubule, and 13 genes in the connecting tubule (Additional data files 3 to 6).
Expression domains of slc genes define three segments in the proximal tubule
With 75 genes, the proximal tubules exhibited the greatest complexity of slc gene expression. This underscores their importance in reabsorbing diverse classes of solutes from the glomerular ultrafiltrate. We identified 26 genes with exclu-sive expression throughout the proximal tubule compart-ment. Among these, 18 were strongly expressed and included
slc2a2, slc3a1, slc4a7, slc5a11, slc22a5, and slc26a1 (Figure 3a and Additional data file 2). The expression domains of other slc genes revealed a further subdivision of the proximal tubule into three distinct segments (PT1, PT2, and PT3). This tripartite organization is reminiscent of mammalian proximal tubules, which are commonly subdivided into S1, S2, and S3 segments [2].
Two genes were predominantly expressed in PT1 (the most proximal segment of the proximal tubule), namely slc7a7 and
slc7a8. Low levels of expression could also be detected in PT2
data file 2). In contrast, 13 slc genes, including slc2a11 and
slc5a1, were detected in both PT2 and PT3 (Figure 3f and Additional data file 2). The molecular subdivision of the prox-imal tubule revealed by segment-specific markers is also evi-dent morphologically. Three PT1 segments connect the nephrostomes to a single PT2 segment. The adjacent distal region corresponds to PT3 and can be identified as a bulging
of the proximal tubule, which is also known as the broad or common tubule [29].
Expression of slc genes delineate the intermediate tubule as a bipartite structure
The intermediate tubule, an S-shaped structure, follows distal to the proximal tubule in the stage 35/36 pronephric nephron (Figure 2a). It is characterized molecularly by the expression of the thiamine transporter slc19a2 (Figure 4a). In addition,
slc genes with nonexclusive expression in the intermediate tubule include slc4a11, slc12a1, slc16a7, and slc25a11 (Figure 4e and Additional data file 2). For example, slc12a1 expres-sion extends into the distal tubule to include DT1 (Figure 4e). The boundaries of the intermediate tubule are also defined by
slc4a4, which was not detected in the intermediate tubule but
was prominently expressed in the flanking proximal and dis-tal tubule domains (Figure 4d).
The intermediate tubule is comprised of two segments, namely IT1 and IT2. The molecular evidence for this subdivi-sion was provided by the expressubdivi-sion of slc20a1 in the proxi-mal part (IT1) and slc5a8 in the distal part (IT2; Figure 4b,c). Although slc5a8 expression occurs also in the proximal tubules (PT2 and PT3) and in the distal tubule (DT1), the expression domain in the intermediate tubules defines une-quivocally the boundary between IT1 and IT2 (Figure 4c). The bipartite nature of the intermediate tubule is further sup-ported by the expression of irx transcription factor family members irx1, irx2, and irx3 [22].
Organization of distal and connecting tubules revealed by slc gene expression
The distal tubule occupies roughly the proximal half of the stretch-out part of the pronephric nephron (Figure 2a). To date we have failed to identify an slc gene with expression in the entire distal tubule only. However, the distal expression domain of slc16a6 comprises the entire distal tubule (Addi-tional data file 2). The distal tubule is composed of two dis-tinct segments: DT1 and DT2. Molecularly, DT1 was defined by the expression of the sodium bicarbonate transporter
slc4a4; however, this transporter also has a second
expres-sion domain in the proximal tubule (Figure 4d). In addition, several slc genes were identified that have DT1 as their most distal expression domain. These included slc4a11, slc5a8, and
slc12a1 (Figure 4c,e and Additional data file 2). DT2 was
demarcated by expression of the ammonia transporter rhcg/
slc42a3 (Figure 4f). Furthermore, slc12a3 shared DT2 as its
most proximal expression domain (Figure 4h).
The connecting tubule links the pronephric kidney to the rec-tal diverticulum and the cloaca. Two slc genes exhibited exclusive expression in this compartment, namely the sodium/calcium exchanger slc8a1 and the zinc transporter
slc30a8 (Figure 4g and Additional data file 2). To date, we
have not obtained any evidence supporting further subdivi-sion of the connecting tubule.
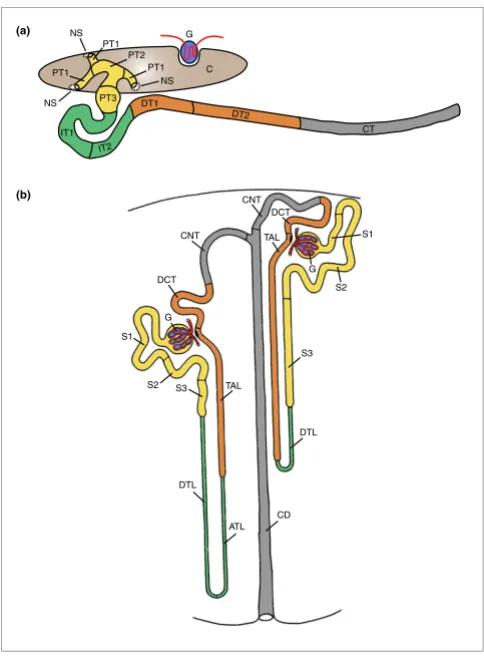
[image:5.612.54.296.84.415.2]Models of the segmental organization of the Xenopus pronephric and mammalian metanephric nephrons
Figure 2
Models of the segmental organization of the Xenopus pronephric and mammalian metanephric nephrons. The color coding of analogous nephron segments is based on the comparison of marker gene expression as shown in Figure 7. (a) Schematic representation of the stage 35/36 Xenopus pronephric kidney. The glomerular filtration apparatus (G; also known as glomus) is derived from the splanchnic layer of the intermediate mesoderm and receives blood from vessels that branch from the dorsal aorta. All other parts of the pronephric nephron are derivatives of the somatic layer of the intermediate mesoderm. On the basis of molecular markers, four distinct tubular compartments can be recognized. Each tubule may be further subdivided into distinct segments: proximal tubule (PT, yellow; PT1, PT2, and PT3), intermediate tubule (IT, green; IT1 and IT2), distal tubule (DT, orange; DT1 and DT2), and connecting tubule (CT, gray). The nephrostomes (NS) are ciliated peritoneal funnels that connect the coelomic cavity (C) to the nephron. The scheme was adapted from Reggiani and coworkers [22]. (b) Scheme depicting a short-looped and a long-looped nephron of the adult mammalian metanephric kidney. The figure was taken and adapted from Kriz and Bankir [2]. Abbreviations used for the mammalian nephron segments are as follows: ATL, ascending thin limb; CD, collecting duct; CNT, connecting tubule; DCT, distal convoluted tubule; DTL, descending thin limb; S1, S2, and S3, segments of the proximal tubule; TAL, thick ascending limb.
PT1 PT1
PT1
DT2
CT DT1
IT2
IT1 PT3
PT2
NS
NS NS
C G
(a)
(b)
G
S3 S2 S1
DTL
ATL TAL DCT
CNT CNT
TAL DCT
S3
DTL S2
S1
G
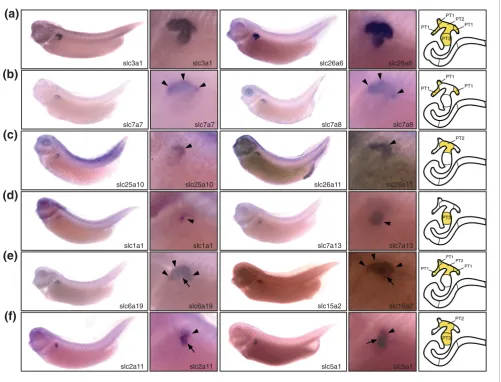
The expression domains of slc genes identify three distinct segments in the proximal tubule Figure 3
The expression domains of slc genes identify three distinct segments in the proximal tubule. Stage 35/36 Xenopus embryos were stained for marker gene expression by whole-mount in situ hybridization. For each distinct class of expression pattern obtained, lateral views of embryos stained for two representative slc genes are shown accompanied by enlargements of the pronephric region. A color-coded scheme of the nephron depicts the deduced segmental expression domains. (a) Examples of slc genes expressed in all segments of the proximal tubule. (b-d) Examples of slc genes with expression confined to proximal tubule (PT)1 (panel b), PT2 (panel c), or PT3 (panel d) alone. Arrowheads are shown to highlight specific proximal tubule segments stained. (e,f) Examples of slc genes with expression either in PT1 and PT2 (panel e) or in PT2 and PT3 (panel f). In panel e, arrowheads and arrows highlight the PT1 and PT2 segments, respectively. In panel f, arrowheads and arrows highlight the PT2 and PT3 segments, respectively. The localization of the slc7a13 expression domains has previously been reported [22]. They are shown here for comparative purposes.
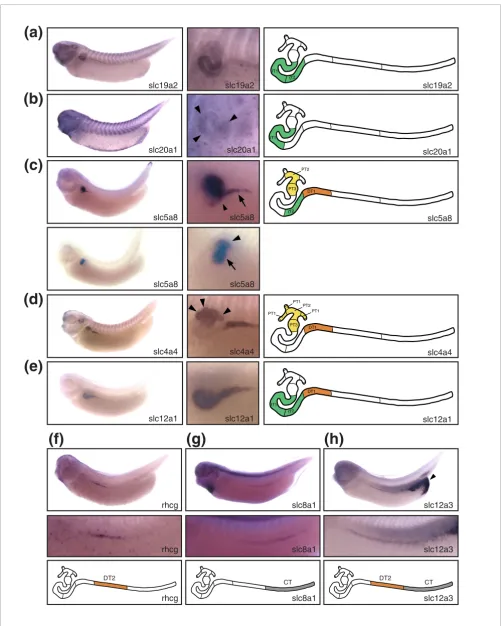
Slc gene expression defines segmentation of the intermediate, distal, and connecting tubules Figure 4 (see following page)
Slc gene expression defines segmentation of the intermediate, distal, and connecting tubules. Stage 35/36 Xenopus embryos were stained for marker gene expression by whole-mount in situ hybridization. Lateral views of stained embryos are shown accompanied by enlargements of the pronephric region and a color-coded scheme of the nephron depicting the deduced segmental expression domains. (a) slc19a2: intermediate tubule. (b) slc20a1: intermediate tubule (IT)1 (arrowheads). (c) slc5a8: proximal tubule (PT)2, PT3, IT2, and distal tubule (DT)1. In the upper panel, the embryo was stained to reveal slc5a8 expression in IT2 (arrow) and DT1 (arrowhead). The embryo shown in the lower panel was stained shorter to demonstrate expression in PT2 (arrowhead) and PT3 (arrows). (d) slc4a4: proximal tubules, DT1. Arrowheads illustrate expression in PT1. (e) slc12a1: intermediate tubule, DT1. (f) rhcg/slc42a3: DT2. (g) slc8a1: connecting tubule (CT). (h) slc12a3: DT2, CT. Note that there is also strong slc12a3 expression in the cloaca (arrowhead). The localization of the expression domains for slc12a1 and slc12a3 has previously been reported [22]. They are shown here for comparative purposes.
PT1 PT1
PT1 PT2
PT3 IT1
IT2 IT3
slc7a8 slc7a8
PT2
PT2
slc25a10 slc25a10 slc26a11 slc26a11
slc1a1 slc1a1
PT2 PT3 IT1
IT2 IT3
PT3
slc7a13 slc7a13
PT1 PT1
PT1 PT2 PT3 IT1
IT2 IT3
PT2
slc15a2 slc15a2
PT1 PT1
PT1 PT2
PT3 PT3
PT2
slc3a1 slc3a1 slc26a6 slc26a6
(a)
PT2 PT3
PT3 PT2
slc5a1 slc5a1 slc6a19
slc2a11 slc2a11
(b)
(c)
(d)
(e)
(f)
Figure 4 (see legend on previous page)
PT2 PT3 IT1
IT2 IT3
IT2
IT1
slc19a2 slc19a2
(a)
slc19a2
PT2 PT3 IT1
IT2 IT3
DT1
IT2
PT3 PT2
slc5a8 slc5a8 slc5a8
PT1 PT1
PT1 PT2 PT3 IT1
IT2 IT3
DT1 PT3
PT2
slc4a4 slc4a4 slc4a4
PT2 PT3 IT1
IT2 IT3
DT1
IT2
IT1
slc12a1 slc12a1 slc12a1
PT2 PT3 IT1
IT2 IT3
rhcg
rhcg
rhcg
PT2 PT3 IT1
IT2 IT3
slc8a1
slc8a1
PT2 PT3 IT1
IT2 IT3
slc12a3
slc12a3
PT2 PT3 IT1
IT2 IT3
IT1
slc20a1 slc20a1 slc20a1
slc8a1 slc12a3
(b)
(c)
(d)
(e)
(f)
(g)
(h)
DT2
CT DT2 CT
Validation of the pronephric segmentation model
We extended our gene expression analysis to the claudin (cldn) gene family and selected other genes to validate the proposed model of pronephric segmentation. Claudins are key components of epithelial tight junctions, where they are responsible for the selectivity and regulation of paracellular permeability [30,31]. In the mammalian kidney, several clau-din genes are expressed in segment-specific patterns along the nephron [30,32]. We profiled the claudin gene family for evidence of nephron segment-specific gene expression in
Xenopus. We retrieved 14 distinct Xenopus claudin cDNAs
from database searches, which covers 64% of the complement of 22 claudin genes typically found in vertebrate genomes. We analyzed the expression of 13 claudin genes by whole-mount
in situ hybridization and found that eight genes were
expressed in the developing pronephric kidney (Figure 1c and Additional data file 2). No pronephric expression of claudin genes was detected at stage 20. Induction of cldn6 expression occurred at stage 25, and by stage 35/36 all eight cldn genes were expressed (Figure 1c and Additional data file 1). The temporal profile of claudin gene expression during prone-phric kidney development therefore mirrors the situation reported for the slc genes (Figure 1b,c). Four cldn genes (cldn3, cldn4, cldn6, and cldn12) were expressed throughout the entire stage 35/36 nephron. In contrast, expression of the other cldn genes was highly regionalized. Interestingly, all shared expression in the intermediate tubule. The cldn8 gene had the most restricted expression, being present only in the IT2 segment (Figure 5a). Apart from the intermediate tubule, the expression domains of cldn14 and cldn16 extended dis-tally to include DT1 (Figure 5b,c). Finally, transcripts for
cldn19 were present not only in the intermediate tubule but
also in the nephrostomes (Figure 5d).
We also studied the expression of the kidney-specific chloride channel clcnk, the potassium channel kcnj1 (also known as
romk), and the calcium-binding protein calbindin 1 (calbin-din 28 kDa; calb1). Previously, we reported clcnk to be a marker of the pronephric duct [17], and more recently mapped its expression to cover the intermediate, distal, and connecting tubules [22] (Figure 5e). Expression of kcnj1 was similar to that of clcnk, with the exception that kcnj1 was not present in IT2 (Figure 5f). Finally, calb1 expression was restricted to the connecting tubule with highest expression at the distal tip (Figure 5g). Expression throughout the connect-ing tubule segment became more apparent by stage 40 (data not shown). In summary, the analysis of additional prone-phric marker genes fully supports our proposed model of pronephric nephron segmentation. For example, cldn8 and
kcnj1 expression provides further evidence for the bipartite
nature of the intermediate tubule compartment. Further-more, we failed to detect any evidence for additional subdivi-sions of the nephron other than the ones reported here.
Gene expression comparisons reveal striking analogies of nephron segmentation between pronephric and metanephric kidneys
We performed cross-species gene expression comparisons to identify similarities between the nephron organization of the
Xenopus pronephros and the mammalian metanephros. We
selected 23 marker genes with highly regionalized expression in the Xenopus pronephric kidney to compare their renal expression domains with the corresponding mammalian orthologs. As shown in Table 1, the list included 18 slc genes,
calb1, cldn8, cldn16, clcnk, and kcnj1. Information on the expression of the mammalian counterparts in either the adult mouse or rat kidney was obtained in part from the published literature (Table 2). In addition, we determined independ-ently the expression patterns for many of the selected genes by in situ hybridization analysis. Selected examples of stained adult mouse kidney sections are shown in Figure 6. We deter-mined the previously unknown renal expression domains of
Slc5a9, Slc6a13, Slc13a3, and Slc16a7 (Figure 6 and data not shown). Furthermore, we confirmed the expression domains of many others, including Slc5a2, Slc7a13, Slc8a1, Slc12a1,
Slc12a3, Cldn8, and Calb1 (Table 2, Figure 6, and data not
shown).
A comparison of the expression domains of the selected marker genes between the Xenopus pronephros and the rodent metanephros is shown schematically in Figure 7. Overall, a remarkable conservation of segmental gene expres-sion was observed. This was most striking for the proximal tubule. All 13 mammalian genes with expression in the prox-imal tubule were also expressed in the Xenopus proximal tubule. Generally, only minor differences between Xenopus
and mammalian marker genes were observed. In many cases, however, we found complete conservation of segmental expression domains. This is best illustrated by the low-affin-ity and high-affinlow-affin-ity Na-glucose transporters Slc5a2 and
Slc5a1, which are sequentially expressed along the
proximo-distal axis of the proximal tubule [33]. Slc5a2 localizes to S1 and S2 in mouse and to PT1 and PT2 in Xenopus, whereas
Slc5a1 was detected in S2 and S3, and PT2 and PT3,
respec-tively (Figure 3e,f, Figure 6a, and data not shown).
The comparison of gene expression in the intermediate tubule revealed a more complex picture. Importantly, there was clear evidence for expression of Cldn8 and Clcnk in the intermediate tubules of Xenopus and mouse. The Cldn8 gene, which in mouse is expressed in the descending thin limb, was confined to IT2 in Xenopus (Figure 5a and Figure 6g). With regard to Clcnk, the broad expression domain (IT1 → con-necting tubule) of the single Xenopus clcnk gene was comparable to the combined expression domains of Clcnka
Expression domains of selected molecular marker genes validates the pronephric segmentation model Figure 5
Expression domains of selected molecular marker genes validates the pronephric segmentation model. Whole-mount in situ hybridizations of stage 35/36 Xenopus embryos were performed. Lateral views of whole embryos (left panels), enlargements of the pronephric region (middle panels), and color-coded schematic representations of the segment-restricted expression domains (right panels) are shown. (a) cldn8: intermediate tubule (IT)2. Note that the expression levels are low. Arrowheads indicate the proximal and distal boundaries of the cldn8 expression domain. (b,d) cldn14 and cldn16: intermediate tubule, distal tubule (DT)1. (d) cldn19: nephrostomes (arrowheads), intermediate tubule. (e) clcnk: intermediate tubule, distal tubule, connecting tubule. Note that the dotted staining pattern localizes to cells of the epidermis. The localization of the clcnk expression domains has previously been reported [22] and is shown here for comparative purposes. (f) kcnj1: IT1, distal tubule, connecting tubule. The arrowhead indicates the location of IT2, which fails to express kcnj1. (g) calb1: connecting tubule. The arrowhead indicates the proximal boundary of the expression domain. Expression is highest in the most distal parts of the connecting tubule.
IT1
IT3
DT2
CT DT1
IT1
kcnj1 kcnj1
(f)
kcnj1
PT2
PT3 IT1
IT2 IT3
DT1
IT2
IT1
cldn14 cldn14 cldn14
PT2
PT3 IT1
IT2 IT3
IT2
IT1
cldn19 cldn19 cldn19
PT2
PT3 IT1
IT2 IT3
CT
calb1 calb1 calb1
(b)
(d)
PT2
PT3 IT1
IT2 IT3
DT1
IT2
IT1
cldn16 cldn16 cldn16
(c)
(g)
PT2
PT3 IT1
IT2 IT3
IT2
cldn8 cldn8 cldn8
(a)
IT1
IT2 IT3
DT2
CT DT1
IT2
IT1
clcnk clcnk
(e)
kcnj1 - whose murine counterparts are markers of the TAL (Table 2) - exhibited striking proximal expansions of their expression domains to include segments of the intermediate tubule (Figure 7).
The distal tubule in mammals can be divided structurally into two compartments: the TAL and the distal convoluted tubule
(DCT). Molecularly, it is defined by the differential expression of the Na-K-Cl transporter Slc12a1 in the TAL and the Na-Cl cotransporter Slc12a3 in the DCT (Figure 6d,e). We found that this was also the case for the Xenopus distal tubule. Note that the junctions between the slc12a1 and slc12a3 expression domains define the boundary between DT1 and DT2 (Figure 4e,h). We also noticed that the Xenopus orthologs of mouse
[image:10.612.57.555.86.563.2]Expression of selected renal marker genes in the adult mouse kidney Figure 6
Expression of selected renal marker genes in the adult mouse kidney. In situ hybridizations were performed on paraffin sections of adult kidneys taken from 12-week old mice. Whole transverse sections (upper panels) and magnifications (lower panels) are shown to illustrate marker gene expression in detail. (a) Slc5a2: proximal tubules (S1, S2). (b) Slc7a13: proximal tubules (S2, S3). (c) Slc8a1: connecting tubule. (d) Slc12a1: thick ascending limb. (e) Slc12a3: distal convoluted tubule. (f) Slc16a7: thick ascending limb, connecting tubule. (g) Cldn8: descending thin limb, connecting tubule, collecting duct. (h) Calb1: distal convoluted tubule, connecting tubule.
Slc5a2 Slc7a13 Slc8a1 Slc12a1
(e)
Slc12a3(f)
Slc16a7(g)
Cldn8(h)
Calb1TAL markers were expressed in the Xenopus DT1. When com-paring the mouse DCT with the Xenopus DT2, striking simi-larities became apparent. As mentioned above, we could demonstrate expressions of the key marker slc12a3 and of
clcnk, kcnj1, and the ammonia transporter Rhcg/Slc42a3 in DT2. However, we found one exception relating to the expres-sion of the calcium-binding protein encoded by Calb1, which is a marker of the mouse DCT and connecting tubule (Figure 6h). In Xenopus, calb1 was not expressed in DT2 but in the connecting tubule only (Figure 5g). Taken together, the Xeno-pus DT1 and DT2 are analogous to the mouse TAL and DCT, respectively.
In mouse kidney, the connecting tubule can be identified on the basis of Slc8a1 expression (Figure 6c). Interestingly, expression of Xenopus slc8a1 also defines a distinct compart-ment adjacent to the distal tubule, which we termed connect-ing tubule. As in the mouse, the Xenopus connecting tubule expresses slc16a7, calb1, clcnk, and kcnj1, which further emphasize the similarities between the connecting tubules of the pronephros and metanephros (Figure 5e-g, Figure 6f,h, and data not shown).
The Xenopus pronephric kidney lacks a nephron segment analogous to the mammalian collecting duct
We assessed Xenopus embryos for the expression of marker genes of the mammalian collecting duct. First, we analyzed three aquaporin genes, namely aqp2, aqp3, and aqp4, which are markers of principal cells in the mammalian collecting duct [34-37]. None of the tested genes were expressed in the pronephric kidney (data not shown). Subsequently, we ana-lyzed slc4a1 (AE1), a marker of type A intercalated cells of the cortical and medullary collecting ducts [38], and slc26a4
(pendrin), which is expressed in type B intercalated cells of the connecting tubule and cortical collecting duct in the adult mammalian kidney [39]. No expression could be detected in the stage 35/36 pronephric kidney (data not shown). We therefore conclude that there is presently no molecular evi-dence indicating that the stage 35/36 Xenopus pronephric kidney harbors a nephron segment that shares molecular characteristics with the mammalian collecting duct.
A public resource: XGEbase
[image:11.612.53.561.120.431.2]The present study has generated a large, unique dataset of temporal and spatial gene expression patterns. We organized these data online as a public resource in EuReGene in the
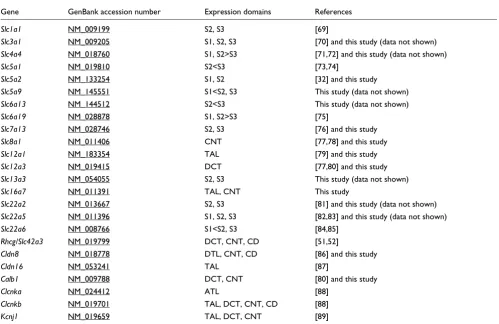
Table 1
Selected marker genes of the stage 35/36 Xenopus pronephric nephron
Gene GenBank accession number Expression domains References
slc1a1 CV079713 PT3 This study
slc3a1 BU903456 PT1, PT2, PT3 This study
slc4a4 BU905206 PT1, PT2>PT3; DT1 [19] and this study
slc5a1 CA974591 PT2<PT3 This study
slc5a2 CF520680 PT1, PT2 [22] and this study
slc5a9 CA788193 PT2, PT3 This study
slc6a13 BC060418 PT1, PT2, PT3 This study
slc6a19 BC081075 PT1, PT2 This study
slc7a13 BC060020 PT3 [22] and this study
slc8a1 BG371210 CT This study
slc12a1 BU904428 IT1, IT2, DT1 [19,22] and this study
slc12a3 CA790325 DT2, CT [22] and this study
slc13a3 BC075138 PT2, PT3 This study
slc16a7 BJ059209 IT1, IT2, DT1, DT2, CT This study
slc22a2 BC061664 PT2*, PT3* This study
slc22a5 BC056014 PT1, PT2, PT3 This study
slc22a6 BC081057 PT2, PT3 This study
rhcg/slc42a3 BC084943 DT2 This study
cldn8 DR877133 IT2 This study
cldn16 CD100665 IT1, IT2, DT1 This study
calb1 U76636 CT This study
clcnk AJ011385 IT1, IT2, DT1, DT2, CT [17,22] and this study
kcnj1 CF522101 IT1, DT1, DT2, CT This study
form of an interactive database. XGEbase [27] currently contains whole-mount in situ hybridization data on 210 slc
genes. The embryonic expression patterns are documented by more than 1,200 representative microscopic in situ hybridiza-tion images. The pronephric expression patterns are fully annotated in accordance with our model. Moreover, we also identified more than 100 genes expressed in spatially restricted patterns within other non-renal tissues such as brain, liver, and heart (DR and AWB, unpublished data). OK! Although not the explicit focus of the present study, the obtained expression patterns were fully annotated in accord-ance with the Xenopus Anatomy Ontology [40] and deposited in XGEbase. Hence, XGEbase provides not only a unique resource for future studies on pronephric kidney
develop-ment and function, but also enhances our general under-standing of organogenesis in the Xenopus model.
Discussion
Complexity of the Xenopus pronephric kidney revealed by large-scale gene expression mapping
[image:12.612.54.553.120.444.2]The pronephric nephron was until recently considered to be a simple structure composed of pronephric tubules and the pronephric duct [14,15] (Figure 8a). This apparent simplicity of the bilateral excretory organs of amphibian larvae was first recognized almost 180 years ago with the identification of the Wolffian body (Wolffschen Körper) and the associated excretory duct (Ausführungsgang) [41]. A more complex
Table 2
Selected marker genes of the adult rodent metanephric nephron
Gene GenBank accession number Expression domains References
Slc1a1 NM_009199 S2, S3 [69]
Slc3a1 NM_009205 S1, S2, S3 [70] and this study (data not shown)
Slc4a4 NM_018760 S1, S2>S3 [71,72] and this study (data not shown)
Slc5a1 NM_019810 S2<S3 [73,74]
Slc5a2 NM_133254 S1, S2 [32] and this study
Slc5a9 NM_145551 S1<S2, S3 This study (data not shown)
Slc6a13 NM_144512 S2<S3 This study (data not shown)
Slc6a19 NM_028878 S1, S2>S3 [75]
Slc7a13 NM_028746 S2, S3 [76] and this study
Slc8a1 NM_011406 CNT [77,78] and this study
Slc12a1 NM_183354 TAL [79] and this study
Slc12a3 NM_019415 DCT [77,80] and this study
Slc13a3 NM_054055 S2, S3 This study (data not shown)
Slc16a7 NM_011391 TAL, CNT This study
Slc22a2 NM_013667 S2, S3 [81] and this study (data not shown)
Slc22a5 NM_011396 S1, S2, S3 [82,83] and this study (data not shown)
Slc22a6 NM_008766 S1<S2, S3 [84,85]
Rhcg/Slc42a3 NM_019799 DCT, CNT, CD [51,52]
Cldn8 NM_018778 DTL, CNT, CD [86] and this study
Cldn16 NM_053241 TAL [87]
Calb1 NM_009788 DCT, CNT [80] and this study
Clcnka NM_024412 ATL [88]
Clcnkb NM_019701 TAL, DCT, CNT, CD [88]
Kcnj1 NM_019659 TAL, DCT, CNT [89]
ATL, ascending thin limb; CD, collecting duct; CNT, connecting tubule; DCT, distal convoluted tubule; TAL, thick ascending limb.
Expression domains of selected marker genes in the Xenopus pronephros and the rodent metanephros Figure 7 (see following page)
Figure 7 (see legend on previous page) Rodent
metanephros Proximal tubule
Intermediate
tubule Distal tubule
Collecting duct system
S1 S2 S3 DTL ATL TAL DCT CNT CD
Slc1a1 Slc3a1 Slc4a4 Slc5a1 Slc5a2 Slc5a9 Slc6a13 Slc6a19 Slc7a13 Slc8a1 Slc12a1 Slc12a3 Slc13a3 Slc16a7 Slc22a2 Slc22a5 Slc22a6 Rhcg/Slc42a3
Cldn8 Cldn16
Calb1 Clcnka Clcnkb Kcnj1 Xenopus
pronephros Proximal tubule
Intermediate
tubule Distal tubule
Connecting tubule
PT1 PT2 PT3 IT1 IT2 DT1 DT2 CT
slc1a1 slc3a1 slc4a4 slc5a1 slc5a2 slc5a9 slc6a13 slc6a19 slc7a13 slc8a1 slc12a1 slc12a3 slc13a3 slc16a7 slc22a2 slc22a5 slc22a6 rhcg/slc42a3
cldn8 cldn16
calb1 clcnk kcnj1
view emerged from a reconstruction of the larval pronephros
of Bufo viridis combined with ultrastructural examinations
[16]. Excluding the nephrostomes, the pronephric nephron was subdivided into three domains (Figure 8b): a proximal tubule composed of columnar epithelia with well developed brush borders, followed by a distal tubule with cuboidal epi-thelia, and a duct with low cylindrical epithelial cells. Based on the localized expression of nine membrane transporter genes, additional early and late subdomains of both the prox-imal and distal tubules were identified molecularly, and a terminology was adopted that was previously used for the mesonephric nephron [19] (Figure 8b). The degree of similar-ity between the nephron organization of the Xenopus prone-phros and the mammalian metaneprone-phros remains unclear, however.
Our analysis, which included more than 100 molecular marker genes, revealed an even more complex picture. Although we were able to confirm the compartment bounda-ries defined by Zhou and Vize [19], our analysis revealed three additional domains of the pronephric nephron, which had not previously been described. Further subdivisions of the early proximal tubule, the early distal tubule, and duct were recog-nized, culminating in the most comprehensive model of pronephric nephron segmentation reported to date (Figure 8c).
An evolutionary perspective on vertebrate nephron organization
Similarities between the eight distinct Xenopus pronephric nephron segments and mammalian metanephric nephron segments were established on the basis of conserved marker gene expression (Figure 7). The basic architecture of the mammalian nephron - with four main compartments (the proximal tubule, intermediate tubule, distal tubule, and col-lecting duct system) and their further subdivision - are well established on the basis of morphological criteria [2,3] (Fig-ure 2b and Fig(Fig-ure 8d). Remarkably, the expression of many marker genes in the nephron segments of the mammalian metanephros was confined to equivalent segments of the
Xenopus pronephros. On the basis of these findings, we have
redefined the molecular anatomy of the Xenopus pronephros and propose a novel nomenclature that acknowledges the striking similarities with the mammalian nephron (Figure 8c). Unlike previous models of the zebrafish and Xenopus
pronephros [16,19,42], we define an intermediate tubule compartment, identify a segment with characteristics of the distal convoluted tubule, and clarify the analogies between the pronephric duct and the mammalian collecting duct sys-tem. Our findings suggest that the basic architecture of the nephron evolved early in vertebrate evolution and that the last common ancestor of mammals and amphibians, more than 360 million years ago [43,44], must have already pos-sessed excretory organs comprised of four distinct, seg-mented tubules. Clearly, subsequent evolution has modified
[image:14.612.54.560.418.670.2]Comparison of vertebrate nephron segmentation models Figure 8
Comparison of vertebrate nephron segmentation models. Schematic representations of (a) the original model, (b) the improved model of Zhou and Vize [19], and (c) our novel model of pronephric nephron segmentation in the stage 35/36 Xenopus embryo. For comparison, (d) a simplified scheme of the model of the segmental organization of the mammalian metanephric nephron, according to Kriz and Bankir [2], is shown. The glomerulus and nephrostomes (neck segments) are not shown. Abbreviations: DE, distal early; DL, distal late; PE, proximal early; PL, proximal late. For other abbreviations, see the legends to Figure 2.
(c)
(b)
(a)
Pronephric tubule Pronephric ductProximal tubule
PL
PE DE DL Duct
Distal tubule Pronephric duct
PT1 PT2 PT3
Connecting tubule
Intermediate tubule Distal tubule
Proximal tubule
CT IT2
IT1 DT1 DT2
(d)
S1 S2 S3
CDS
Intermediate tubule Distal tubule
Proximal tubule
ATL
DTL TAL DCT CNT CD
Xenopus pronephros
this basic architecture in a species-specific manner to meet the differing physiological requirements of vertebrates resid-ing in diverse sets of habitats and environments.
The pronephric proximal tubule shares many transport activities with its metanephric counterpart
By focusing the large-scale gene expression analysis of the pronephric kidney on slc genes, we have now obtained unprecedented insights into the diversity and scope of physi-ological transport activities carried out by the pronephric kid-ney. The panel of 225 slc genes included representatives of 46
slc gene families. We found that slc genes representing 35 slc
gene families were clearly expressed in the pronephric kid-ney. Remarkably, of the more than 100 slc genes with prone-phric expression we had identified, 75 were expressed in the proximal tubule.
The mammalian proximal tubule is responsible for bulk rea-bsorption of more than 70% of the filtered solutes in the pri-mary urine, which includes ions (sodium, chloride, potassium, calcium, phosphate, and bicarbonate), vital nutri-ents (glucose and amino acids), and water. Molecular evi-dence that the proximal domains of the pronephric kidney can support some of these transport activities was reported previously [17,19,20,45]. The present study uncovers, on the basis of slc gene expression patterns, the broad scope of inferred transport activities carried out by pronephric proxi-mal tubules (Additional data file 3). We provide here evidence for the expression of transporters that mediate uptake of glu-cose (members of the slc2 and scl5 gene families), amino acids (slc1, slc3, slc7, slc17, slc36, and slc38), peptides (slc15), bicarbonate (slc4), acetyl-coenzyme A (slc33), nucleosides (slc28 and slc29), vitamins (slc19 and slc23), and metal ions (slc30, slc31, and slc39). Apart from reabsorptive activities, the mammalian proximal tubule is also the site of ammonia production and secretion of organic anions and cations. Expression of genes that encode transporters for ammonium
(rhbg/slc42a2), organic ions (slc22), and organic anions
(slco) provides compelling evidence in favor of the notion that similar activities are associated with the proximal tubules of
the Xenopus pronephros. We conclude that the proximal
tubule shares a strikingly high degree of structural and func-tional similarity with the mammalian proximal tubule.
Evidence for an intermediate tubule compartment in the pronephros
Identification of a compartment that shares molecular char-acteristics with the intermediate tubule of the metanephros represents a major, unanticipated outcome of the present study. In birds and mammals, the intermediate tubule of the metanephric kidney gives rise to the thin limbs of Henle's loop, which are required to concentrate urine [2,3,46]. In contrast, the kidneys of larval and adult amphibians do not develop loops of Henle. Their urine is hypo-osmotic to the blood plasma, and they produce very dilute urine in freshwater [4]. Consistent with these findings, the existence
of an intermediate tubule segment in the pronephric kidney had also previously been ruled out on the basis of ultrastruc-tural studies [16]. Our arguments for postulating an interme-diate tubule for the pronephros are based on molecular evidence and functional studies.
To date, only a few genes with specific expression in the thin limbs of Henle are known. These include aquaporin1 (Aqp1), the UT-A2 splice variant of the urea transporter Slc14a2, and claudin 8 (Cldn8) in the descending thin limb; and the kidney-specific chloride channel Clcnka in the ascending thin limb [47,48]. In Xenopus, the expression of slc14a2 could not be determined because no appropriate cDNA was available, and we failed to detect any pronephric expression of aqp1
(data not shown). In contrast, we were able to demonstrate
cldn8 and clcnk expression in the intermediate tubules
(Fig-ure 5a,e). Furthermore, comparative gene expression analysis recently demonstrated that Irx homeobox transcription fac-tors mark an intermediate compartment in the developing nephron of both the pronephros and the metanephros [22]. Interestingly, functional studies in Xenopus have shown that
irx3 is required for intermediate tubule formation [22].
Taken together, molecular evidence and functional studies demonstrate the existence of a patterning mechanism for intermediate tubule formation at the level of the Xenopus
pronephros. Despite sharing molecular similarities with the mammalian thin limb (cldn8 and clckn expression), the inter-mediate tubules of the Xenopus pronephric kidneys have also acquired characteristics of the distal tubule, which manifests as proximal expansion of the expression domains of the distal tubule marker genes slc12a1, slc12a6, and kcnj1 (Figure 7). It therefore appears that the intermediate tubules of the prone-phros have evolved to function in the reabsorption of salts and ions.
The Xenopus distal tubule shares similarities with the mammalian thick ascending limb and distal convoluted tubule
The mammalian distal tubule consists of two segments, TAL and DCT. The TAL remains impermeable to water and reab-sorbs up to 25% of the filtered sodium and chloride via the Na-K-Cl transporter Slc12a1. Net movement of sodium across the TAL requires the recycling of potassium via the potassium channel Kcnj1 and the transport of chloride by the kidney-specific Clcnkb [49]. The TAL is also a major site of renal magnesium reabsorption, which occurs predominantly through a paracellular pathway and requires claudin 16/para-cellin-1 (Cldn16) function [50]. Remarkably, we found that the DT1 segment of the Xenopus pronephros expresses the same set of genes mentioned above, which suggests that it is largely analogous to the TAL.
fea-ture can also be observed in the Xenopus pronephros, where the same transition defines the border between DT1 and DT2. In addition to its role in sodium chloride reabsorption, the DCT also regulates the pH by absorbing bicarbonate and it secretes protons into the urine. The expression of the bicarbo-nate transporter slc4a2 in the DT2 segment suggests that similar functions are carried out by the Xenopus pronephros. Furthermore, the highly restricted expression of rhcg/
slc42a3 indicates that the DT2 is capable of ammonium
transport similar to the DCT [52,53]. Taken together, the present molecular evidence is in line with our proposal that the DT2 is the pronephric equivalent of the DCT in the metanephros.
The pronephros harbors a simplified collecting duct system
In the mammalian metanephros, the collecting duct system is composed of the connecting tubule followed by the cortical and medullary collecting ducts. Our gene expression analysis of the pronephric kidney suggests that a single nephron seg-ment links the distal tubule to the rectal diverticulum and the cloaca. The expression of the Na-Ca exchanger slc8a1 and the calcium-binding protein calb1 indicates that this segment shares molecular characteristics with the mammalian con-necting tubule. We therefore refer to this segment of the pronephric nephron as the connecting tubule.
Despite the unexpected high degree of similarity in nephron organization, the pronephric and metanephric kidneys differ markedly in the organization of the collecting duct. We assessed the expression of several established marker genes of the mammalian collecting duct, such as slc4a1, slc26a4, and the aquaporins aqp2, aqp3, and aqp4, but we failed to detect any expression in the stage 35/36 pronephric kidney. At present, we cannot rule out the possibility that expression of these marker genes occurs only in older, more mature pronephric kidneys. In fact, when we assessed stage 40 embryos, we detected expression of the type A intercalated cell marker slc4a1 in the connecting tubule, the rectal diver-ticulum, and the cloaca; and the type B marker slc26a4 in the cloaca (DR and AWB, unpublished data). In contrast, no pronephric expression of aqp2, aqp3, and aqp4 was found. Although further analysis is still needed, these preliminary findings suggest that the maturation of intercalated cells may take place late after the onset of pronephric functions at stage 37/38.
The collecting duct system plays a major role in the final con-centration of urine [7] and is therefore the last structure of the nephron that can modify the electrolyte and fluid balance in the mammalian body. The constraints on the body's physiol-ogy are different for Xenopus tadpoles living in fresh water. They are required to conserve salts and must excrete copious amounts of diluted urine to maintain water balance [4]. It is therefore not surprising that we failed to detect any evidence for pronephric expression of aquaporins. We conclude that
the collecting duct system of pronephric kidney consists of a single nephron segment sharing similarities with the con-necting tubule.
The Xenopus pronephros as a novel model for human renal diseases
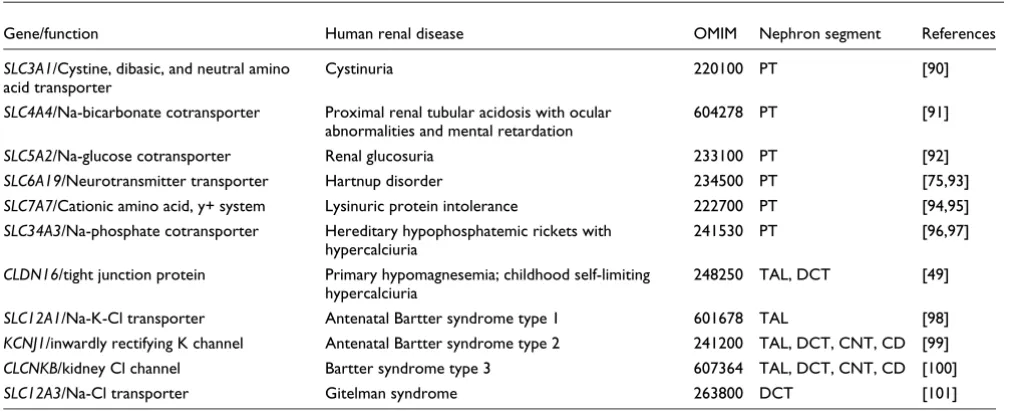
In recent years, mutations in various SLC genes and genes encoding ion channels and claudins have been discovered as the underlying causes of various forms of familial renal dis-eases in humans. The mutations impair important physiolog-ical functions that are confined to specific nephron segments, such as the proximal tubule, the TAL, and the DCT [54]. Interestingly, our large-scale gene expression analysis has now provided clear evidence that the Xenopus orthologs of at least 11 human renal disease genes were expressed in the equivalent nephron segments of the pronephric kidney (Table 3 and Additional data file 2). We therefore believe that the
Xenopus embryo may become a useful model for rapid
analy-sis of the basic molecular and regulatory processes that are involved in inherited human renal disease.
Conclusion
The present study revealed that the pronephric nephron is composed of four basic domains: proximal tubule, intermedi-ate tubule, distal tubule, and connecting tubule. These domains share at the molecular level gene signatures that are typical of the mammalian nephron, and can be further subdivided into eight functionally distinct segments. The striking structural and functional similarities between the pronephric and the metanephric nephron revealed in this study will allow us to analyze in greater detail genes involved in nephron patterning, a process that remains poorly under-stood. Moreover, gene mutations underlying human renal disease can now be analyzed in a simple and cost-effective animal model.
Materials and methods
Gene nomenclatureThe standard gene nomenclature suggested by Xenbase [55] and adopted by the National Center for Biotechnology Infor-mation for X. laevis genes is utilized rather than the original gene names to maximize compatibility with data available from other model systems. Where possible, Xenopus gene names are the same as their human orthologs.
Identification and sequencing of Xenopus cDNAs
selected human sequences were used as protein queries in TBLASTN searches, which compare a protein sequence with the six-frame translations of a nucleotide database. Where more than one Xenopus cDNA sequence was retrieved, the cDNA encoding the longest open reading frame was selected for further analysis. Phylogeny and conservation of gene syn-teny were used as criteria for establishing the orthology of the selected Xenopus genes with the human counterparts. A full account of the database screens, synteny comparisons, and phylogenetic analyses will be published elsewhere (DR and AWB, unpublished data).
The X. laevis cDNAs were obtained from the German
Resource Center for Genome Research RZPD/ImaGenes or the National Institute for Basic Biology (NIBB) in Japan. The cDNAs were obtained either as sequence-verified clones directly from RZPD/ImaGenes or sequenced in-house using the BigDye Terminator v3.1 Cycle Sequencing Kit (Applied Biosystems) and the 3130 Genetic Analyzer (Applied Biosys-tems, Foster City, CA, USA) DNA sequencer.
Xenopus embryo manipulations and in situ hybridization
In vitro fertilization, culture, and staging of Xenopus
embryos were performed as described [58,59,28]. Whole-mount in situ hybridizations and bleaching of stained Xeno-pus embryos were carried out using established protocols [59-61]. All pre-hybridization and post-hybridization washes were performed in nylon mesh baskets using a BioLane HTI
in situ hybridization machine (Holle & Hüttner AG,
Tübin-gen, Germany). For probe hybridization, the baskets with embryos were transferred to 15 ml Falcon tubes and hybridi-zations were performed in a water bath. Templates for cRNA probe synthesis were either plasmids linearized by restriction
enzyme digestion or PCR products of the cDNA inserts gener-ated by amplification with the appropriate T3, T7, or SP6 primers. Inserts cloned into the pDNRLib vector were ampli-fied by PCR using the following primers: pDNRlib lower: 5'-GTC TAG AAA GCT TCT CGA GGG-3'; and pDNRlib upper: 5'-GGA CAT ATG CCC GGG AAT TCG GCC-3'. The resulting PCR products were subcloned into the pGEM-T Easy vector (Promega, Madison, WI, USA), in accordance with the pGEM-T Easy Vector System I protocol. Digoxigenin-labeled cRNA probes were either transcribed from linearized plas-mids or made directly from PCR products using T7, T3, or SP6 polymerases (Roche, Basel, Switzerland). Sense strand controls were prepared from all plasmids and tested by in situ
hybridization. The GenBank accession numbers of the cDNAs used for in situ hybridization are given in Additional data file 2. The GenBank accession numbers for the Xenopus
aquaporin cDNAs are as follows: aqp1 (CD302300), aqp2
(AY151156), aqp3 (CA9711164), and aqp4 (BG515560). For each reported gene, at least 40 embryos were examined.
Contour model of the pronephric nephron and marker gene mapping
A first schematic representation of the contour of the stage 35/36 nephron was developed from Xenopus embryos stained by standard single-color whole-mount in situ hybrid-ization with a combination of digoxigenin-labeled probes for the pronephric marker genes fxyd2 [45], pax2 [62], and wnt4
[image:17.612.53.561.115.321.2][61]. Two dozen stained embryos were inspected to generate a two-dimensional contour drawing of the nephron onto paper. Refinements to the initial contour model were made after inspection of hundreds of embryos stained with other pronephric marker genes. The final contour model of the nephron shown in Figure 2a was made with Illustrator CS2 (Adobe, San Jose, CA, USA).
Table 3
Human renal disease genes that have Xenopus orthologs expressed in the pronephric kidney
Gene/function Human renal disease OMIM Nephron segment References
SLC3A1/Cystine, dibasic, and neutral amino acid transporter
Cystinuria 220100 PT [90]
SLC4A4/Na-bicarbonate cotransporter Proximal renal tubular acidosis with ocular
abnormalities and mental retardation
604278 PT [91]
SLC5A2/Na-glucose cotransporter Renal glucosuria 233100 PT [92]
SLC6A19/Neurotransmitter transporter Hartnup disorder 234500 PT [75,93]
SLC7A7/Cationic amino acid, y+ system Lysinuric protein intolerance 222700 PT [94,95]
SLC34A3/Na-phosphate cotransporter Hereditary hypophosphatemic rickets with
hypercalciuria
241530 PT [96,97]
CLDN16/tight junction protein Primary hypomagnesemia; childhood self-limiting
hypercalciuria
248250 TAL, DCT [49]
SLC12A1/Na-K-Cl transporter Antenatal Bartter syndrome type 1 601678 TAL [98]
KCNJ1/inwardly rectifying K channel Antenatal Bartter syndrome type 2 241200 TAL, DCT, CNT, CD [99]
CLCNKB/kidney Cl channel Bartter syndrome type 3 607364 TAL, DCT, CNT, CD [100]
SLC12A3/Na-Cl transporter Gitelman syndrome 263800 DCT [101]
The pronephric expression patterns of the marker genes were projected onto the contour model to define the segments of the nephron. Unambiguous morphological features, such as the nephrostomes, a characteristically broad proximal tubule domain known as common tubule [29] (subsequently named PT3) and the looped part of the pronephric nephron (IT1, IT2, and DT1) were used as landmarks to identify the relative loca-tion of the boundaries of the expression domains. The final borders between the nephron segments are defined by the boundaries of multiple marker genes.
Murine tissue preparation
Kidneys of male adult C57BL/6J mice were collected in ice-cold phosphate-buffered saline and subsequently transferred into 4% paraformaldehyde for fixation at 4°C for at least 3 days. The kidneys were dehydrated in an ethanol series and passed through xylene into paraffin with each step lasting a full day. Paraffinized kidneys were sectioned in transversal orientation at 8 nm thickness using a Leica RM 2165 micro-tome (Leica, Wetzlar, Germany). Sections were deparaffin-ized in X-tra-Solve (Medite Histotechnik, Burgdorf, Germany), rehydrated, and then treated according to the pro-tocol for fixation and acetylation of fresh frozen sections as reported by Yaylaoglu and coworkers [63].
Murine in situ hybridization
Mouse cDNAs for Slc5a1 and Cldn8 were kindly provided by Alexandre Reymond (University of Geneva, Geneva, Switzer-land). Slc7a13 and Kcnj1 cDNAs were obtained from RZPD/ ImaGenes. Clone-derived template sequences were amplified by PCR using standard primers for T7 and SP6. PCR products were sequence verified and directly used for in vitro tran-scription. Templates for all other genes were generated by PCR from a cDNA pool representing a variety of embryonic and postembryonic tissues, as described previously [63]. The primers consisted of 25 nucleotides of gene-specific sequence linked to SP6, T3, or T7 polymerase promoter sites. Specific primer sequences for the individual genes can be obtained from the GenePaint database [64].
Riboprobe synthesis and robotic in situ hybridization were carried out using established protocols [63]. The in situ
hybridization protocol includes a tyramine-biotin amplifica-tion reacamplifica-tion step. The protocol was adjusted for adult kidney paraffin sections by increasing the proteinase K concentra-tion to 10 mg/ml, using a probe concentraconcentra-tion of 300 ng/ml, and increasing the time of color reaction to three times 12 minutes.
Photography and computer graphics
For Xenopus, photographs of stained embryos were taken
digitally with an AxioCam Colour camera mounted on a Zeiss SteREO Lumar V12 stereoscopic microscope using the Axio Vision 4.5 (Zeiss, Feldbach, Switzerland) software. Image processing was carried out using Adobe Photoshop CS2 and
Adobe InDesign CS2 software. Schematic figures were drawn using Adobe Illustrator CS2.
Stained slides of mouse kidney sections were scanned using a Leica DM-RXA2 microscope equipped with the Leica elec-tronic focusing system and a motorized stage (Märzhäuser, Wetzlar-Steindorf, Germany). Brightfield images were col-lected with a CCD camera (Hitachi, Tokyo, Japan) and a 10× objective (NA 0.40; Leica). Custom-made software was used to drive stage and camera [65]. The kidney sections were too large to be photographed as a whole. Therefore, multiple images were taken. Each image was stored as a bitmap file and individual images were assembled into a mosaic image that was cropped, properly oriented, and saved as a TIFF file. The resulting TIFF images with a resolution of 1.6 μm/pixel were deposited in the GenePaint database along with meta-data such as specimen, gene name, and probe sequence.
Informatics resources
The programming underlying the XGEbase web resource fol-lows a classical three-tier architecture. The first tier is a web-based user interface providing an access point for users to browse gene expression patterns in the developing pronephros. The second tier is the application layer, which is responsible for process management tasks. It is implemented using Java and Java Server Faces (JSF) technologies. It receives parameters from the client's machine to query the core database and return dynamically generated web pages based on the values retrieved from the database. The third tier is the database management system (DBMS) and core database. The DBMS is responsible for creation, mainte-nance, and interrogation of data stored in the database. The application layer communicates with this layer in order to retrieve specific data. A MySQL relational DBMS (version 5.0.4) [66] has been used to implement this layer.
In XGEbase, the pronephric expression patterns are fully annotated in accordance with the nephron segmentation model (Figure 2a), and the strength of the in situ hybridiza-tion signal is given for each anatomical structure. Important meta-data, including GenBank accession numbers, in situ