How To Identify UK Housing Bubbles
A Decision Support Model
CHARALAMBOS PITROS
The School of the Built Environment, University of Salford, UK
Submitted for the requirements of the Degree of
Acknowledgements
I am deeply indebted to my supervisor Dr. Yusuf Arayici for his fundamental role in my doctoral work. He offered me with this opportunity to get my research career started and carried me through in these years. Yusuf provided me with every bit of guidance and help that I needed during my research. He also gave me the freedom to think clearly while at the same time continuing to contribute valuable feedback and advice. I quite simply cannot imagine a better supervisor.
I would like also to express my appreciation to my family and my Father particularly for their love, support, and sacrifices. Without them, this thesis would never have been written. A special thanks goes to Cyprus state scholarship foundation for providing me with a valuable funding.
Table of Contents
Chapter 1 ... 1
1.0 Introduction ... 1
1.1 Bubble views ... 6
1.2 Types of bubbles ... 7
1.3 What type of bubble the study aims to examine/identify? ... 8
1.4 Historical bubble events: The real world ... 9
1.5 Significance and intended contribution of the study ... 10
1.6 Research aim and objectives ... 11
1.6.1 Aim of the research ... 11
1.6.2 What kind of model does the study aim to develop? ... 11
1.6.3 Objectives ... 12
1.7 Research Outline ... 13
Chapter 2 ... 15
2.0 Real Estate Cycle and Housing Market ... 15
2.1 Theoretical foundations of property cycles (Part A) ... 15
2.1.1 The significance of real estate cycles ... 15
2.1.2 The relevance of real estate cycles ... 16
2.1.3 Describing and defining real estate cycles ... 16
2.1.4 The phases of cycles ... 17
2.1.5 Theories of property cycles ... 18
2.1.6 Cycles and bubbles - their relationship ... 21
2.2 Historical analysis of UK housing cycles and the evolution of the UK property market (Part B) ... 22
2.2.1 The UK property market prior to the Second World War ... 22
2.2.2 The UK property market during wartime and the immediate post-WWII period ... 23
2.2.3 The UK’s first modern development boom of the 1950s and 1960s ... 26
2.2.4 The 1970s Cycle ... 28
2.2.5 The 1980s Cycle ... 35
2.2.6 The 1990s cycle ... 37
2.3 Empirical analysis of UK housing cycles (Part C) ... 39
2.3.1 Overview of UK property cycles (literature) ... 39
2.3.2 Methodology and Data ... 40
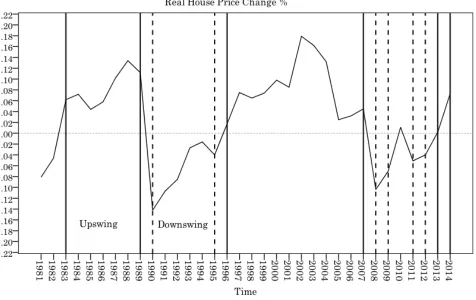
2.3.3 UK house price empirical cycle ... 42
2.3.4 UK housing affordability empirical cycle ... 44
2.3.5 A comparison of UK housing cycles ... 48
2.3.6 Synopsis of the empirical analysis of the UK housing cycles ... 51
Chapter 3 ... 53
3.0 Housing Bubbles and the Historical Review ... 53
3.1 Bubble definitions ... 53
3.2 Describing housing bubbles ... 55
3.3 Historical Examples ... 57
3.3.1 Tulip Bubble – 1630s ... 57
3.3.2 South Sea Bubble – 1720s (1719-1720) ... 57
3.3.3 British Railway Bubble – 1840s ... 59
3.3.4 Stock bubble – 1920s ... 60
3.3.5 Florida Real Estate Bubble – 1920s – ‘‘The Riviera of America’’ ... 61
3.3.6 Dot.Com Bubble – 1997-2000 ... 62
3.3.7 1970s (1971-1973) ... 63
3.4 Bubble Views ... 64
3.4.1 Chicago school of economic thought: Bubbles do not exist ... 64
3.4.2 Critiques of the Chicago school and the EMH: Bubbles may exist ... 66
3.4.3 Keynesianism and behavioural economics: Bubbles do exist ... 67
3.5 Bubble concepts ... 70
3.6 The expectation and speculation parameter ... 71
3.6.1 Expectations ... 71
3.6.2 Speculation ... 72
3.7 What creates a real estate bubble? ... 75
3.8 Why housing bubbles recur ... 79
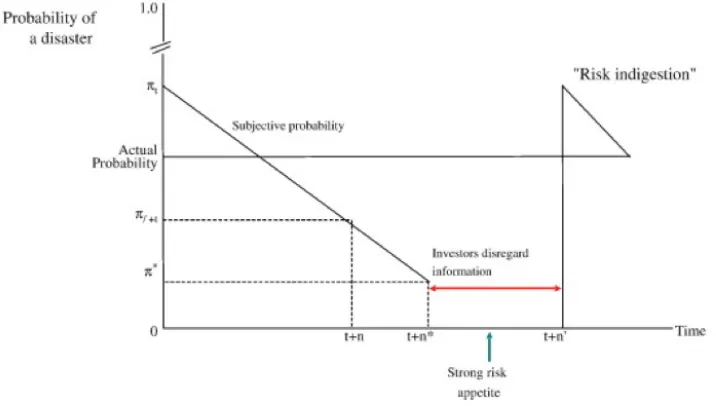
3.8.1 The role of disaster myopia ... 79
3.8.2 The role of perverse incentives ... 82
3.9 How does a housing bubble end? ... 84
3.10 Why does real estate crashes last so long? ... 84
Chapter 4 ... 87
4.0 State of the Art: Approaches for housing bubble detection ... 87
4.1 Housing bubbles as a market challenge ... 87
4.2 General overview of the approaches ... 89
4.3 The debate in housing bubble detection ... 90
4.4 The main housing bubble detection methods ... 95
4.4.1 Descriptive approach ... 95
4.4.2 Behavioural-Survey approach ... 98
4.4.3 Fundamental value modelling (single equation) ... 99
4.5 Gaps in the current housing bubble models ... 108
Chapter 5 ... 110
5.0 Research Methodology and Data ... 110
5.1 Theoretical level ... 110
5.1.1 Research philosophy ... 110
5.1.2 Research approach ... 112
5.1.3 Research design and strategy ... 115
5.2 Technical level ... 118
5.2.1 Research process ... 119
5.3 Data ... 123
5.3.1 Rationale for choosing the selected variables ... 124
5.4 What variables have been neglected in this study? Why? ... 129
5.4.1 Base Rates ... 129
5.4.2 GDP (Gross Domestic Product) ... 130
5.4.3 House-Price-to-Rent Ratio ... 130
Chapter 6 ... 132
6.0 Bubble case studies in the recent UK housing market ... 132
6.1 Bubble case studies: A historical perspective ... 132
6.1.1 1986-1989 UK property bubble ... 132
6.1.2 2000s-The first housing bubble of the 21st century in the UK ... 134
6.2 Bubble case studies: An empirical perspective ... 135
6.2.1 Descriptive Analysis ... 135
6.2.2 Correlation Analysis ... 137
6.2.3 Theoretical validity of the Correlation results ... 139
6.3 Can housing price-rate-of-change explain the presence of bubbles alone ... 140
6.4 UK housing bubbles and UK housing cycles ... 141
Chapter 7 ... 143
7.0 Development of the Model ... 143
7.1 Identification and verification of the variables ... 143
7.1.1 Mean analysis ... 145
7.1.2 Normality test ... 147
7.1.3 Descriptive statistics and traditional bootstrapping ... 147
7.1.4 Control Limits (Skewhart Charts) ... 149
7.1.5 Correlation Analysis (Natural Log-Transformed Data) ... 151
7.2.1 Hierarchy of variables ... 152
7.2.2 Specific time frame of analysis ... 156
7.2.3 Data transformation and measurement processes ... 156
7.2.4 The main multiplier of the model ... 158
7.3 Identification of the model diagnostic rule ... 160
7.3.1 The approach ... 160
7.3.2 Selected observations ... 160
7.3.3 Bias-corrected and accelerated bootstrap ... 161
7.3.4 Reasoning for selecting BCa ... 162
7.3.5 Model diagnostic rule ... 163
7.4 The model ... 163
7.4.1 Theoretical framework and the fundamental hypothesis of the model ... 165
Chapter 8 ... 167
8.0 Tests and validation of the model on the UK case studies ... 167
8.1 The reasoning behind the tests ... 167
8.2 The results ... 168
8.3 Results of past tests on UK housing bubbles ... 171
Chapter 9 ... 175
9.0 Conclusion ... 175
9.1 Research objectives achieved ... 175
9.2 The main research findings ... 177
9.3 Contribution to Knowledge ... 178
9.4 The advantages of the proposed bubble model ... 180
9.5 Limitations of the proposed bubble model ... 184
9.6 Recommendations ... 185
9.7 Summary ... 191
9.8 References ... 192
List of Figures
Figure 1. UK real house price changes between 1980 and 2014 ... 43
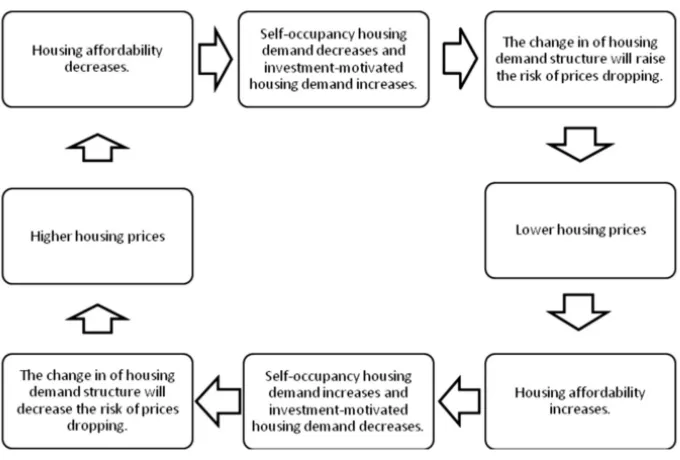
Figure 2. Tsai’s (2013) self-correction pattern in house prices ... 45
Figure 3. UK HP to earnings ratio, changes in %, between 1980 and 2014 ... 47
Figure 4. House price and housing affordability: cycle comparison ... 49
Figure 5. The disaster myopia hypothesis ... 80
Figure 6. Deductive and Inductive Approaches ... 114
Figure 7. Stages of the research process ... 119
Figure 8. Verification and validation process for the bubble model ... 122
Figure 9. UK housing bubble case studies: 1986-89 and 1990-bust vs. 2002-07 and 2008-bust ... 136
Figure 10. UK housing cycles and housing bubbles ... 142
Figure 11. Verification process of inputs ... 145
Figure 12. Graphical representation of the variables’ performance and their mean values .. 146
Figure 13. Control limits formula ... 149
Figure 14. Control Charts ... 150
List of Tables
Table 1. Historical Bubble Events ... 9
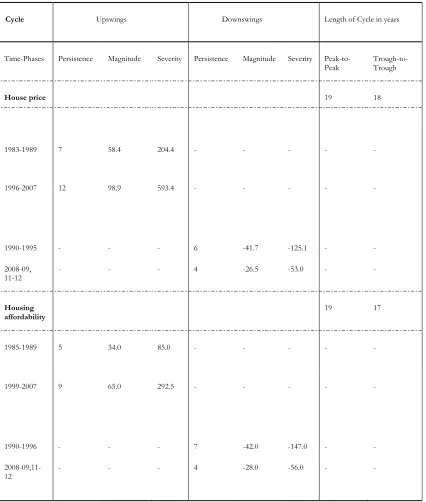
Table 2. Upswings in UK real house prices ... 43
Table 3. Downswings in UK real house prices ... 43
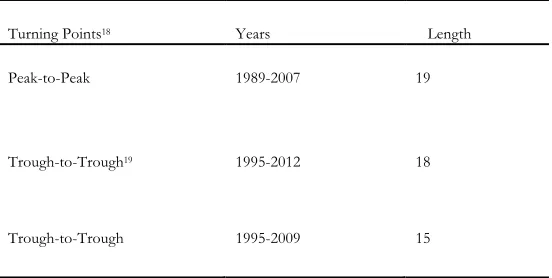
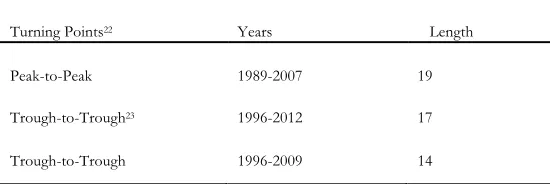
Table 4. Duration of UK housing cycles in years ... 44
Table 5. Upswings in HPE ... 47
Table 6. Downswings in HPE ... 47
Table 7. Duration of the UK housing affordability cycle ... 48
Table 8. House price cycle vs. housing affordability cycle – A large-scale comparison ... 50
Table 9. Data description ... 123
Table 10. Official Bank Rate of The Bank of England, house price inflation rate and Historic Composite Price Index, Selected Periods 1986-1988, 2002-2004 ... 129
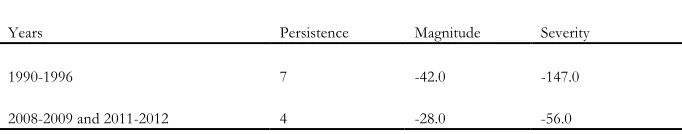
Table 11. Persistence-Magnitude and Severity of UK bubble case studies ... 136
Table 12. Correlations between house prices and other variables during various durations 138 Table 13. Long-term changes (%) in nominal UK house prices over the period of 1984-2011 ... 141
Table 14. Data description ... 144
Table 15. ‘Big picture’ of the data: Year-over-year percentage change between 1983 and 2011 and z-scores ... 144
Table 16. Normality test ... 147
Table 17. Descriptive Statistics and Bootstrapping ... 148
Table 18. Correlations between house prices and other variables in various durations ... 151
Table 19. Analysis of hierarchy results ... 155
Table 20. Weight approximation for selected variables ... 155
Table 21. HP/I ratio 1984-2011 – nominal values ... 159
Table 22. Statistics for model diagnostic rule ... 163
List of Abbreviations
(AUC) Area Under the Economic Curve
(BCA) Bias Corrected and Accelerated Bootstrapping (BF) Behavioral Finance
(D/B) Debt-Burden Ratio
(DDM) Dividend Discount Model (EMH) Efficient Market Hypothesis (ERM) Exchange Rate Mechanism (EV) Event Validity
(FLS) Funding for Lending Scheme (FV) fundamental value
(GDP) Gross Domestic Product (HDV) Historical Data Validation (HP) House Price
(HP/I) House Price to Income (HPE) House Price to Earning Ratio (LCI) Lower Confidence Internal (LPPL) Log-Periodic Power Law (MAP) Median Asking prices (NOI) Net Operating Income
(OECD) Organization for Economic Co-operation and Development (OLS) Ordinary least squares
(PP) Peak to peak
(RICS) Royal Institution of Chartered Surveyors (RPI) Retail Price Index
(SCP) Self-Correction Pattern (SE) Single Equation
(SLS) Special Liquidity Scheme (TT) Trough to Trough
Abstract
Purpose -The purpose of this thesis is to provide a decision support model for the early diagnosis of housing bubbles in the UK during the phenomenon’s maturity process.
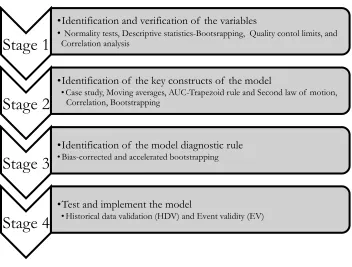
Methodology - The development process of the model is divided into four stages. These stages are driven by the normal distribution theorem coupled with the case study approach. The application of normal distribution theory is allowed through the usage of several parametric tools. An empirical application of the model is conducted using UK housing market data for the period of 1983-2011; and by placing particular emphasis on the last two UK housing bubble case studies, 1986 to 1989 and 2001/2 to 2007. The central hypothesis of the model is that during housing bubbles, all speculative activities of market participants follow an approximate synchronisation.
Findings - The new algorithmic approach successfully identifies the well-known historical UK bubble episodes over the period of 1983-2011. The proposed algorithm acts like an index or a thermometer to gauge the ‘‘fever’’ of a housing bubble in the UK at any point in time. In this approach, the housing bubble is no longer invisible until the crash, and as such can be monitored over time. The study further determines that for uncovering housing bubbles in the UK, house price changes have the same weight as the debt-burden ratio when their velocity is positive. The application of this model-algorithm has led us to conclude that the model’s outputs fluctuate approximately in line with phases of the UK real estate cycle. Finally, the research has provided a new and more technical definition of housing bubbles. The phenomenon is defined as a situation in which all speculative activities of market participants 1 achieve an approximate synchronisation.
Consequently, under such regime, the model expects that (during housing bubbles) an irrational, synchronised and periodic increase in a wide range of relevant variables must occur to anticipate a bubble component. In this definition, the relevant variables are those that exhibit a periodic and irrational acceleration in the rate of change, which, in turn, is synchronised with other relevant variables. Therefore, the model views such variables as symptoms for identifying housing bubbles.
Originality/Value - This thesis proposes a new measure for studying the presence of irrational housing bubbles. This measure is not simply an ex post detection technique but employs dating algorithms that use data only up to the point of analysis for an on-going bubble assessment, giving an early warning diagnostic that can assist market participants and regulators in market monitoring.
1
Chapter 1
1.0 Introduction
There are many questions that vex researchers studying housing markets. Identifying a bubble is always a timely question in the academic world (Hunter, Kaufman, & Pomerleano, 2005). With crashes occurring more and more frequently in real estate markets, research attention on the topic of bubbles and on the question of how to identify housing bubbles has been gradually increasing. Particularly, following the recent financial crisis, the effect of housing bubbles on Western financial systems has become the centre of attention, since on the macroeconomic level, the burst of a housing bubble can send the overall economy into recession and depression. Underpinning such attention, several studies have underlined the macroeconomic and banking after-effects of the housing bubble-burst phenomenon (Panagopoulos & Vlamis, 2009; Reinhart & Rogoff, 2009; Kaminsky & Reinhart, 1999). In addition, while housing bubble-busts are less frequent than stock market bubble busts, they last twice as long and their effects are twice as large in terms of GDP loss (Jowsey, 2011). Brocker and Hanes (2014) and Hlaváček and Komárek (2009) emphasise that the bursting of housing bubbles has a greater effect on the subsequent recovery of the economy than a stock market collapse, and that banks face greater exposure to residential markets than to equity markets. For Holcombe and Powel (2009), nothing better illustrates governmental failure than the housing bubble phenomenon.
al., 2005 p. 27) mentioned in 2001 that a housing bubble is “a name we assign to events that we cannot explain with standard hypotheses. After the event, we may rule out some explanations that appeared plausible earlier, but we are unlikely to exclude all alternatives except the bubble explanation.”
The first modern housing bubble, which took place between the mid to late 1980s in some Western economies like the US, Canada and the UK, have led institutions and property researchers to pursue the development of predictive tools. As a result, substantial progress in property research and forecasting has occurred with the development of several econometric models that predict the movements of prices, and/or identify housing bubbles or an impending crash (McDonald, 2002, Harris & Cundell, 1995). However, since then, the development of these models and the field of housing bubbles in particular have been dominated by the rational bubble theory. Discussion regarding investors’ irrationality has virtually disappeared. The vast amount of literature on rational bubbles has approached the ‘‘question’’ of how to identify/measure a housing bubble using some sort of fundamental value method. The most popular is the present value approach and the equilibrium models. (Mayer, 2011; Smith & Smith, 2006). Occasionally, fundamental analysts have also attempted to identify/measure housing bubbles using a regression-based method that compares actual housing prices with what house prices should be based on a model of fundamentals. However, such conventional bubble tests stand on two broad limitations, which in turn affect the reliability of their outcome. The overall critiques of the existing bubble measures are presented in detail in Chapter 4.0.
First limitation – Modelling and Interpreting Fundamental Value
decades, the limitations of fundamental value methods have became increasingly obvious via several empirical studies (Orrel & McSharry, 2009).
Glaeser and Gyourko (2007), Krainer and Wei (2004) and Stiglitz (1990) have identified a number of potential concerns about the comparison of housing prices using the fundamental value approach of present discounted value of rent. Moreover, as Case and Shiller (1989) p.135 state, “We see no way of obtaining an accurate historical time series on implicit rents (i.e. cash flows) of owner-occupied homes.” Similarly, for regression-based models, Shiller (1992) raises the difficulty of applying a fundamental value model to the housing market, in which price determinants are far more complicated than they are for other assets. Smith and Smith (2006) also found empirically that fundamental value models, when used to gauge a housing bubble, are inherently flawed. They also found that fundamental values in housing markets are highly nonlinear functions of many variables, and thus regression-based models are likely to be specified incorrectly.
Second limitation – Rational Expectations
When applying fundamental value models to bubble problems, economists are also bound to assume that the market is dominated by a large number of rational people who base their investment decisions on rational expectations. A rational expectation assumes that participants in the housing market make optimal use of the information and make decisions using rational rules (Diappi, 2013). The idea that participants in housing markets are so calculating and willing to take into account any new investment information has been consistently challenged and disproved by the influential work of Case and Shiller (2003, 1989, 1988). They found that the housing market paints a very different picture and concluded that real estate markets are far from rational, as they are populated by amateurs who make infrequent transactions on the basis of limited information and with no serious experience in gauging the fundamental value of the houses they are trading. Keynes (1936, p.156) also explained that asset markets operate in an environment in which market participants may not be governed by an objective view of fundamentals but by “what average opinion expects the average opinion to be.’’ In addition, Krugman (2009), in one of his most notable articles, asserts that the widespread belief that markets are efficient and rationally constructed blinded many if not most economists to the emergence of the biggest financial bubble in history. Meltzer (2002, pp.2-3) also mentions that ‘‘at this stage in the development of economic theory, we must regard the rational bubble hypothesis as devoid of empirical content, or empty. The main reasons are that we do not observe expectations, and we cannot exclude other, entirely rational, non-bubble, alternative explanations of prices. I believe it is for these reasons that attempts to test the rational bubble hypothesis have not produced compelling evidence.’’
representing housing prices, which raises my second concern of whether housing prices should be the central variable in identifying housing bubbles2.
Nevertheless, despite the success of Case and Shiller’s (2003) survey method in terms of detecting bubbles and explaining reality, surveys have only been found to be useful when comparable surveys from previous bubble case studies are available. Moreover, surveys are subject to serious inherent limitations that are often relevant to qualitative research (Popper, 1959). This is the third concern that the present study takes into account. The demand for more empirical, quantitative evidence of bubbles calls for the development of new techniques for identifying the magnitude of bubbles. Perhaps, there is a need to change the kinds of questions we ask. Instead of trying to predict changes in prices and the future of housing markets to explain bubbles, we should focus on developing models that better understand the bubble system as a whole. In support of this viewpoint and to the best of my knowledge, the studies of Mayer (2011), Agnello and Schuknecht (2011), and Orrel and McSharry (2009) have been the only three to point out the need for and significance of developing models that help in the diagnosis of housing bubbles rather in than their prediction. If the bubble component of the housing market can be identified and measured appropriately, it will significantly aid market participants and households in reducing their exposure to unnecessary risks, thus reducing stress in residential property markets.
My idea (for the development of the model) came from searching for a collection of several anomalies generated in the housing market. This search was based on the irrational view of bubbles and on the main hypothesis of the study (presented in the research methodology chapter). It is hoped that the success of this fresh idea will provide a new approach for researching housing bubbles, in that it will not only bridge the existing survey-based techniques and quantitative measurements of bubbles, but will also provide both a new definition of the phenomenon and a new practical approach that can further the research in the field of housing bubble detection.
1.1
Bubble views
Asset bubbles are one of the topics most debated between economists. The controversy is central in certain schools of economic thought. Principally, there are three official views on bubbles: the view of Chicago school, the view of Keynesians and proponents of behavioural economics, and the view of Austrian economic school.
The Chicago school and the proponents of the efficient market hypothesis (EMH) deny the existence of bubbles. They claim that all asset prices (i.e. stocks, houses) are equal to the discounted value of their rationally expected dividend payment streams. This incorporates many factors such as volatility and all risks. Under this proposition, adherents of the Chicago School and the EMH consider that asset prices are always correctly priced (i.e. they reflect all available information). As a result, bubbles are impossible events. Supporters of this view also tend to deny a connection between excessive speculation and subsequent crises within markets (Kettel, 2002; Orrel & McSharry, 2009; Dreman, 2011; Kaul, 2014; French, 2013 and Fama, 1970, 1976). However, during the early 1980s, a growing disproval of the EMH seems to have been started with the pioneering study of Shiller (1981, 1989) on the excess volatility of financial markets, which challenged the orthodoxy that economic models must always assume rational expectations by all economic agents. Concerning housing markets, Case and Shiller (2003, 1989, 1988) found that housing markets paint a very different picture from what EMH holds and that bubbles may exist. They concluded that real estate markets are driven largely by expectations based on past price movements rather than on any knowledge of fundamentals and that market participants are far from rational. After nearly three decades of research, the study of investor behaviour within asset markets eventually resulted in the creation of behavioural finance (BF); an opposing theory to the EMH. Since then, researchers have paid much attention to bubble issues and have appreciated the presence of bubbles in asset markets. This shift could be described as the birth of the modern bubble literature.
driven by expectations about what other investors think everyone else think, rather than expectations about the fundamental profitability of an investment. Keynes (1936, pp.161-162) further accepted that ‘‘there is the instability due to the characteristics of human nature that a large proportion of our positive activities depend on spontaneous optimism rather than on mathematical expectation, whether moral or hedonistic or economic. Most, probably, of our decisions to do something positive … can only be taken as a result of animal spirit.’’ Here, animal spirit refers to the tendency of asset prices to rise and fall (or economic decisions to be formed) based on human emotions and herd behaviour (irrationally) rather than on intrinsic value. Generally, Keynesians and proponents of behavioural economics argue that bubbles exist because of psychological factors.
The third view is that of the Austrian school, which also sees bubbles as real phenomena. The Austrian school argues that a bubble is the product of a government’s failure to manage the money supply and interest rates in an optimal and rational manner. Proponents further claim that as long as central banks retain their authority to set controls on interest rates, such bubbles will periodically appear in the economy. The Austrian school sees bubbles as a combination of both real and psychological changes caused by manipulations of monetary policy. While behavioural economists emphasise the irrational nature of market participants to explain bubbles, followers of Austrian economics claim that loose and failed monetary policy is the prime reason that can explain bubbles (Holcombe & Powel, 2009; Rapp, 2015; Kennard & Hanne, 2015; Lemieux, 2011; French, 2009).
1.2
Types of bubbles
official position of the EMH on bubbles is that bubbles generally do not exist (Dreman, 2011; Kaul, 2014; Kettel, 2002; Fama cited in French, 2013), there can exist a rational deviation from the fundamental value known as a “rational bubble” (Blanchard & Watson, 1982). The main difference between the two aforementioned rational concepts is that in an explosive rational bubble, prices continuously deviate from fundamentals due to factors extraneous to asset value, whereas in an intrinsic rational bubble, prices periodically diverge from fundamental value due to exogenous fundamentals (Black et al., 2006).
In contrast, the third concept (“momentum”) denotes the general or irrational bubble theory. Irrational bubble theory supports the idea that investors who stay in the marketplace do not focus sufficiently on fundamentals and do not know that the market is overvalued (Hardouvelis, 1998). Under such a basis, market participants follow adaptive expectations3
(rather than rational expectations) when they estimate future price outcomes. In opposition to rational theory, the irrational bubble theory does not emphasise the appropriateness of using present-value models to detect bubbles. Irrational speculative bubbles are caused by precipitating factors that have an immediate effect on demand as well as through amplification mechanisms that take the form of optimistic price-to-price feedback (Shiller, 2000, Case & Shiller, 2003). Following this logic, irrational bubble theory is akin to herd behaviour, in which in the absence of complete information makes housing investors more inclined to look to the behaviour of others when deciding what to do (Baddeley, 2005).
1.3
What type of bubble the study aims to examine/identify?
My work conforms to the irrational bubble theory. The main available approach to justify housing bubbles on such a basis is to measure the qualitative characteristics and opinions of housing buyers. Qualitative evidence of speculative activities, coupled with the risk unawareness of housing buyers, forms the conclusion that a housing bubble exists (Case & Shiller, 2003). This thesis proposes an alternative approach of quantitative measurement to detect such speculative bubbles. Generally, under the irrational bubble theory, a housing bubble is a “peculiar kind of fad or social epidemic that is regularly seen in speculative markets; not a wild orgy of delusions but a natural consequence of the principles of social psychology coupled with imperfect news media and information channels” (Shiller 2013,
p.2). The theory also accepts that, during housing bubbles, some degree of herd behaviour is found in the marketplace. This study also accepts that during housing bubbles, market participants do not know that prices are overvalued or bubbly. These theoretical “truths” (i.e. elements) of irrational bubble theory provide the initial basic conceptual elements upon which this research is grounded. Further details regarding the conceptual elements of the study and its main hypothesis can be found in the research methodology chapter.
1.4
Historical bubble events: The real world
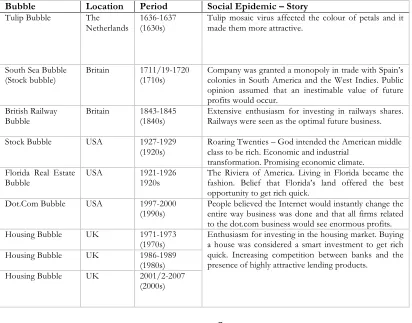
[image:19.595.86.498.459.782.2]By reflecting back on what has been written here, it is apparent that speculative bubbles do exist and do occur. And if Keynes’s animal spirits were referring to the cause of speculative bubbles, then these bubbles would have occurred ad infinitum throughout history. Moreover, as Shiller (2005) makes clear in his book, Irrational Exuberance that a bubble is a kind of social epidemic, and there is always a story behind each bubble that in turn changes with each new bubble. Hence, it is instructive to provide a snapshot of some of the most famous bubbles in history, with an emphasis on the UK region, and also to indicate the main story behind each of the bubble episodes.
Table 1. Historical Bubble Events
Bubble Location Period Social Epidemic – Story
Tulip Bubble The
Netherlands
1636-1637 (1630s)
Tulip mosaic virus affected the colour of petals and it made them more attractive.
South Sea Bubble
(Stock bubble) Britain 1711/19-1720 (1710s) Company was granted a monopoly in trade with Spain’s colonies in South America and the West Indies. Public opinion assumed that an inestimable value of future profits would occur.
British Railway Bubble
Britain 1843-1845
(1840s)
Extensive enthusiasm for investing in railways shares. Railways were seen as the optimal future business.
Stock Bubble USA 1927-1929
(1920s) Roaring Twenties – God intended the American middle class to be rich. Economic and industrial transformation. Promising economic climate.
Florida Real Estate
Bubble USA 1921-1926 1920s The Riviera of America. Living in Florida became the fashion. Belief that Florida’s land offered the best opportunity to get rich quick.
Dot.Com Bubble USA 1997-2000
(1990s)
People believed the Internet would instantly change the entire way business was done and that all firms related to the dot.com business would see enormous profits.
Housing Bubble UK 1971-1973
(1970s) Enthusiasm for investing in the housing market. Buying a house was considered a smart investment to get rich quick. Increasing competition between banks and the presence of highly attractive lending products.
Housing Bubble UK 1986-1989
(1980s)
Housing Bubble UK 2001/2-2007
1.5 Significance and intended contribution of the study
With bubbles and busts occurring more and more frequently in housing markets, research interest on the theme has been gradually increasing. Yet, what we have learnt from the housing bubble studies done since Florida’s real estate bubble of 1920s? The answer is ambiguous. First, existing bubble detection methods are subject to serious limitations at both the theoretical and empirical levels. Moreover, existing approaches have consistently failed to identify the presence of bubbles in housing markets with adequate confidence. Also, the efficient market hypothesis, rational bubble theory and conventional ‘fundamental’ approaches have been placed in doubt and are increasingly being seen as antiquated and non-useful when it comes to bubble problems. At the same time, Case and Shiller (2003, 1989, 1988) have challenged the conventional belief that economic models must always include the assumption of rational expectations by all economic agents and that the housing market is an efficient market. The authors asserted that real estate markets are largely driven by expectations based on past price movements rather than on any knowledge of fundamentals and that market participants are far from rational. Thus, their conclusion was that housing markets are irrational. After nearly three decades of research, the study of investor behaviours in asset markets eventually resulted in the creation of behavioural finance (BF), an opposing theory to the EMH. At the present, the irrational view of housing bubbles, seen through the view of BF, is the most popular theory among academics. Turning to the identification of housing market bubbles, behavioural finance has provided significant evidence that the survey-based method is the best available approach for identifying housing bubbles. However, despite the widespread success of this method, the survey-based approach is subject to inherent problems as well as to problems related to its applicability. Another inefficiency in the literature on housing bubbles is that most economists find the classical definitions of housing bubbles quite problematic and imprecise.
the research attempts to link the existing irrational view of housing bubbles with a new quantitative measurement method. Also, in attempting to produce a more reliable metric for housing bubbles, it is hoped that this research will reveal a new concept and hypothesis that will provide a more sophisticated definition of housing bubbles. Overall, it is hoped that the study will contribute towards a ‘big picture’ understanding of the development of housing bubbles in the UK context. Finally, it is hoped that this research will provide inspiration for future research in other geographical locations, like the US.
1.6 Research aim and objectives
1.6.1 Aim of the research
The specific purpose of this research is to develop an algorithm-based model for the identification of UK housing bubbles. It is hoped that the model will provide a new measure for studying the presence of (irrational) housing bubbles by using data up to the point of analysis for on-going bubble assessment, with a view to providing early bubble diagnostics. With this in mind, I have attempted to construct an empirical model that allows us to mimic the path of irrational bubbles, with the aim of detecting them during the phenomenon’s maturity process. Therefore, the question this study intends to answer is: How can property bubbles be better detected in order to provide advance warning to market participants? The broad target of this study is to understand how the housing market operates within the context of cyclicality, what a housing bubble as a phenomenon is, and what causes the formation of housing bubbles.
1.6.2 What kind of model does the study aim to develop?
This research is concerned primarily with developing a model for the purpose of identifying the phenomenon of housing bubbles. The rationale for developing identification models in economics has been emphasised in recent studies by Mayer (2011), Agnello and Schuknecht (2011), and Orrel and McSharry (2009). These authors propose that economic models should emphasise the identification of economic phenomena (e.g. bubbles) rather than predicting the exact probability or the timing of the next crash or bubble, or even forecasting an outcome. Following this view, it is suggested that despite the productivity and dynamism of the economy and asset markets, they become unhealthy and unbalanced, with unstable prices movements, and in such situations they appear to be near a state of disease4. Interestingly,
the authors mention that the approach applied in medicine could guide the development process of economic models to the extent to which doctors use models to assess a person’s health without predicting the exact probability or timing of catastrophic events like a heart attack. In the same way, the authors suggest that there is a need to develop and apply models to measure the health of the economy or specific markets (e.g. the housing market) without seeking to predict the next crash or the future movements of a variable/output. Following the above description, the model should be able to assess the ‘health’ of the UK housing market by providing early bubble warning diagnostics (during the bubble phenomenon’s maturity process). In particular, the potential model should not only act as a diagnostic tool for housing bubbles but should also serve as a simplifying and simulating process. It is expected that this will be achieved by developing an empirical model that allows us to mimic the path of irrational bubbles. Finally, the potential model’s results should be comparable with actual bubble behaviours/episodes in order to reach reliable conclusions. The key principles used in the development process of the model, as well as the characteristics of the model, are detailed in Chapter 5.0 on research methodology.
1.6.3 Objectives
The specific objectives of this study are the following:
a) To build contextual knowledge regarding historical housing bubble episodes and the cyclical development of the UK housing market
b) To explore the theoretical framework of housing bubbles and housing cycles
4 Regarding bubbles, Shiller (2000, 2015) and Case and Shiller (2003) also mentioned that a housing bubble is a kind of social epidemic
c) To review the literature on bubble detection methods/approaches and to critically analyse their gaps and limitations
d) To describe historically and empirically the last two UK housing bubble case studies e) To develop a new methodology/model for estimating irrational housing bubbles and
apply it to the UK housing market
f)
Draw conclusions1.7 Research Outline
Chapter 6 also links descriptively the recorded UK housing bubble episodes with the cyclical behaviour of historic UK house prices. The methodology’s section in Chapter 5 provides the framework for the development of the model in Chapter 7. Here (in Chapter 7), an attempt is made to present, in a comprehensible manner, the actual development of the bubble detection model derived from the composite methodology proposed in Chapter 5. Chapter 7 also presents and explains the model’s equation and its main properties based on the variables used. Chapter 8 apply the tests to validate the model. The testing process is undertaken by comparing the model’s outputs with the actual historic bubble episodes in the UK (via utilising validation techniques). Finally, a discussion of the relationship between this thesis results with results of existing UK bubble studies is presented in Chapter 8. Chapter 9 draws conclusions and presents a brief review in terms of the research objectives achieved, the main research findings, contribution to knowledge, advantages and limitations of the proposed model as well as proposals for future research.
Chapter 2
2.0 Real Estate Cycle and Housing Market
This chapter is divided in three parts. First, a review of the theoretical foundations of cyclical markets in real estate is given in Part A. This review is extended to explain several issues such as the significance of cycles, the relevance of cycles in real estate market performance, existing definitions, the phases and inner workings of the cyclical behaviour of property markets.
The second part (Part B) i) presents a historical review of the evolution of the UK housing market, ii) highlights its cyclical and historic turning points, and iii) explains the main factors causing the UK market to experience cyclical behaviours.
The third part (Part C) includes a simple empirical analysis using the triangular methodology to empirically detect the turning points in UK housing cycles, as well as to understand them in terms of persistence, magnitude and severity.
2.1 Theoretical foundations of property cycles (Part A)
2.1.1 The significance of real estate cycles
Roulac (1996) has argued that the domain of real estate cycles has been used in professional practice more so than in the academic literature and that it has therefore received very limited attention in real estate education. Furthermore, few real estate courses have paid meaningful attention to real estate market cycles. However, since Roulac’s criticism was published in 1996, many authors have published relevant academic articles on real estate cycles.
following from Dobrian (1997): “Like a wheel of fortune, the real estate cycle presents varied changes and opportunities. Can you bet with confidence on your response?” Pyhrr et al. (1999) further state that throughout history, real estate cycles have been a key factor in the financial success or failure of real estate investments.
2.1.2 The relevance of real estate cycles
Pyhrr et al. (1999) state that there are two schools of thought regarding whether real estate cycles are relevant. The first school claims that real estate cycles are not relevant and can thus be ignored, whereas the second argues that they are very relevant and should be carefully studied by analysts and investors.
Pyhrr et al. (1999) further outline 16 factors that the first school uses to argue that real estate cycles are not relevant and can therefore be ignored. They state that valuation theorists and appraisers have historically ignored cycles in their valuation frameworks and models. However, the second school of thought, using the “preponderance of evidence” approach, distinguishes the relevance of real estate cycles within three categories: macroeconomic, microeconomic and practitioner (expert).
The overwhelming academic and practitioner interest in real estate cycles, as evidenced by the growing body of knowledge on the subject, leads to the clear conclusion that real estate cycles are relevant and will become a more important decision variable for investors and portfolio managers in the future. While in the past, the concept of market cycles has been oversimplified and used more to support self-serving assertions about probable market recovery than as a guide to investment decisions, the situation appears to be changing rapidly. Increasing numbers of investors and portfolio managers appear to understand the dynamics and complexity of real estate cycles and their implications for investment and portfolio strategies and decisions (Pyhrr et al., 1999) p. 27.
2.1.3 Describing and defining real estate cycles
revivals.” One of the few concise definitions of the property cycle is offered by the Royal Institution of Chartered Surveyors (RICS, 1994): “Property cycles are recurrent but irregular fluctuations in the rate of all-property total return, which are also apparent in many other indicators of property activity, but with varying leads and lags against the all-property cycle.” RICS further clarifies that the property cycle is not necessarily regular in length, speed or severity. Baum (2000, p.6) attempts to simplify this by describing property cycles as a tendency for property demand, supply, prices and returns to fluctuate around their long-term trends or averages. As he further suggests, “prices in all markets go up and down. Inefficiency in real estate markets makes these up and down movements look like a repeatable, cyclical, pattern.’’ Another observer, Wheaton (1999), suggests that a property cycle involves repeated oscillations of a market as it continually overshoots and then undershoots its own steady state.
Among popular explanations of the property cycle referencing the UK market, is one developed by Barras (1983, 1994, 2005, 2009). He proposes that property markets behave cyclically in the long run, primarily because of building lags in relation to changes in demand for space that are mainly determined by fluctuations in business activity. An alternative explanation of boom-bust cycles is provided by Stoken (1993) and Shiller (2005). They suggest that boom and bust cycle theories are not theories in their own right because major events serve to trigger major cycles in property markets, which themselves are often explained by irrational human or crowd behaviour.
2.1.4 The phases of cycles
recovering, improving, maturing, overbuilding and falling. Mueller and Laposa (1994) suggest that there are four phases in property cycles: recession, recovery, expansion and contraction (oversupply).
2.1.5 Theories of property cycles
Pugh and Dehesh (2001) distinguish two types of property cycle: endogenous and exogenous. The endogenous type results from long lead times between commissioning a project and contracting the work (Pugh & Dehesh, 2001; Reed & Wu, 2010). Kummerow and Lun (2005) add that endogenous real estate cycles are mainly caused by information problems: asymmetric information, forecasting difficulties and strategic uncertainty. In contrast, exogenous cycles have an external transmission mechanism and are caused mainly by macroeconomic and property trends. This type is sensitive to incomes, flows of funds, interest rates and exchange rates (Pugh & Dehesh, 2001).
Hoyt (1933), a pioneer in the subject of property cyclicity, conducted a major study on Chicago property cycles using analytical methods and other techniques. His findings were briefly as follows. The upswing in excess demand will cause a rise in gross rents, which will in turn drive increases in net rents. This will lead to escalating selling prices, consequently stimulating increased rates of renovation and new construction. Subsequently, an increased supply will be established, until it exceeds demand. In most cases, the full rate of construction constitutes a mania for building, which continues at the peaks of booms and is later followed by foreclosures, crashes and a long period of subsequent recession and abrupt reversals in lending policies among financial institutions.
Questioning the construction lag explanation, however, Dokko, Edelstein, Lacayo, and Le (1999) argue that although many markets do have considerable production lags for large office construction projects, the building lag argument does not seem to explain the cyclical movement of other types of property, such as “tilt-up industrial space” (precast concrete), where the production time required is less than a year. Dokko et al. (1999) also shed light on two other aspects of real estate cycles: the greed of developers and bad decisions by lenders. They explain that as long as developers can secure financing for construction, they will build. On the other hand, the existence of lenders who fail to learn from past lending mistakes, along with the absence of regulatory or profitability limitations on lenders, contribute materially to the availability of credit, leading to the inevitable creation of bubbles and busts in real estate. Using a historical analysis based on some key studies, Barras (2009) argues that upward building trends are directly connected with the growth of urban populations and that there is an inverse relationship between building activity trends and the yields on government bonds: low interest rates and the resulting cheap credit fuel speculative building booms, while shocks such as wars or bank crises lead to massive increases in interest rates that cause building slumps.
Regarding the pattern of property cycles, Baum and Hartzell (2012) take a generic approach, noting that the following pattern in real estate cycles has repeated itself three times since 1970 in the US:
• The market value of existing property exceeds the cost of construction. Developers increase supply and sell properties at completion (earn profits).
• There are large amounts of debt and capital flow in the real estate industry.
• Building development activity increases (supply increases), creating jobs in real estate and
related sectors (lending, construction, etc.).
• Supply exceeds tenants’ demand for space and oversupply (overstock) of properties
causes rents to fall as tenants’ options expand.
• Property values decrease, ultimately dropping below replacement value. However, given
• New development stops, eliminating jobs in real estate and the associated industries,
leading to further economic decline.
• Over time, the economy recovers, occasionally very slowly.
• As the economy recovers, jobs are created and income rises, increasing the demand for
office, retail, residential and other space.
• Market rent levels increase, together with the wider expansion of the economy and
absorption of space by tenants.
• Since replacement value (cost of building) exceeds the market value of existing properties,
developers cannot profit by adding new supply to the market and a supply shortage develops.
• Nevertheless, rents increase at the same time, so market values for existing properties rise
above the replacement value (cost). Developers are attracted and development slowly starts again.
• As investors seek abnormal returns based on the expectation of continuing value
appreciation, capital flows into the real estate industry. Values and returns continue to increase, attracting more investors and funds, which in turn means more jobs, etc.
• As market values of existing properties increase above replacement values, developers
boost the supply, sell buildings at completion and earn profits.
• Large amounts of debt (mortgages) and equity capital flow into the real estate industry. • The cycle repeats itself.
Particularly, the pattern is as follows. In the recovery phase, the market is in a state of oversupply due to the previous oversupply or negative demand growth. At this stage, vacancy rates hit their peak. A market bottom is considered to have been reached when the construction from the previous cycle stops. When the cycle bottom has passed and growth takes place, the existing oversupply is absorbed and existing vacancy rates begin to fall significantly. In the wake of this, rental rates stabilise or even begin to rise, albeit at a slow pace, normally below the inflation rate. Eventually, the market reaches equilibrium. In the second phase (expansion), demand continues to grow with confidence, leading to a need for extra space. Vacancy rates fall below the equilibrium level, signalling that supply is limited in the market. During this phase, rents begin to increase rapidly (normally above the inflation rate) until they drive prices to reach the ‘cost feasible’ level that will allow new construction to start. Then, at some point, the property cycle reaches its peak, which can be described as the ‘inflection point,’ where the space market is tight and rents are high. This attracts new supply. The inflection point is followed by the third phase (hyper-supply). However, most participants do not recognize that this transition has occurred, since the market still looks good. During this phase, supply growth is higher than demand growth, while vacancy rates rise back towards a new market equilibrium. Eventually, market participants realise that the market has turned and commitments to new construction slow down or stop. If construction continues beyond the equilibrium point, the market will move into the fourth phase (recession), marked by high supply growth and low or negative demand. The extent of this downside phase is determined by the excess supply (i.e. the difference between supply growth and demand growth). The cycle eventually reaches the bottom (Mueller & Laposa, 1994; Mueller & Pevnev, 1997).
2.1.6 Cycles and bubbles - their relationship
in property prices, extended recessions, debt overhang (excessive debt), nonperforming loans in the banking and finance sectors, and more frequent bubble phenomena in the real estate market. Stoken (1993) asserts that most real estate cycles are not accounted for by theories in their own right. They happen when human irrationality or crowd behaviour causes major events that directly trigger cycles in property markets. Similarly, Dokko et al. (1999) shed light on two other aspects of real estate cycles: the greed of developers and bad decisions by lenders (i.e. disaster myopia). The authors explain that as long as developers can secure financing for construction, they will build. On the other hand, the failure of lenders to learn from past lending mistakes and the absence of serious regulations on lenders contributes materially to the availability of credit, resulting in the inevitable creation of bubbles and busts in real estate prices.
Generally, it is not yet clear whether a bubble is a part of a cycle or is an isolated phenomenon within real estate markets. It is, however, clear that bubbles are phenomena that are derived from or affected by the cyclical patterns of the market. Therefore, it is imperative for this study to first look at the cyclical nature of real estate and particularly at the evolution of the UK housing market within the context of cycles in order to better understand the meaning of bubbles. As such, this chapter will look at the historical cyclical movements of the UK property market, while the subsequent chapter will explore the UK housing bubbles episodes that have occurred throughout history.
2.2 Historical analysis of UK housing cycles and the evolution
of the UK property market (Part B)
2.2.1 The UK property market prior to the Second World War
insurance companies were relatively restricted to the ownership of property occupied in whole or part by the company itself. Most attention was paid to mortgages and ground rents. Thus, direct investments in property were almost non-existent. Nevertheless, a small number of insurance companies (legal and general) during the 1930s became aware of the long-term advantage of property and slowly began to increase their investments in property shares and equity involvement through the direct purchase of freeholds (Fraser, 1993).
Scott (1996) describes the entrance of insurance companies into property investment that occurred during the mid 1930s, reaching a peak of 11.2% of the total funds in 1935. Prior that period, during the 1920s, one of the few insurance companies to undertake a considerable volume of property investment was Clerical Medical. According to Fraser (1993), the lessons learned by the American insurance companies regarding the management of risk in the property sector during the crash of 1929 deterred UK insurance companies from becoming more actively involved in direct property investment at that time.
According to Scott (1996), between 1933 and 1938 there was a huge increase in the number of new public property companies that were established compared to the previous years, as banks and insurance companies began to offer funds for the property sector during the 1930s. Most importantly, the insurance sector offered long-term financing, while banks were a key source of short-term financing for the property development industry.
invasion of Britain, some insightful individual speculators began to invest in properties during wartime. Their reasoning was simple: If the ‘‘Allies’’ (UK and other anti-Hitler coalition members) win the war, property values will be expected escalate substantially during the post-war recovery period. On the other hand, if Hitler and the Axis alliance were victorious and conquered Britain’s land, it would be of little importance where they had invested their money.
Such investors/speculators purchased real estate for bargain prices during wartime and took advantage of future capital appreciation. That strategy created a number of post-war fortunes. The insurance companies, however, were unable to purchase properties during the Second World War, as they were obliged to place all their new funds in government bonds. This was a ‘‘gentlemen’s agreement’’ between the insurance companies and the central bank of England. This was despite the fact that general managers of insurance companies held an opposite view. For example, Sir Andrew Rowell, the general manager of Clerical Medical, a British life insurance company, stated in 1942 that his company should invest in property during the war since there would be prospects after the war. However, Clerical’s board did not accept this idea. A freeze on property investment was imposed until the end of the war in February 1945 (Scott, 1996). During the war, a huge destruction of property took place in the UK, especially in the city of London. An area of about 9.5 million square ft. of office space in central London was destroyed. About one third of London City was heavily bombed (Fraser, 1993). According to Scott (1996), more than 3 million properties were destroyed and most of them were houses. Moreover, this figure includes a total of 75,000 shops, 42,000 commercial properties and 25,000 factories. Bristol, Hull, Coventry, Portsmouth and central London suffered the greatest damage. According to Balchin, Bull, and Kieve (1995), 200,000 houses were destroyed during the Second World War era. At the end of the war in 1945, the shortage of housing was at least 1,350,000, without taking into account the obsolete houses that needed replacing. Under such conditions, the War Damage Act of 1943 was passed in order to cover the full costs of rebuilding properties that had been destroyed.
(Fraser, 1993). In September 1944, a year prior to the end of the war, Lord Woolton and Winston Churchill stated that housing was ‘‘the very first urgency after the immediate needs of the war.” The previous housing shortage balance in 1939, together with population growth and the demand for replacement of unfit or obsolete houses caused massive housing shortages. In general, it was estimated that 3-4 million houses were needed in England and Wales in the first post-war decade (Malpass, 2003). According to Balchin et al. (1995) and Malpass (2005), between 1945 and 1951 more than a million houses were constructed in the UK, with local authorities contributing most. In total, UK local authorities produced almost 3 million housing units in the two decades following World War II. The massive scale of housing production was in response to the huge housing shortage together with the welfare state housing program (Stone, 2003).
and 1959 removed development charges and the Central Land Board5 terminated the
building license system (Connellan, 2004). According to Fraser (1993) and Cadman (1984), these measures resulted in an increase in development potential and profitability in the real estate market. Consequently, a huge increase in site values occurred, laying the foundation for 10 years of intense redevelopment activity that led to the UK’s first building boom.
2.2.3 The UK’s first modern development boom of the 1950s and 1960s
According to Solomou (1998), the 1950s and 1960s constituted a period of economic stability. RICS (1999) argues that the property market was less volatile during that period. In support of this, Wellings (2006) reports that throughout the 1960s the growth in house prices was stable, with an average increase between 5% and 10%. The average performance of property assets during the development boom of 1955-1964 was less profitable than ordinary shares, but better than government bonds. Returns were 7% for property, 0.7% for bonds and 10.2% for ordinary shares (Scott, 1996). As for the property development industry, the development process in the first two decades after the Second World War was comparatively simple, secure, and profitable, especially from the developers’ perspective. Firstly, the bombsites that were available for development (e.g. office use) and the high amount of unsatisfied occupation demand (due to previous shortages) meant a low risk of rent voids at completion. Developers found that in the post-war boom, a large amount of funds were accessible at low interest rates. The fact that rental growth tended to outstrip the rising rate of inflation over this period (1954-1964) resulted in huge returns for highly geared investors (Fraser, 1993). In 1951, there were 23,000 housing completions in the UK. After the removal of development controls in 1954 following the abolition of the Town and County Planning Act of 1947 and the switch to the ‘‘1953 policy,” housing completions soared to 91,000, a 295% increase. By the early 1960s, the top ten house-builders in the UK constructed about 15,000 houses per year. Five years later, in the mid 1960s, the top ten builders were producing 17,000-18,000 houses per year, reaching the industry’s peak of 222,000 houses constructed in 1968. By 1960, only 35% of new buildings were being produced by local authorities compared to their previous share of 89% between 1945-1951. Private property development was the new trend. Another notable trend at the time was the massive demand and production of flat-type housing. In central London, floor space had risen by 50% compared to pre-war levels (Wellings, 2006; Scott, 1996). According to Scott
(1996), inflation was reaching about 5% per annum in the mid 1950s. Under such conditions, an important innovation was introduced that is known today as ‘‘rent reviews clauses’’ with upwards rent reviews. However, the proper introduction of rent reviews happened in 1955. By the end of 1955, rent reviews became increasingly popular. For instance, Church commissioners began to seek rent review clauses for their new property purchases. Gradual progress was made regarding rent reviews clauses, starting with rent reviews in the 33rd and
66th years of leases. Later, the intervals became shorter and shorter as rent reviews became
more widespread and inflation’s effects on property were more broadly appreciated.
Investors that had commercial properties (land) during the immediate post-war period between 1945-1954 found their fortunes increased considerably during the development boom of 1954-1964 (Scott, 1996; Fraser, 1993). According to Balchin et al. (1995), from 1953 until the mid-1960s there were tremendous changes in land values, which increased as much as ten times. Today’s property companies in the UK are fundamentally a post-war phenomenon. According to Fraser (1993), in the two decades following the war, from 1945-1965, at least 110 property millionaires were created. Moreover, the structural changes of real estate companies during this period were rapid. In 1939, the number of public property companies in the UK was just 35. Twenty-five years later, in 1964, the number of public property companies amounted to 185 (Fraser, 1993).
On November 4th, 1964, George Brown, the new Minister of Economic Affairs under Prime
Minister Harold Wilson, announced the so-called ‘‘Brown Ban’’6 requiring the issue of Office
Development Permits (ODP) for new office developments in and around London. The introduction of the Brown Ban in 1964 announced the end of the development boom period that had lasted for 10 years. From 1965-1966, office development controls were extended to Birmingham and then to the whole region of the South East, East and West Midlands (Scott, 1996; Fraser, 1993). According to Scott (1996), the main aim of the ‘‘Brown Ban’’ implemented by the Labour Government was not to prevent a slump in the real estate market, but rather to prevent the rapid growth of London’s working population and the problems associated with it, such as transportation. However, the Brown Ban did set the foundations for an aggressive investment boom between 1965-1973 (Scott, 1996). Similarly, Fraser (1993) mentions that the outcome of the Brown ban policy restricted the supply of investments, especially in London and South East England. However, new investments in the form of re-sale and lease-backs were being created. According to Porter (2000), the only
6 Brown Ban: An almost complete ban on office development in and around London. The ban marked the end of the property
thing the ‘‘Brown Ban’’ succeeded in doing was driving up rents and increasing developers’ profits. Similarly, Scott (1996) states that the results of the Brown Ban and thus the ODP7
system had a number of faults. Firstly, it resulted in the rapid growth in office rents and market rents in the City area. For instance, City office rents increased from typical levels of £2 per sq. ft. in 1963 (prior to the introduction of the ban) to £5 in 1969, and more than £15 per square ft. in the early 1970s. Finally, the Brown Ban pushed developers to re-direct their investments to the retail property market where such restrictions were absent and which had prospects of high returns.
2.2.4 The 1970s Cycle
The 1970s were an important period for the UK housing market, as it was full of changes, ups and downs in prices, political shifts and major events in the spectrum of economics and banking. The following sub-sections are devoted to explaining in detail the aspects and events of the 1970s cycle.
2.2.4.1 The boom period of 1971-1973
The 1970s had started with a small decline in property values as the Labour Government introduced strict credit conditions in 1968. However, in June 1970, the conservatives took control under Edward Heath8. The main target of the new government was to curb inflation
and regenerate the industrial sector and productivity. The government adopted a strict monetary and fiscal policy. Soon it was realized that tight monetary and fiscal policy was not the solution, so the government switched their policy to an ‘‘all-out expansion’’ using all available resources in order to beat inflation by increasing production. Under these conditions, industries were encouraged to reinvest and expand their businesses, in the belief that economic growth would be sustained without deflationary measures. In such circumstances, cheap and easy borrowing was the method by which this would be achieved (Fraser, 1993). When the Conservative government took control, many policies enacted to revise the market conditions, such as Office Development Permit controls, were relaxed and