Open Access
Vol 12 No 2
Research
Implementation and evaluation of the SPRINT protocol for tight
glycaemic control in critically ill patients: a clinical practice change
J Geoffrey Chase
1, Geoffrey Shaw
2, Aaron Le Compte
1, Timothy Lonergan
1, Michael Willacy
1,
Xing-Wei Wong
1, Jessica Lin
1, Thomas Lotz
1, Dominic Lee
3and Christopher Hann
11Department of Mechanical Engineering, University of Canterbury, Clyde Road, Private Bag 4800, Christchurch 8140, New Zealand
2Department of Intensive Care, Christchurch Hospital, Christchurch School of Medicine and Health Science, University of Otago, 2 Riccarton Ave, PO Box 4345, Christchurch 8140, New Zealand
3Department of Mathematics and Statistics, University of Canterbury, Clyde Road, Private Bag 4800, Christchurch 8140, New Zealand
Corresponding author: Aaron Le Compte, [email protected]
Received: 19 Dec 2007 Revisions requested: 6 Feb 2008 Revisions received: 6 Mar 2008 Accepted: 16 Apr 2008 Published: 16 Apr 2008
Critical Care 2008, 12:R49 (doi:10.1186/cc6868)
This article is online at: http://ccforum.com/content/12/2/R49 © 2008 Chase et al.; licensee BioMed Central Ltd.
This is an open access article distributed under the terms of the Creative Commons Attribution License (http://creativecommons.org/licenses/by/2.0), which permits unrestricted use, distribution, and reproduction in any medium, provided the original work is properly cited.
Abstract
Introduction Stress-induced hyperglycaemia is prevalent in critical care. Control of blood glucose levels to within a 4.4 to 6.1 mmol/L range or below 7.75 mmol/L can reduce mortality and improve clinical outcomes. The Specialised Relative Insulin Nutrition Tables (SPRINT) protocol is a simple wheel-based system that modulates insulin and nutritional inputs for tight glycaemic control.
Methods SPRINT was implemented as a clinical practice change in a general intensive care unit (ICU). The objective of this study was to measure the effect of the SPRINT protocol on glycaemic control and mortality compared with previous ICU control methods. Glycaemic control and mortality outcomes for 371 SPRINT patients with a median Acute Physiology And Chronic Health Evaluation (APACHE) II score of 18 (interquartile range [IQR] 15 to 24) are compared with a 413-patient retrospective cohort with a median APACHE II score of 18 (IQR 15 to 23).
Results Overall, 53.9% of all measurements were in the 4.4 to 6.1 mmol/L band. Blood glucose concentrations were found to be log-normal and thus log-normal statistics are used throughout to describe the data. The average log-normal glycaemia was 6.0 mmol/L (standard deviation 1.5 mmol/L). Only 9.0% of all measurements were below 4.4 mmol/L, with
3.8% below 4 mmol/L and 0.1% of measurements below 2.2 mmol/L. On SPRINT, 80% more measurements were in the 4.4 to 6.1 mmol/L band and standard deviation of blood glucose was 38% lower compared with the retrospective control. The range and peak of blood glucose were not correlated with mortality for SPRINT patients (P >0.30). For ICU length of stay (LoS) of greater than or equal to 3 days, hospital mortality was reduced from 34.1% to 25.4% (-26%) (P = 0.05). For ICU LoS of greater than or equal to 4 days, hospital mortality was reduced from 34.3% to 23.5% (-32%) (P = 0.02). For ICU LoS of greater than or equal to 5 days, hospital mortality was reduced from 31.9% to 20.6% (-35%) (P = 0.02). ICU mortality was also reduced but the P value was less than 0.13 for ICU LoS of greater than or equal to 4 and 5 days.
Conclusion SPRINT achieved a high level of glycaemic control on a severely ill critical cohort population. Reductions in mortality were observed compared with a retrospective hyperglycaemic cohort. Range and peak blood glucose metrics were no longer correlated with mortality outcome under SPRINT.
Introduction
Hyperglycaemia is prevalent in critical care, even with no prior diabetes [1-4]. Increased secretion of counter-regulatory hor-mones stimulates endogenous glucose production and
increases effective insulin resistance [3,4]. Studies also indi-cate that high-glucose-content nutritional regimes can exacer-bate hyperglycaemia [5-10].
Hyperglycaemia worsens outcomes, increasing the risk of severe infection [11], myocardial infarction [1], and critical
illnesses such as polyneuropathy and multiple organ failure [2]. Evidence also exists of significant reductions in other apies such as ventilator support and renal replacement ther-apy with aggressive glycaemic control [2,12]. More importantly, van den Berghe and colleagues [2,13,14] and Krinsley [15,16] showed that tight glucose control to limits of 6.1 to 7.75 mmol/L reduced relative intensive care unit (ICU) patient mortality by 18% to 45% for patients with a stay of greater than 3 days. Both sets of studies also showed signifi-cant cost savings per patient [17,18]. Finally, two recent reviews showed that tighter control with less variability pro-vides better outcome [19,20].
Regulating blood glucose levels in critical care using simple model-based protocols and insulin alone has been moderately successful [21-25]. However, no model-based method has been clinically tested to a mortality endpoint. In contrast, clini-cally tested sliding scales and titration-based methods have not always been effective, due to an inability to customise the control to individual patients [26-28]. On the other hand, model-based methods are able to identify evolving patient-specific parameters and tailor therapy appropriately.
The significantly elevated insulin resistance often encountered in broad critical care cohorts challenges the practice of using insulin-only protocols. In the presence of significant insulin resistance, insulin effect saturates at high concentrations of insulin [23,29,30], limiting the achievable glycaemic reduc-tions. Hence, despite the potential, many ICUs do not use fixed protocols or necessarily agree on what constitutes acceptable or desirable glycaemic management and perform-ance [4,12,31-34].
However, tighter glycaemic control is still possible by also con-trolling the exogenous nutritional inputs exacerbating the orig-inal problem [5-10]. Clinical studies that intentionally lowered carbohydrate nutrition have significantly reduced average blood glucose levels without added insulin [5,8,9], and Krishnan and colleagues [10] showed that feeding 33% to 66% of the amount recommended by the American College of Chest Physicians (ACCP) guidelines [35] minimised mortality and hyperglycaemia. The present paper presents the clinical implementation of a protocol, developed from model-based controllers [36,37], that modulates both nutrition and insulin to provide tight glycaemic control together with easy clinical implementation. The protocol is a simple paper wheel-based system (Specialised Relative Insulin Nutrition Tables, or SPRINT) that modulates both insulin and nutritional inputs based on hourly or 2-hourly blood glucose measurements for tight glycaemic control. The objectives of this study were to measure the effect of the SPRINT protocol on glycaemic con-trol compared with previous ICU concon-trol methods and to eval-uate the effect the implementation of the protocol has had on mortality outcomes.
Materials and methods
Protocol
Model-based tight blood glucose control is possible with a val-idated patient-specific glucose-insulin regulatory system model that captures the fundamental dynamics. Chase and colleagues [21,23,38] and Hann and colleagues [38] used a model that captured the rate of insulin utilisation, insulin losses, and saturation dynamics and that has been validated using retrospective data [38-40], clamp data [41], and several short-term (not longer than 24 hours) clinical control trials [36,37]. The model thus captures the metabolic status of the highly dynamic ICU patient and uses it to provide tight control. However, computational resources are not available in some critical care units for effective computerised control methods, and their complexity can limit easy large-scale implementation required to test overall safety and efficacy. Hence, a simpler paper-based method was developed to mimic this protocol. SPRINT was implemented as a clinical practice change at the Christchurch Hospital Department of Intensive Care in August 2005. Further details on SPRINT, its development, and initial pilot study can be found in [27,28,42].
The entry criterion for the SPRINT protocol was a blood glu-cose measurement of greater than 8 mmol/L on two occasions during standard patient monitoring, where the 8 mmol/L repre-sents the upper limit of clinically desirable glycaemic control in the Christchurch ICU. Patients were occasionally put on SPRINT at the discretion of the clinician if the blood glucose levels were consistently greater than 7 mmol/L in severe criti-cal illness. Patients were not put on the protocol if they were not expected to remain in the ICU for more than 24 hours. Data were collected for all blood glucose measurements, insulin administered, and nutrition given to the patient. The Upper South Regional Ethics Committee, New Zealand, granted eth-ics approval for the audit, analysis, and publication of these data.
Hourly blood glucose measurements are used to ensure tight control [27]. Two-hourly measurements are used when the patient is stable, defined as three consecutive 1-hourly meas-urements in the 4.0 to 6.0 mmol/L band [27,42], or when an arterial line is not present. SPRINT is stopped when the patient is adequately self-regulating, defined as 6 or more hours (three 2-hourly measurements) in the 4.0 to 6.0 mmol/L band with over 80% of the goal feed rate and a maximum of 2 U/hour of insulin [27,42].
this background rate. A background rate of 0.5 to 1.0 U/hour, to which SPRINT bolus insulin is added, is mandated in patients with type I diabetes.
Goal enteral nutrition rates are approximately 25 kcal/kg per day of RESOURCE Diabetic (Novartis Medical Nutrition, Min-neapolis, MN, USA) or Glucerna (Abbott Laboratories, Abbott Park, IL, USA) with 34% to 36% of calories from carbohy-drates [44]. Minimum and maximum nutrition rates are 7.5 to 25 kcal/kg per day, with 2.7 to 9 kcal/kg per day from carbo-hydrates. Thus, an 80-kg male would receive a maximum of 2,000 kcal/day and a minimum of 600 kcal/day, with 216 to 640 kcal/day from carbohydrates, exceeding the minimum level below which there is an increased risk of bloodstream infections [45]. These guidelines are detailed by Shaw and colleagues [26] and are approximately equivalent to the ACCP guidelines [35].
Statistical analysis
Baseline variables were compared using the two-tailed Mann-Whitney U test or chi-square test. Change in mortality was compared between the SPRINT and historical cohorts by means of the square test. The Mann-Whitney and chi-square tests were used to compare blood glucose metrics between survivors and non-survivors. MINITAB® Release 14.1
(Minitab Inc., State College, PA, USA) was used for statistical comparisons, and for all statistical tests, P values of less than 0.05 were considered significant.
Log-normal statistics were used to provide an accurate description of blood glucose control results as negative blood glucose concentrations are not possible and typical distribu-tions of blood glucose measurements are asymmetric and show a skew toward higher concentrations. The design of the protocol was that, for periods outside the ideal target range, short periods of higher blood glucose levels were preferred over hypoglycaemic events. Thus, the distributions for blood glucose are right-skewed and log-normal.
Cohorts
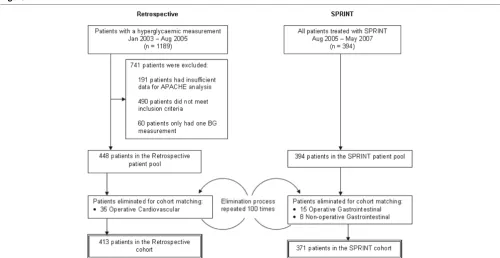
[image:3.612.56.556.433.691.2]SPRINT was implemented as a clinical practice change and thus was the sole method of treatment for hyperglycaemia. A retrospective cohort has been used to infer changes in patient outcome due to SPRINT. This cohort was extracted from all intensive care patients for the 20-month period of January 2003 to August 2005. Figure 1 shows the selection of patients into the SPRINT and retrospective patient cohorts. Entry criteria into the retrospective cohort were an ICU length of stay of at least 1 day and at least two blood glucose meas-urements of more than 8 mmol/L spaced not more than 24 hours apart. Patients were excluded where there were insuffi-cient clinical data available to compute an Acute Physiology and Chronic Health Evaluation (APACHE) II score. There was no set protocol for treating hyperglycaemia in the Christchurch ICU during the retrospective period, and clinicians often used a variety of insulin sliding scales.
Figure 1
Method of cohort selection for the Specialised Relative Insulin Nutrition Tables (SPRINT) and retrospective patient groups
The retrospective patient pool had a larger proportion of oper-ative cardiovascular patients, and the SPRINT patient pool had a larger proportion of gastrointestinal patients. Changes in the economics of health care caused changes in the types of patients admitted to the Christchurch ICU over the 4-year period encompassed by the SPRINT and retrospective data. The difference in cardiothoracic patients between the patient pools may have resulted from less case throughput and better pre-intensive care glycaemic control. Thus, to provide better-matched cohorts, retrospective operative cardiovascular patients and SPRINT gastrointestinal patients were randomly eliminated from the patient pools to create the cohorts used for analysis, as shown in Figure 1. The patient elimination pro-cedure was repeated 100 times to create 100 cohorts. To present the data clearly, the median cohort results are pre-sented based on mortality outcome for analysis in this article.
The major results and outcomes were unaffected by the spe-cific cohort iteration.
Results
Patient cohorts
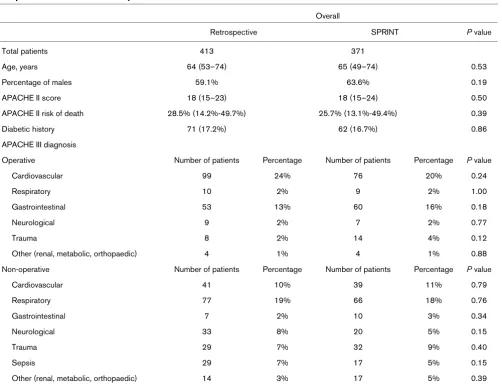
The clinical details of this retrospective cohort are compared with the SPRINT cohort by means of baseline variables, APACHE II scores, and APACHE III diagnosis codes in Table 1.
Glycaemic control
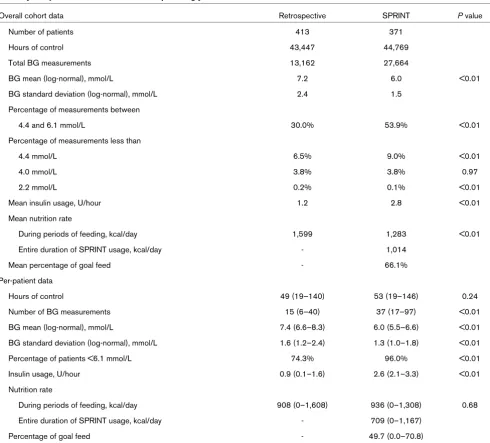
[image:4.612.58.560.323.708.2]Table 2 presents a comparison of glycaemic control for the 371 SPRINT protocol patients against the 413 patients from the retrospective cohort. Measurements (27,664) were recorded for more than 44,769 hours of patient control on SPRINT compared with 13,162 measurements for 43,447 recorded hours of retrospective data. Patients on SPRINT had
Table 1
Comparison of SPRINT and retrospective cohort baseline variables
Overall
Retrospective SPRINT P value
Total patients 413 371
Age, years 64 (53–74) 65 (49–74) 0.53
Percentage of males 59.1% 63.6% 0.19
APACHE II score 18 (15–23) 18 (15–24) 0.50
APACHE II risk of death 28.5% (14.2%-49.7%) 25.7% (13.1%-49.4%) 0.39
Diabetic history 71 (17.2%) 62 (16.7%) 0.86
APACHE III diagnosis
Operative Number of patients Percentage Number of patients Percentage P value
Cardiovascular 99 24% 76 20% 0.24
Respiratory 10 2% 9 2% 1.00
Gastrointestinal 53 13% 60 16% 0.18
Neurological 9 2% 7 2% 0.77
Trauma 8 2% 14 4% 0.12
Other (renal, metabolic, orthopaedic) 4 1% 4 1% 0.88
Non-operative Number of patients Percentage Number of patients Percentage P value
Cardiovascular 41 10% 39 11% 0.79
Respiratory 77 19% 66 18% 0.76
Gastrointestinal 7 2% 10 3% 0.34
Neurological 33 8% 20 5% 0.15
Trauma 29 7% 32 9% 0.40
Sepsis 29 7% 17 5% 0.15
Other (renal, metabolic, orthopaedic) 14 3% 17 5% 0.39
their blood glucose measured every hour during 24% of their time on the protocol and every 2 hours over the remaining 76% where there was improved glycaemic stability. Log-nor-mal mean blood glucose levels in the SPRINT cohort for hourly and 2-hourly measurements were 6.3 mmol/L (standard devi-ation 1.6 mmol/L) and 5.6 mmol/L (standard devidevi-ation 1.1 mmol/L), respectively. The mean time between measurements in the SPRINT cohort was 1 hour 36 minutes compared with 3 hours 18 minutes for the retrospective cohort. The precision of the recordkeeping system in the Christchurch ICU is to the nearest hour, and nursing staff typically measured blood glu-cose and used the protocol on the hour.
[image:5.612.62.552.264.707.2]The percentage time in the 4.4 to 6.1 mmol/L band defined by van den Berghe and colleagues [2,13] was 53.9% compared with 30.0% in the retrospective cohort. Hypoglycaemia was comparable to the retrospective cohort, with only 0.1% of measurements less than 2.2 mmol/L. SPRINT had a higher proportion of measurements below the 4.4 mmol/L limit; how-ever, the two cohorts were comparable for measurements below the 4.0 mmol/L lower limit of the SPRINT target band. Per-patient results show that the mean and standard deviation of blood glucose for SPRINT are lower. Additionally, the inter-quartile range for both metrics amongst patients is tighter and thus there is less variability in glycaemic control performance
Table 2
Summary comparison of SPRINT and retrospective glycaemic control
Overall cohort data Retrospective SPRINT P value
Number of patients 413 371
Hours of control 43,447 44,769
Total BG measurements 13,162 27,664
BG mean (log-normal), mmol/L 7.2 6.0 <0.01
BG standard deviation (log-normal), mmol/L 2.4 1.5
Percentage of measurements between
4.4 and 6.1 mmol/L 30.0% 53.9% <0.01
Percentage of measurements less than
4.4 mmol/L 6.5% 9.0% <0.01
4.0 mmol/L 3.8% 3.8% 0.97
2.2 mmol/L 0.2% 0.1% <0.01
Mean insulin usage, U/hour 1.2 2.8 <0.01
Mean nutrition rate
During periods of feeding, kcal/day 1,599 1,283 <0.01
Entire duration of SPRINT usage, kcal/day - 1,014
Mean percentage of goal feed - 66.1%
Per-patient data
Hours of control 49 (19–140) 53 (19–146) 0.24
Number of BG measurements 15 (6–40) 37 (17–97) <0.01
BG mean (log-normal), mmol/L 7.4 (6.6–8.3) 6.0 (5.5–6.6) <0.01
BG standard deviation (log-normal), mmol/L 1.6 (1.2–2.4) 1.3 (1.0–1.8) <0.01
Percentage of patients <6.1 mmol/L 74.3% 96.0% <0.01
Insulin usage, U/hour 0.9 (0.1–1.6) 2.6 (2.1–3.3) <0.01
Nutrition rate
During periods of feeding, kcal/day 908 (0–1,608) 936 (0–1,308) 0.68
Entire duration of SPRINT usage, kcal/day - 709 (0–1,167)
Percentage of goal feed - 49.7 (0.0–70.8)
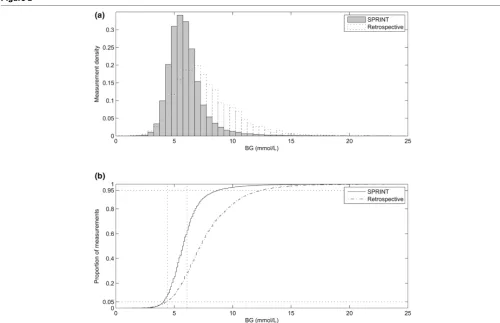
between patients. Figure 2 shows a tightly controlled distribu-tion of blood glucose measurements for all patients along with the 4.4–6.1 mmol/L range.
[image:6.612.55.555.350.673.2]The mean overall hourly insulin usage on SPRINT was 2.8 U/ hour, which is a level that avoids insulin saturation effects [29,30,43]. The median feed level recommended by SPRINT was 66.1% of the patient-specific goal feed [42]. The mean overall nutrition rate was 1,283 kcal/day on SPRINT during periods when the patients was being fed, including via the parenteral route, compared with 1,599 kcal/day for the retro-spective cohort. The mean nutrition rate over the entire length of stay, including periods in which feed was stopped for rea-sons outside glycaemic control, was 1,014 kcal/day on SPRINT. When no enteral or parenteral nutrition was recorded in the retrospective cohort data, it was not clear whether the nutrition administration was halted for clinical reasons or because the patient had begun eating meals. Thus, a nutrition comparison with the retrospective cohort was possible only for periods when the patient was receiving enteral or parenteral alimentation.
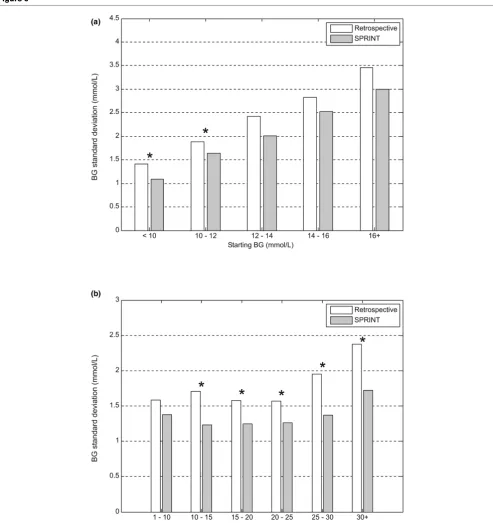
Figures 3 to 5 show the average percentage of measurements in the 4.4 to 6.1 mmol/L band, the average blood glucose con-centration, and the average blood glucose standard deviation for patients grouped by starting blood glucose level and APACHE II score. The percentage of measurements in the tar-get band was 66% to 203% higher and the blood glucose standard deviation was 6% to 30% lower on SPRINT com-pared with the retrospective cohort.
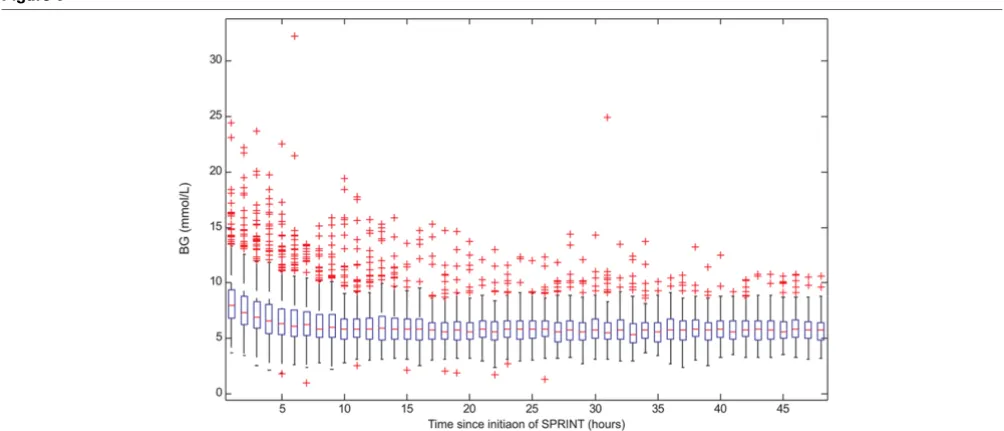
Figure 6 shows the box-and-whisker plot of hourly blood glu-cose concentration for all patients over first 48 hours on SPRINT. After approximately 7 hours, the blood glucose median and spread reach their average levels. This level of control is essentially maintained for the remainder of the period. Table 3 shows that 96% of SPRINT patients reached the 6.1 mmol/L band from the initial hyperglycaemic state compared with only 74% of the retrospective hyperglycaemic patients. SPRINT, therefore, brings a patient under control within 7 to 8 hours and maintains a constant level of performance.
Figure 2
Comparison of distribution of all blood glucose measurements
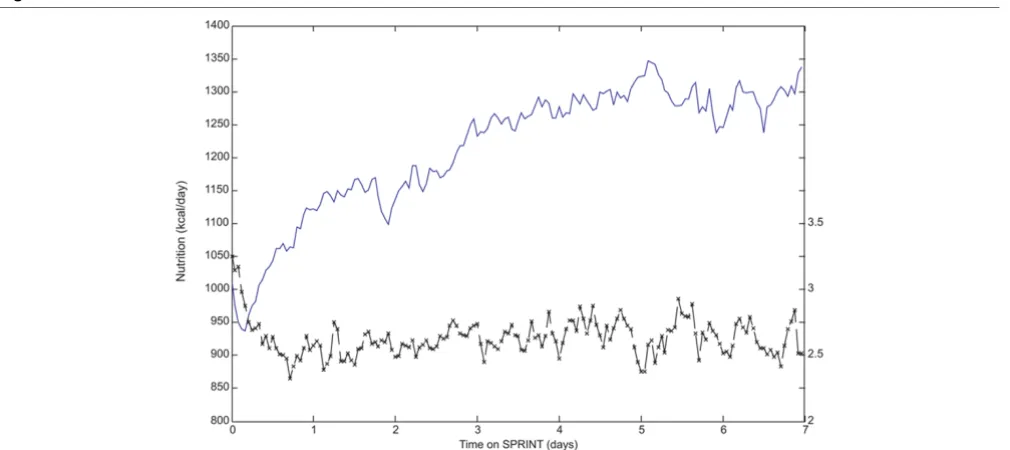
Figure 7 shows the average nutrition intake and insulin admin-istration rate for the first 7 days on the SPRINT protocol. The average nutrition intake is lower and the average insulin rate is higher during the initial phase of controlling hyperglycaemia. Once hyperglycaemia has been controlled, the average nutrition rate recommended by the protocol increases, generally as patient condition improves and carbohydrate
tol-erance increases, whilst average insulin administration rate remains relatively constant.
[image:7.612.52.553.86.603.2]Clinical outcomes
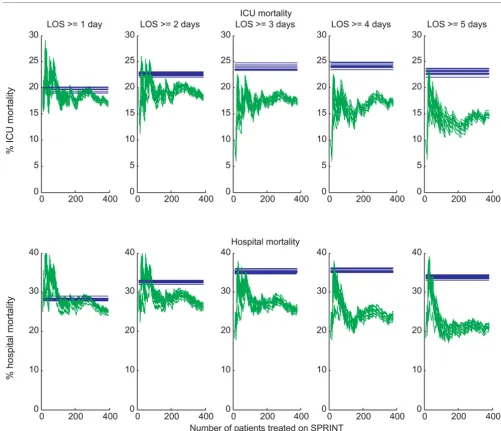
Figure 8 shows the percentage mortality for both the SPRINT and retrospective patients for both in-hospital and ICU
Figure 3
Grouped comparison of percentage of measurements in the 4.4 to 6.1 mmol/L band
[image:7.612.143.468.340.598.2]mortality, grouped by length of ICU stay, for several iterations of the cohort selection procedure described in Figure 1.
Table 3 shows the change in mortality, both in-ICU and in-hos-pital, for patients with lengths of stay of at least 1 to 5 days,
compared with the retrospective cohort using the chi-square test, for the median iteration of the cohort selection procedure. As length of ICU stay increases, the reduction in mortality becomes statistically stronger. Statistical significance (P <
Figure 4
Grouped comparison of average blood glucose level (log-normal)
[image:8.612.144.462.279.614.2]0.05) is achieved for an ICU stay of 3 days or longer for in-hos-pital mortality.
Several recent studies have identified hyperglycaemia as a risk factor for mortality in critical care [1,2,19,46-48]. Table 4
[image:9.612.59.552.90.613.2]com-pares average blood glucose, maximum blood glucose, and range of blood glucose between SPRINT ICU survivors and non-survivors by means of the Mann-Whitney test. There is no statistically significant difference between survivors and non-survivors for any of these glycaemic metrics.
Figure 5
Grouped comparison of blood glucose standard deviation (log-normal)
Discussion
High levels of control were achieved on a patient cohort with relatively severe medical conditions compared with other stud-ies. The median APACHE II score was 18, which is higher than some previous intensive insulin clinical studies whose
APACHE II medians or averages were 9 [2,13] and 16.9 [15]. Higher APACHE II scores are a general indicator of increased insulin resistance [15].
[image:10.612.55.557.91.306.2]The overall mean of 6.0 mmol/L with a standard deviation of
Figure 6
Hourly blood glucose average values for all patients on Specialised Relative Insulin Nutrition Tables (SPRINT)
Hourly blood glucose average values for all patients on Specialised Relative Insulin Nutrition Tables (SPRINT). Boxes represent the interquartile range (IQR) containing the median, whiskers represent 1.5 times the IQR, and crosses represent outlying measurements beyond this range. BG, blood glucose concentration.
Table 3
Significance of mortality difference between SPRINT and retrospective cohorts grouped by length of intensive care unit stay Intensive care unit mortality
Retrospective SPRINT Percentage change (relative) P value
LOS ≥ 1 day 18.6% 16.8% -10% 0.523
LOS ≥ 2 days 20.7% 17.9% -14% 0.403
LOS ≥ 3 days 22.0% 16.9% -23% 0.177
LOS ≥ 4 days 22.7% 16.6% -27% 0.130
LOS ≥ 5 days 21.1% 13.9% -34% 0.087
Hospital mortality
Retrospective SPRINT Percentage change (relative) P value
LOS ≥ 1 day 27.4% 24.9% -9% 0.457
LOS ≥ 2 days 31.6% 26.3% -17% 0.170
LOS ≥ 3 days 34.1% 25.4% -26% 0.045
LOS ≥ 4 days 34.3% 23.5% -32% 0.020
LOS ≥ 5 days 31.9% 20.6% -35% 0.019
[image:10.612.57.555.459.696.2]1.5 mmol/L compares well with the 5.7 ± 1.0 mmol/L value of van den Berghe and colleagues [2], who studied a much less ill cohort. Similarly, it is lower than the 7.3 ± 3.4 mmol/L result reported by Krinsley [15] for a less critically ill cohort. Finally, it is similar to the 6.0 ± 1.3 mmol/L reported by van den Berghe and colleagues [14], who reported an average APACHE II score of 24. It is also important to note that van den Berghe and colleagues [14] reported only mean morning glucose, which a recent large study showed to be significantly lower than other daily measurements [49], thus possibly minimising the variation reported.
SPRINT was implemented as a clinical practice change and thus only a comparison with retrospective data was possible. A limitation of this study is that the SPRINT and retrospective groups were comparable only on a cohort-wide basis. How-ever, as shown in Figure 8, there is a strong signal for the reduction in mortality following the introduction of a high-per-formance glycaemic control protocol. Mortality reductions were statistically stronger for patients who stayed in the ICU for increasingly longer periods. The plots of Figure 8 indicate a trend toward a steady-state reduction in mortality, particu-larly for patients with longer ICU stays, and show that greater statistical significance may be reached with a larger cohort, which agrees with the results of van den Berghe and col-leagues [2].
Figures 2 and 6 show that as mean blood glucose decreases the lower 5% limit of measurements does not appreciably drop, indicating that control is not simply shifting blood glu-cose lower but is also tightening the spread and thus minimising the risk of hypoglycaemic events. Table 2 shows
that 0.1% (n = 24) of measurements were less than or equal to 2.2 mmol/L, with only 20 (5.2%) patients experiencing one or more such measurements. Thus, lower and tighter glycae-mia was achieved without increasing the risk of hypoglycaemia.
Time in a relevant glycaemic band can provide a more robust description of control performance than an average glycaemic value. This result is consistent across all starting blood glu-cose ranges and APACHE II scores shown in Figures 3 to 5 and emphasises the consistency of control achieved under varying patient conditions. Grouping patients by these metrics enables comparisons between more similar groups.
The mean nutrition rate puts the caloric intake of 1,283 kcal/ day on SPRINT in the middle tertile of the ACCP guidelines reported by Krishnan and colleagues [10] to be optimal for mortality outcome. The median per-patient average nutrition rates were similar for the SPRINT and the retrospective cohorts.
[image:11.612.57.562.92.317.2]Table 4 shows that SPRINT has removed glycaemia as a sta-tistically correlated risk factor of ICU mortality. In the retrospective cohort, maximum blood glucose and range of blood glucose were still associated with mortality. Additionally, APACHE II score was significantly higher in non-survivors for both cohorts. The APACHE II risk of death (which depends upon diagnosis) was also higher in non-survivors than survi-vors, with a median risk of death of 50% versus 23% in non-survivors versus non-survivors on SPRINT. There was no signifi-cant difference in percentage of goal feed rates between sur-vivors and non-sursur-vivors for the SPRINT cohort.
Figure 7
Average nutrition and insulin administration rates for the first 7 days on Specialised Relative Insulin Nutrition Tables (SPRINT)
A recent review of published insulin-based glycaemic control protocols in intensive care identified protocols that adjusted insulin infusion based on frequently measured changes in blood glucose concentration as providing the best control [50]. SPRINT is derived from a model-based controller that incorporates non-linear insulin transport and glucose removal kinetics. Thus, it was identified in simulation that, in addition to insulin usage, feed modulation is required for ideal control [27]. SPRINT uses the absolute blood glucose level, change in blood glucose level, and current insulin and nutrition administration rates to identify effectively the patient's insulin sensitivity and respond accordingly. The unique wheel-based
design of SPRINT allows all of these metrics to be incorpo-rated into an essentially nurse-automated protocol.
[image:12.612.53.554.93.524.2]The paper-based design of the SPRINT system allowed for rel-atively easy adoption into the Christchurch ICU, which does not typically have suitable bedside computing resources avail-able. Computerised methods can have several advantages over paper-based systems. The SPRINT wheels are discretised to increments of 1 U of insulin and 10% of the goal feed to provide a design that is compact and easy-to-use, whereas a computer implementation could allow more refined dosing recommendations. Complete electronic recordkeeping
Figure 8
Comparison of intensive care unit (ICU) mortality and in-hospital mortality between Specialised Relative Insulin Nutrition Tables (SPRINT) and retro-spective patients for several iterations of the patient selection procedure detailed in Figure 1
is also possible on computerised systems, which can assist in measuring protocol compliance.
SPRINT is fully implemented by nursing staff without additional clinical intervention or modification. We believe that the fre-quent blood glucose measurement required by SPRINT is jus-tified as the protocol prescribes definitive actions and provides tight safe results. Hence, it outlines what to do under most or all conceivable scenarios, limiting the need for the cli-nician intervention or modification seen in other protocols.
Conclusion
SPRINT was implemented as a clinical practice change and achieved an average blood glucose level of 6.0 ± 1.5 mmol/L, with 53.9% of measurements in the 4.4 to 6.1 mmol/L band over a general ICU cohort. Reductions in ICU and hospital mortality rates were observed in comparison with a retrospec-tive cohort. Risk factors such as maximum blood glucose and range of blood glucose were no longer associated with sur-vival under SPRINT.
Competing interests
JGC and GS hold shares in Intersection LifeSciences (Christchurch, New Zealand). JL, T Lonergan, and T Lotz have been employees of Intersection LifeSciences since April
2007. Portions of the SPRINT protocol are patent-pending in the US.
Authors' contributions
JGC helped conceive and develop the SPRINT protocol and helped draft the manuscript. GS helped conceive and develop the SPRINT protocol and assisted in implementing the
proto-Table 4
Comparison of statistical significance for patient risk variables between survivors and non-survivors
Survivors Non-survivors P value
SPRINT cohort n = 310 n = 61
Average BG, mmol/L 6.1 (5.6–6.6) 5.9 (5.5–6.5) 0.55a
Maximum BG, mmol/L 9.9 (8.6–11.8) 10.4 (8.5–12.1) 0.62a
BG range, mmol/L 6.1 (4.7–8.1) 6.5 (5.0–8.8) 0.35a
APACHE II score 18.0 (14.0–22.0) 25.0 (18.0–30.3) <0.01a
APACHE II risk of death 23% (12%-41%) 50% (26%-71%) <0.01a
Average percentage goal feed 48% (0%-71%) 54% (29%-68%) 0.42a
Average hourly insulin, U/hour 2.7 (2.2–3.3) 2.5 (2.1–3.2) 0.65a
Diabetic history 56 (18.1%) 6 (9.8%) 0.12b
Retrospective cohort n = 336 n = 77
Average BG, mmol/L 7.5 (6.6–8.4) 7.3 (6.6–8.3) 0.83a
Maximum BG, mmol/L 10.5 (9.4–12.6) 11.3 (10.0–13.6) 0.04a
BG range, mmol/L 5.8 (3.8–8.6) 6.8 (4.7–9.5) 0.05a
APACHE II score 18.0 (15.0–22.0) 24.0 (18.8–29.0) <0.01a
APACHE II risk of death 25% (13%-43%) 51% (23%-67%) <0.01a
Average hourly insulin, U/hour 0.8 (0.0–1.7) 1.0 (0.5–1.5) 0.33a
Diabetic history 58 (17.3%) 13 (16.9%) 0.94b
Statistical significance was tested for average, maximum and range of blood glucose, APACHE II score, average feed rate, and diabetic history between SPRINT intensive care unit survivors and mortalities. Data are expressed as number (percentage) or per-patient median (interquartile range) where appropriate. aMann-Whitney U test; bchi-square test. APACHE, Acute Physiology And Chronic Health Evaluation; BG, blood glucose concentration; SPRINT, Specialised Relative Insulin Nutrition Tables.
Key messages
• High-performance glycaemic control can be achieved with a simple nurse-automated protocol.
• Modulating both insulin and nutrition in tandem can achieve tight consistent glucose control.
• Reductions in mortality for longer-stay (>3 days) patients suggest that tight control improves outcomes.
• The maximum and range of blood glucose measure-ments were no longer correlated with mortality, due to tight control removing these glucose metrics as indica-tors of outcome.
[image:13.612.58.555.115.401.2]col in the Christchurch ICU. ALC helped conceive and develop the SPRINT protocol, assisted in data collection and the analysis and interpretation of the data, and helped draft the manuscript. T Lonergan and MW helped conceive and develop the SPRINT protocol. XWW, JL, and T Lotz assisted in data collection and the analysis and interpretation of the data. DL provided statistical assistance. CH provided mathematical assistance during the development of SPRINT. All authors read and approved the final manuscript.
Acknowledgements
GS and JGC received financial support from the Christchurch ICU Trust and have provided personal funding support. ALC received financial support from the New Zealand Tertiary Education Commission, a Uni-versity of Otago Internal Studentship Grant, and the Canterbury Inten-sive Care Education and Research Trust. T Lonergan received financial support from a University of Otago Internal Studentship Grant and the Canterbury Intensive Care Education and Research Trust. MW received financial support from the Canterbury Intensive Care Education and Research Trust. XWW received financial support from the New Zealand Tertiary Education Commission. JL received financial support from the New Zealand Tertiary Education Commission and a University of Otago Internal Studentship Grant. T Lotz received financial support from the Canterbury Intensive Care Education and Research Trust and a Univer-sity of Canterbury Doctoral Scholarship.
References
1. Capes SE, Hunt D, Malmberg K, Gerstein HC: Stress hypergly-caemia and increased risk of death after myocardial infarction in patients with and without diabetes: a systematic overview. Lancet 2000, 355:773-778.
2. Berghe G Van den, Wouters P, Weekers F, Verwaest C, Bruyn-inckx F, Schetz M, Vlasselaers D, Ferdinande P, Lauwers P, Bouil-lon R: Intensive insulin therapy in the critically ill patients. N Engl J Med 2001, 345:1359-1367.
3. Mizock BA: Alterations in fuel metabolism in critical illness: hyperglycaemia. Best Pract Res Clin Endocrinol Metab 2001, 15:533-551.
4. McCowen KC, Malhotra A, Bistrian BR: Stress-induced hyperglycemia. Crit Care Clin 2001, 17:107-124.
5. Patino JF, de Pimiento SE, Vergara A, Savino P, Rodriguez M, Escallon J: Hypocaloric support in the critically ill. World J Surg 1999, 23:553-559.
6. Weissman C: Nutrition in the intensive care unit. Crit Care 1999, 3:R67-75.
7. Woolfson AM: Control of blood glucose during nutritional sup-port in ill patients. Intensive Care Med 1980, 7:11-14. 8. Ahrens CL, Barletta JF, Kanji S, Tyburski JG, Wilson RF, Janisse JJ,
Devlin JW: Effect of low-calorie parenteral nutrition on the inci-dence and severity of hyperglycemia in surgical patients: a randomized, controlled trial. Crit Care Med 2005, 33:2507-2512.
9. Kim H, Son E, Kim J, Choi K, Kim C, Shin W, Suh O: Association of hyperglycemia and markers of hepatic dysfunction with dextrose infusion rates in Korean patients receiving total parenteral nutrition. Am J Health Syst Pharm 2003, 60:1760-1766.
10. Krishnan JA, Parce PB, Martinez A, Diette GB, Brower RG: Caloric intake in medical ICU patients: consistency of care with guide-lines and relationship to clinical outcomes. Chest 2003, 124:297-305.
11. Bistrian BR: Hyperglycemia and infection: which is the chicken and which is the egg? JPEN J Parenter Enteral Nutr 2001, 25:180-181.
12. Diringer MN: Improved outcome with aggressive treatment of hyperglycemia – Hype or hope? Neurology 2005, 64:1330-1331.
13. Berghe G Van den, Wouters PJ, Bouillon R, Weekers F, Verwaest C, Schetz M, Vlasselaers D, Ferdinande P, Lauwers P: Outcome benefit of intensive insulin therapy in the critically ill: Insulin dose versus glycemic control. Crit Care Med 2003, 31:359-366.
14. Berghe G Van den, Wilmer A, Hermans G, Meersseman W, Wout-ers PJ, Milants I, Van Wijngaerden E, BobbaWout-ers H, Bouillon R: Intensive insulin therapy in the medical ICU. N Engl J Med 2006, 354:449-461.
15. Krinsley JS: Decreased mortality of critically ill patients with the use of an intensive glycemic management protocol. Crit Care Med 2003, 31:A19.
16. Krinsley JS: Effect of an intensive glucose management proto-col on the mortality of critically ill adult patients. Mayo Clin Proc 2004, 79:992-1000.
17. Krinsley JS, Jones RL: Cost analysis of intensive glycemic con-trol in critically ill adult patients. Chest 2006, 129:644-650. 18. Berghe G Van den, Wouters PJ, Kesteloot K, Hilleman DE:
Analy-sis of healthcare resource utilization with intensive insulin therapy in critically ill patients. Crit Care Med 2006, 34:612-616.
19. Egi M, Bellomo R, Stachowski E, French CJ, Hart G: Variability of blood glucose concentration and short-term mortality in criti-cally ill patients. Anesthesiology 2006, 105:244-252.
20. Chase JG, Hann CE, Shaw GM, Wong XW, Lin J, Lotz T, Le Compte AJ, Lonergan T: An overview of glycemic control in crit-ical care – relating performance and clincrit-ical results. Journal of Diabetes Science and Technology 2007, 1:82-91.
21. Chase JG, Shaw GM, Lin J, Doran CV, Hann C, Robertson MB, Browne PM, Lotz T, Wake GC, Broughton B: Adaptive bolus-based targeted glucose regulation of hyperglycaemia in criti-cal care. Med Eng Phys 2005, 27:1-11.
22. Plank J, Blaha J, Cordingley J, Wilinska ME, Chassin LJ, Morgan C, Squire S, Haluzik M, Kremen J, Svacina S, et al.: Multicentric, ran-domized, controlled trial to evaluate blood glucose control by the model predictive control algorithm versus routine glucose management protocols in intensive care unit patients. Diabe-tes Care 2006, 29:271-276.
23. Chase JG, Shaw GM, Lin J, Doran CV, Hann C, Lotz T, Wake GC, Broughton B: Targeted glycemic reduction in critical care using closed-loop control. Diabetes Technol Ther 2005, 7:274-282. 24. Chee F, Fernando TL, Savkin AV, van Heeden V: Expert PID
con-trol system for blood glucose concon-trol in critically ill patients. IEEE Trans Inf Technol Biomed 2003, 7:419-425.
25. Chee F, Fernando T, van Heerden PV: Closed-loop control of blood glucose levels in critically ill patients. Anaesth Intensive Care 2002, 30:295-307.
26. Shaw GM, Chase JG, Wong J, Lin J, Lotz T, Le Compte AJ, Loner-gan TR, Willacy MB, Hann CE: Rethinking glycaemic control in critical illness – from concept to clinical practice change. Crit Care Resusc 2006, 8:90-99.
27. Lonergan T, LeCompte A, Willacy M, Chase JG, Shaw GM, Wong XW, Lotz T, Lin J, Hann CE: A simple insulin-nutrition protocol for tight glycemic control in critical illness: development and protocol comparison. Diabetes Technol Ther 2006, 8:191-206. 28. Chase J, Shaw GM, Wong XW, Lotz T, Lin J, Hann CE: Model-based glycaemic control in critical care – a review of the state of the possible. Biomedical Signal Processing and Control 2006, 1:3-21.
29. Prigeon RL, Roder ME, Porte D Jr, Kahn SE: The effect of insulin dose on the measurement of insulin sensitivity by the minimal model technique. Evidence for saturable insulin transport in humans. J Clin Invest 1996, 97:501-507.
30. Natali A, Gastaldelli A, Camastra S, Sironi AM, Toschi E, Masoni A, Ferrannini E, Mari A: Dose-response characteristics of insulin action on glucose metabolism: a non-steady-state approach. Am J Physiol Endocrinol Metab 2000, 278:E794-801.
31. Bland DK, Fankhanel Y, Langford E, Lee M, Lee SW, Maloney C, Rogers M, Zimmerman G: Intensive versus modified conven-tional control of blood glucose level in medical intensive care patients: a pilot study. Am J Crit Care 2005, 14:370-376. 32. Gale SC, Gracias VH: Glycemic control needs a standard
refer-ence point. Critical care medicine 2006, 34:1856-1857. 33. Mackenzie I, Ingle S, Zaidi S, Buczaski S: Tight glycaemic
34. Schultz MJ, Spronk PE, Moeniralam HS: Tight glycaemic control: a survey of intensive care practice in the Netherlands. Inten-sive Care Med 2006, 32:618-619.
35. Cerra FB, Benitez MR, Blackburn GL, Irwin RS, Jeejeebhoy K, Katz DP, Pingleton SK, Pomposelli J, Rombeau JL, Shronts E, et al.: Applied nutrition in ICU patients. A consensus statement of the American College of Chest Physicians. Chest 1997, 111:769-778.
36. Wong XW, Singh-Levett I, Hollingsworth LJ, Shaw GM, Hann CE, Lotz T, Lin J, Wong OS, Chase JG: A novel, model-based insulin and nutrition delivery controller for glycemic regulation in crit-ically ill patients. Diabetes Technol Ther 2006, 8:174-190. 37. Wong XW, Chase JG, Shaw GM, Hann CE, Lotz T, Lin J,
Singh-Levett I, Hollingsworth LJ, Wong OS, Andreassen S: Model pre-dictive glycaemic regulation in critical illness using insulin and nutrition input: a pilot study. Med Eng Phys 2006, 28:665-681. 38. Hann CE, Chase JG, Lin J, Lotz T, Doran CV, Shaw GM: Integral-based parameter identification for long-term dynamic verifica-tion of a glucose-insulin system model. Comput Methods Pro-grams Biomed 2005, 77:259-270.
39. Doran CV: Modelling and control of hyperglycemia in critical care patients. In Master's thesis University of Canterbury, Mechanical Engineering; 2004.
40. Shaw GM, Chase JG, Lee DS, Bloomfield M, Doran CV, Lin J, Lotz T: Peak and range of blood glucose are also associated with ICU mortality. Critical Care Medicine 2005, 32:A125.
41. Lotz T, Chase J, McAuley K, Lee D, Lin J, Hann C, Mann JI: Tran-sient and steady state euglycemic clamp validation of a model for glycemic control and insulin sensitivity testing. Diabetes Technol Ther 2006, 8:338-346.
42. Lonergan T, Le Compte A, Willacy M, Chase JG, Shaw GM, Hann CE, Lotz T, Lin J, Wong XW: A pilot study of the SPRINT proto-col for tight glycemic control in critically Ill patients. Diabetes Technol Ther 2006, 8:449-462.
43. Chase JG, Shaw GM, Lin J, Doran CV, Bloomfield M, Wake GC, Broughton B, Hann C, Lotz T: Impact of insulin-stimulated glu-cose removal saturation on dynamic modelling and control of hyperglycaemia. International Journal of Intelligent Systems Technologies and Applications (IJISTA) 2004, 1:79-94. 44. RESOURCE® Diabetic nutrition information
[http:www.novartisnutrition.com/au/productDe tail?id=439&source=summary]
45. Rubinson L, Diette GB, Song X, Brower RG, Krishnan JA: Low caloric intake is associated with nosocomial bloodstream infections in patients in the medical intensive care unit. Crit Care Med 2004, 32:350-357.
46. Krinsley JS: Association between hyperglycemia and increased hospital mortality in a heterogeneous population of critically ill patients. Mayo Clin Proc 2003, 78:1471-1478.
47. Finney SJ, Zekveld C, Elia A, Evans TW: Glucose control and mortality in critically ill patients. Jama 2003, 290:2041-2047. 48. Laird AM, Miller PR, Kilgo PD, Meredith JW, Chang MC:
Relation-ship of early hyperglycemia to mortality in trauma patients. J Trauma 2004, 56:1058-1062.
49. Egi M, Bellomo R, Stachowski E, French CJ, Hart G, Stow P: Cir-cadian rhythm of blood glucose values in critically ill patients. Crit Care Med 2007, 35:416-421.