Identification Of Material surfaces Using Grey Level Co-Occurrence
Matrix And Elman Neural Network
Abd Kadir Mahamad
1,a *Muhammad Affandi Bin Yusof
2,b, Sharifah Saon
3,cMusli Nizam Yahya
4,dand Fathin Liyana Zainudin
5,e1~5 Embedded Computing System, Faculty of Electrical and Electronic Engineering
Universiti Tun Hussein Onn Malaysia
86400 Parit Raja, Batu Pahat, Johor, Malaysia
a [email protected], b kadir, c sharifa, d [email protected],
e
Keywords: absorption coefficient, image processing, GLCM, ENN
Abstract. Material type absorption coefficient is one of the important parameter that used for acoustic room calculation. Currently, absorption coefficient is obtained by using impedance tube or resonance tube. Both techniques need long learning good skills, high cost equipment, and time consuming to conduct. This paper proposed a system distinguished absorption coefficient thru the material surface identification from digital images. The system was built by applying Grey Level Co-occurrence Matrices (GLCM) and Elman Neural Network (ENN). Result for the best mean squared error (MSE) was 4.62e-9 for training phase and 0.5084 for testing phase. Overall, the system is able to identify the material surfaces and thus directly obtain the absorption coefficient of the material without using any physical equipment as oppose to the current techniques.
Introduction
Via current techniques, absorption coefficient measurement is a task that proven to be challenging and time consuming. Absorption coefficient is mainly use in applications of room acoustic. One of the important parameter in distinguishing each absorption coefficient is the type of material used. From digital images, the proposed system tried to identify different material surfaces and thus immediately associate it to its unique absorption coefficient. The aim of this proposed system is to save time and cost in absorption coefficient measurement as well as smoothing the prediction process. Object recognition algorithms rely on matching or learning algorithms using appearance-based or feature-appearance-based technique. Common techniques include edges, gradients, and Histogram of Oriented Gradients (HOG). The Grey level Co-occurrence Matrices (GLCM) is one of the earliest methods for texture feature extraction proposed by Haralick et. al back in 1973.
The proposed system also needs a neural network for identification purpose. Neural Network is an information processing paradigm that is inspired by concept of biological nervous systems, specifically the brain. In this proposed system, Elman Neural Network (ENN) is applied for the classification purpose. When the best network is obtain after learning process is done, the systems manage to predict the material surface correctly.
Methodology
248 images of surfaces (120 images of concrete wall, 85 images of floor, and 43 images of ceiling) were captured at 6 different locations.
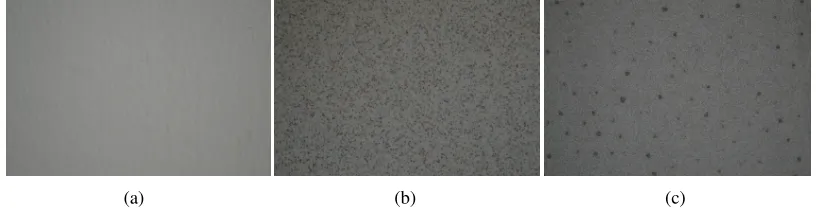
[image:2.612.102.511.110.214.2](a) (b) (c)
Fig. 1. Material Surface Image of (a) wall, (b) floor, and (c) ceiling.
Image Processing
RGB To Grey Image. The data collected were process from the RGB color image to grey color image first by the algorithm rgb2gray in MATLAB command.
Grey Level Co-Occurrence Matrices (GLCM). GLCM is sometimes known as Grey Tone Spatial Dependency Matrix [1-6]. It is a presentation of how frequent different combinations of pixel brightness values occur in an image. The pixels will form a square matrix that represents the level of gray. This texture feature analysis can be in a class of order. The first order texture measures are calculated from the original image values without considering the pixel neighbor relationships. For a second order, measurement includes the pixel neighbor relationship in original image between groups of two. While third and higher order textures are theoretical possible but not commonly implement due to calculation time and interpretation difficulty.
Data Limitation. The processed images obtain four data value for each Haralick features. By data limitation, the average value from 0, 45, 90 and 135 degree was taken. The purpose of limitation is to eliminate the out of range values that will give difficulties for the system to identify each data because of the similarities value for each type of material surfaces.
Elman Neural Network. Elman neural network (ENN) is a two layer back propagation network with a feedback connection from output of the hidden layer to its input [3]. The feedback allows an ENN to recognize and generate temporal as well as spatial patterns. It is able to detect and generate time varying patterns because there is a feedback connection from the first layer output to first layer input [7-11].
For ENN learning algorithm, the Levenberg-Marquardt (trainlm) was chosen because of its efficiency and faster at learning. To obtain the optimum network with a satisfied result, a trial and error scheme was conducted by changing the number of nodes. The node that shows good performance result was selected and applied in the system.
Table 1. Absorption Coefficient Of Materials
Types Of Materials
Frequency
125Hz 250Hz 500Hz 500Hz 2000Hz 4000Hz
Wall (concrete) 0.01 0.01 0.015 0.02 0.02 0.02
Floor (tile) 0.01 0.01 0.01 0.01 0.02 0.02
[image:2.612.124.488.638.717.2]Absorption Coefficient. The absorption coefficient data need to be analyses as a reference to the system in identification of material. For example, the value of absorption coefficient for a wall, ceiling, door and other element need to be in the database. The value of texture features collected from the GLCM [12] can be a guide to analyses type of material that related to absorption coefficient. The absorption coefficient values for each material surface as in Table 1.
MATLAB Graphical User Interface. The graphical user interface (GUI) is the last part for this system to make it more friendly user. The GUI will help select, process, and display the obtain data in properly order.
Result and Analysis
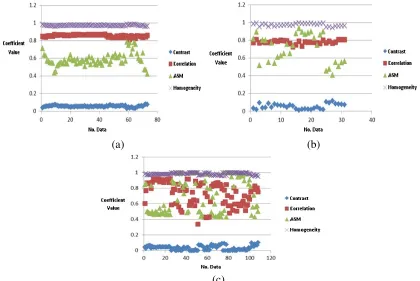
Distribution of Data. Each data coefficient shows difference in each value but still there are a few data coefficient that give almost similar value. In order to reduce complexity of inputs, only the dominant inputs are taken into account for training phase. Therefore, the 4 dominant and commonly use Haralick features; the contrast, correlation, homogeneity and angular second moment are applied for training. From Fig. 2, the data for correlation and angular second moment are mingling with one another and thus make it difficult for the network to distinguish one from another.
(a) (b)
[image:3.612.94.514.297.578.2](c)
Fig. 2. The graphs show the distribution data of contrast, correlation, angular second moment and homogeneity in (a) floor, (b) ceiling and (c) concrete wall.
in training and testing phase. Besides that, another experiment using 4 types of material surface that added wooden walls was also conducted. The distribution data of contrast, correlation, angular second moment and homogeneity of wooden wall surfaces are shown in Fig. 3.
[image:4.612.187.420.119.238.2].
Fig. 3. Graph of distribution data for wooden wall surface.
From the 4 surfaces material, the training phase of 14 inputs obtained MSE value of 0.0158 while MSE for testing phase is 1.25e03 using hidden node of 14. With 7 inputs, MSE value for training phase is 0.0421 and the MSE value for testing phase is 0.386 using hidden node of 7. For 4 inputs network, the MSE value for training phase is 0.103 and MSE value for testing phase is 0.1631 using hidden node of 4. The distribution data of the wooden wall characteristic are almost similar to the distribution data of the concrete wall making the network failed to learn properly. For a better performance result, the wooden wall is eliminated making the system works with only 3 types of material surfaces.
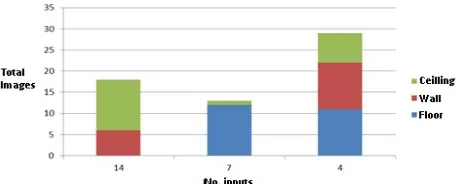
Furthermore, the complete system is tested with new data inputs. A total of 36 images were tested with the system to determine its efficiency. Images are divided into floor, wall and ceiling. Each category contains 12 images. The images were tested with 14, 7 and 4 inputs network. The total surfaces material success rate was determined as in Fig. 4.
Fig. 4. Graph achievement of network in identification images.
Based on the graph, 14 inputs network failed to identify the floor surface and only obtained success rate of 50%. For the 7 inputs network, the identification process failed to predict wall surface with a worse success rate of 36%. While the 4 inputs network was able to predict all 3 types of surfaces with success rate of 80%. Therefore, the network with 4 inputs gives the best identification results among the others.
Discussion
[image:4.612.191.420.433.525.2]network to differentiate the material surface more precisely due to only the dominant data is fed into the network. Using this method, the image parameters can be determined faster oppose to the conventional techniques. This system is useful for researchers, practical engineers and designers to estimate the absorption coefficient of material.
Conclusion
The practical system identification of material surfaces from the GLCM process and ENN application was developed. A good and stable system depends tremendously on a network that is able to produce a small MSE. From the experiment, a significant and small MSE value can be obtained if the number of inputs are less and dominant. The small number of inputs helps the system to operate efficiently. The close or similar data should undergo limitation to gain in range values of data. The good data quality helps the system in training to produce the better result.
References
[1] R.C. Gonzalez, R.E. Woods, S.L. Eddins, Digital Image Processing Using MATLAB, second ed., Gatesmark, Massachusetts, 2009.
[2] O. Marques, Practical Image and Video Processing Using MATLAB, John Wiley & Sons Inc., New Jersey, 2011.
[3] V. Bino Sebastian, A. Unnikrishnan, K. Balakrishnan, Grey Level Co-Occurence Matrices: Generalisation and Some New Features, International Journal Of Computer Science, Engineering and Information Technology, 2 (2012) 151-57.
[4] M. A. Tahir, A. Bouridane, F. Kurugollu and A. Amira, Accelerating The Computation Of GLCM And Haralick Texture Features On Reconfigurable Hardware, International Conference on Image Processing, 2004, pp. 2587-2860.
[5] P. Biswajit, B. Debajyoti, Texture Analysis Based On The Gray-Level Co-Occurrence Matrix Considering Possible Orientation, International Journal of Advance Research in Electrical, Electronics and Instrumentation Engineering, 2 (2013).
[6] A. Gebejes, Texture Characterization based on Grey Level Co-occurrence Matrix, Conference of Informatics and Management Sciences, 2013, pp. 375-378.
[7] N.P. Padhy, Artificial Intelligence and Intelligent Systems, fourth ed., Oxford University Press, 2005, pp. 400-448.
[8] Z. Zhang, Z.H. Tang, C. Vairappan, A Novel Learning Method for Elman Neural Network Using Local Search, Neural Information Processing, 11 (2007) 8.
[9] Z.H. Tang, R. Li, An Improved Neural Network Model and Its Applications, Journal of Information & Computional Science, 8 (2011) 1881-888.
[10] S. Asakawa, An Extention of Elman Network, Proceedings of the 9th International Conference on Cognitive Modeling, 2009, pp. 434-435.
[11] A.K. Mahamad, T. Hiyama, Improving Elman Network using Genetic Algorithm for Bearing Failure Diagnosis of Induction Motor, 7th IEEE International Symposium on Diagnostics for Electric Machines, Power Electronics and Drives, France, 2009.