International Journal of Emerging Technology and Advanced Engineering
Website: www.ijetae.com (ISSN 2250-2459, Volume 2, Issue 1, January 2012)324
An Improved Techniques Based on Naive Bayesian for
Attack Detection
1Mr. Manish Jain, 2Prof. Vineet Richariya
1M.Tech Scholar, Dept. of Information Technology, LNCT, Bhopal, India 2Head, PG Dept. of Information Technology, LNCT, Bhopal, India
Abstract-With the enormous growth of computer networks and the huge increase in the number of applications that rely on it, network security is gaining increasing importance. Moreover, almost all computer systems suffer from security vulnerabilities which are both technically difficult and economically costly to be solved by the manufacturers. Therefore, the role of Intrusion Detection Systems (IDSs), as special-purpose devices to detect anomalies and attacks in a network, is becoming more important. The naive Bayesian Classification is use for intrusion detection system. One of the most important deficiencies in the KDD99 data set is the huge number of redundant records, which causes the learning algorithms to be biased towards the frequent records, and thus prevent them from learning infrequent records, which are usually more harmful to networks such as U2R and R2L attacks.NSL KDD data set have less redundant record .In this paper one algorithm is use for ids naïve Bayesian classification.NSL KDD data set is firstly categorized into numeric form and fuzzy logic is use to fuzzyfied data and apply in all field and then feature is selected using information gain concept .according to best feature gain the reduce field is selected .the proposed algorithm achieved high detection rates (DR) and significant reduce false positives (FP) for different types of network intrusions using limited computational resources. Proposed Naïve Bayesian classifier gives higher detection rate and reduce false alarm.
Keywords-detection rate, false positive, fuzzy logic, naïve Bayesian, mat lab, IDS.
I.
I
NTRODUCTIONWith the tremendous growth of network-based services and sensitive information on networks, network security is getting more and more importance than ever. Intrusion poses a serious security risk in a network environment. The ever growing new intrusion type poses a serious problem for their detection.
The human labeling of the available network audit data instances is usually tedious, time consuming and expensive.
Intrusion detection system (IDS) is security tools that collect information from a variety of network sources, and
analyze the information for signs of network intrusions. IDS can be host-based or network-based systems [1]. Host-based IDS locates in servers to examine the internal interfaces, and network-based IDS monitors network packets to discover network intrusions. The success of an IDS can be characterized in both detection rates (DR) and false positives (FP) for different types of intrusions [2]. Ideally, IDS should have an attack detection rate of 100% along with false positive of 0%, which is really hard to achieve. Detection rate is the percentage of correctly identified true attacks by IDS, and false positive is alarm that rose by IDS for normal activities. Nowadays, data mining methods have become indispensable tools for analyzing large volume of network logs or audit data to identify the patterns of the normal behaviors and pattern of the intrusions in computer network that are useful in classifying network intrusions [3]-[4].
The main motivation of using data mining methods in intrusion detection is automation. Data mining technologies, such as decision tree (DT), naïve Bayesian classifier (NB), neural network (NN), support vector machine (SVM), k-nearest neighbors (KNN), fuzzy logic model, and genetic algorithm have been widely used to analyze network logs to gain intrusion related knowledge to improve the performance of IDS in last decades [5]-[6]. To apply data mining techniques in intrusion detection, first the collected network logs or audit data needs to be preprocessed and converted to the format that suitable for mining. Next, the reformatted data will be used to develop a clustering or classification model. Data mining provide decision support for intrusion management, and also help IDS for detecting new vulnerabilities and intrusions by discovering unknown patterns of attacks or intrusions.
International Journal of Emerging Technology and Advanced Engineering
Website: www.ijetae.com (ISSN 2250-2459, Volume 2, Issue 1, January 2012)325
a).Misuse-based IDSs are also called knowledge-base detection. The advantages of knowledge-based approaches are that they have a very good accuracy and very low false alarm rate. Furthermore, the analysis is detailed meaning that there is enough information about the type of detected attacks; thus, it is easier for the system administrator to take preventive and corrective action. On the contrary, drawbacks include the difficulty of gathering the required information on the known attacks and keeping it up-to-date with new vulnerabilities. Moreover, misuse-base IDSs are not complete, i.e., they do not have the ability to detect all types of attacks, especially new ones and those involving an abuse of privileges.
b) The second type of IDSs is anomaly detection or behavior-based detection. In this approach models of legitimate activities are built based on the normal data, and then the deviation from the normal model will be considered as an attack or anomaly. The main advantage of this approach over misuse detection is that it can detect attempts to exploit new and unforeseen vulnerabilities. It also can help detect “abuse of privileges" types of attacks that do not actually involve exploiting any security vulnerability. However, this approach has its own shortcomings. The main reported problem is high false alarm rate which is caused by two kinds of problems. The first one is the lack of a training data set that covers all the legitimate areas, and the other one is that abnormal behavior is not always an indicator of intrusions. It can happen as a result of factors such as policy changes or offering of new ser-vices by a site. Besides the aforementioned problem (high false alarm rate).
II.NSL KDD DATA SET
Before NSL KDD data set most of the investigators or researchers used KDD’99 data set for the investigation or detection of the intrusion, but the outcome of the KDD’99 data could not satisfy to the investigator or researchers. There are many problems in KDD’99 data set which has overcome by NSL KDD data set.
The NSL-KDD data set has the following advantages over the original KDD data set
1. NSL KDD data set does not include redundant records in the train set, so the classifiers will not be biased towards more frequent records.
2. There are no duplicate records in the proposed test sets; therefore, the performance of the learners is not biased by the methods which have better detection rates on the frequent records.
3. The number of selected records from each difficulty level group is inversely proportional to the percentage of records in the original KDD data set. As a result, the classification rates of distinct machine learning methods vary in a wider range, which makes it more efficient to have an accurate evaluation of different learning techniques.
4. The number of records in the train and test sets is reasonable, which makes it affordable to run the experiments on the complete set without the need to randomly select a small portion. Consequently, evaluation results of different research works will be consistent and comparable
III.
D
ATAP
REPROCESSINGAs intrusion detection system is a critical component of secure information systems examine all data features to detect intrusion. Some of the features may be redundant or be different scales therefore they need preprocessing.
NSL kdd data set have a different connection record all connection record have total 41 features.38 of these features are numeric and three of them are symbolic thus, we map symbolic-valued attributes to numeric-valued attributes. Symbolic features like protocol type (three different symbols–tcp, udp, icmp), service (73 different symbols), and flag (11 different symbols). Were mapped to integer values ranging from 1 to N where N is the number of symbols.
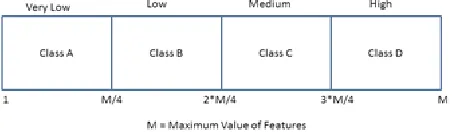
[image:2.612.331.557.610.676.2]NSL KDD data set have two types of data set train data and test data and these data is firstly converted into a numeric form according to range of interval . Range is defined according to class. It has different types of field attribute. These attribute have some numeric field and some symbolic type of field these field is firstly converted into a numeric form. According to this, first row is selected and find max value attribute, and these max value is divided into four equal intervals. These intervals define a class value. There are four classes, namely: very low, low, medium and high. In this logic, the data is converted into a categorical form and this is shown in fig 1
International Journal of Emerging Technology and Advanced Engineering
Website: www.ijetae.com (ISSN 2250-2459, Volume 2, Issue 1, January 2012)326
In this work we have taken four classes of the data, which are class A, class B, class C, and class D. We have mapped these classes with defined categories of the data set. In below table shows the mapping between classes and also shows the range of the classes.
Table I: Range of categorical data
NSL kdd data sets before fuzzyfied shown fig 2 and then fuzzy logic is apply in data set than data is converted into a categories .it is also shown below fig 3
0.0,tcp,aol,OTH,337.0,664.0,0.0,0.0,0.0,0.0,0.0,1.0,0.0,0.0, 0.0,0.0,0.0,0.0,0.0,0.0,0.0,0.0,2.0,24.0,0.0,0.0,0.0,0.0,1.0,0. 0,0.12,255.0,255.0,1.0,0.0,0.0,0.0,0.01,0.01,0.0,0.0,normal
0.0,tcp,aol,OTH,175337.0,0.0,0.0,0.0,0.0,0.0,0.0,1.0,0.0,0. 0,0.0,0.0,0.0,0.0,0.0,0.0,0.0,0.0,1.0,1.0,0.0,0.0,0.0,0.0,1.0,0 .0,0.0,99.0,133.0,0.75,0.04,0.75,0.02,0.01,0.0,0.0,0.0,norm al
Figure 2: Before fuzzyfied data sets
After Fuzzyfied data is
All 41 attribute is converted into categorical form
0 0 0 0 0 0 3 0 3 0 0 3 0 3 0 0 0 3 0 3 3 3 0 0 3 3 3 3 3 3 3 3 3 3 3 3 3 3 3 3 3
0 0 0 0 0 0 3 0 3 0 0 3 0 3 0 0 0 3 0 3 3 3 0 0 3 3 3 3 3 3 3 1 2 3 3 3 3 3 3 3 3
Figure 3: After Fuzzyfied data sets
IV. CLASSIFICATION
Classification defines the task of data analysis, where a model or a classifier is constructed to predict categorical labels. Classification can be described as a supervised learning algorithm in the machine learning process. In classification a given set of records is divided into training and test datasets.
The training dataset is used in building a Classification model, while test data is used in validating the data models. There are number of classification algorithms. In our experiment we are using three of them i.e. Naïve Bayesian and SVM.
A. Naive Bayesian Classifiers
Naïve Bayesian classifiers assume that the effect of an attribute value on a given class is independent of the values of the other attributes. This assumption is called class conditional independence. It is made to simplify the computations involved and, in this sense, is consider “Naive”. Naïve Bayesian classifiers allow the representation of dependencies among subsets of attributes [9]. Though the use of Bayesian networks has proved to be effective in certain situations, the results obtained are highly dependent on the assumptions about the behavior of the target system, and so a deviation in these hypotheses leads to detection errors, attributable to the model considered [10].
The naive Bayesian classifier works as follows:
1. Let T be a training set of samples, each with their class labels. There are k classes, . Each sample is represented by an n-dimensional vector
X = { }, depicting n measured values of the n attributes, , respectively.
2. Given a sample X, the classifier will predict that X belongs to the class having the highest a posteriori probability, conditioned on X. That is X is predicted to belong to the class if and only if
> for 1 ≤ j ≤ m, j≠ i.
Thus we find the class that maximizes . The class for which is maximized is called the maximum posteriori hypothesis. By Bayes’ theorem
3. As P(X) is the same for all classes, only
need be maximized. If the class a priori probabilities,
, are not known, then it is commonly assumed that the classes are equally likely, that is, = = . . . =
and we would therefore maximize
Otherwise we maximize . Note that the class a priori probabilities may be estimated by = | |/|D|, Where | | a number of training duple of class
Numeric Class
Categorical Defined Class
Range
Class A Very Low 1 to M/4 Class B Low M/4 to 2*m/4
International Journal of Emerging Technology and Advanced Engineering
Website: www.ijetae.com (ISSN 2250-2459, Volume 2, Issue 1, January 2012)327
4. Given data sets with many attributes, it would be computationally expensive to compute . In order to reduce computation in evaluating . The naive assumption of class conditional independence is made. This presumes that the values of the attributes are conditionally independent of one another, given the class label of the sample. Mathematically this means that
∑
The probabilities , , . . . , can easily be estimated from the training.
set. Recall that here refers to the value of attribute for sample X.
(a) If is categorical, then is the number of tuple of class in D having the value for attribute , divided by | |, the number of tuple of class i in D .
(b) If is continuous-valued, then we typically assume that the values have a Gaussian distribution with a mean µ and standard deviation σ defined by
√
So that
We need to compute , whither mean and standard deviation of values areas of attribute for training samples of class .
5. In order to predict the class label of X, is evaluated for each class . The classifier predicts that the class label of X is if and only if it is the class
that maximizes .
If and only if
> ( | ) ( ) For ≤ j ≤ m, j≠ i.
V.
I
NFORMATIONG
AINF
ORF
EATURESS
ELECTIONThe computation of the Information Gain for only one attribute according to the classes is given below: let s be a set of training set samples with their corresponding labels.
Suppose there are m classes and the training set contains si samples of class I and s is the total number of samples in the training set expected information needed to classify a given sample is calculated by [20]
2
1
( 1, 2....
)
log
m m
i
Si
Si
I S S
S
S
S
Feature F with values
f
1, 2, 3... }
f
f
f
v can divide thetraining data set into subsets
{ 1, 2, 3..., }
S S S
S
v where Sj is the subset which has the value fj for the feature F. Furthermore let Sj contain sij samples of class i. Entropy of the feature F is given in1 2 3
1 2 3 1
....
( ) ( , , ,.... )
m
j j j ij
j j j ij i
S S S S
E F I S S S S
S
Information gain for F can be calculated using
Gain F
( )
I S
( 1, 2....
S
S
m)
E F
( )
The value of the gain as given above computes the information gain of a feature F with regard to all the classes. If we want to measure the gain of the feature for a given class k, we shall consider the problem as a binary classification one. We consider two classes: the class normal (sk) and the remaining will constitute another class anomaly.
So the expected Information Gain needed to classify a given sample will be:
' '
' 2 2
( , ) klog ( k) k k log k k k
S S S S S
I S S
S s S S S
Where k’ denotes the complemented class of the class k. The entropy of a feature F according to the class k is
'
' 1
( )
(
,
)
m
kj k j
kj k j i
S
S
E F
I S
S
S
Information Gain for F can be calculated using
Gain F
( )
I S S
(
k,
k')
E F
( )
This gain measure gives the significance of the features. The following algorithm selects features which are greater than threshold value from the data set. Algorithm Feature Selection Using Information Gain F1 used to store selected set of features.
(2)
(3)
(4)
(5)
International Journal of Emerging Technology and Advanced Engineering
Website: www.ijetae.com (ISSN 2250-2459, Volume 2, Issue 1, January 2012)328
Initially it is empty and TH contains threshold value. F(I) contains ith feature of the data set
1. SF1= {};
2. For I= 1 to number of features in the data set 3. INF=compute Information Gain for the feature 4. Gain (I) =INF
5. end for
6. TH= threshold value
7. For I= 1 to number of features 8. if Gain(I)>TH then
9. SF1=SF1+F {I} 10. end if
11. end for 12.end
[image:5.612.333.556.161.450.2]Here we are applying the Feature Gain algorithm in NSL KDD data set, the feature gain is calculate for all 41 fields, as shown in the following table
Table II
Feature Gain of All 41 Features of NSL KDD Data Set
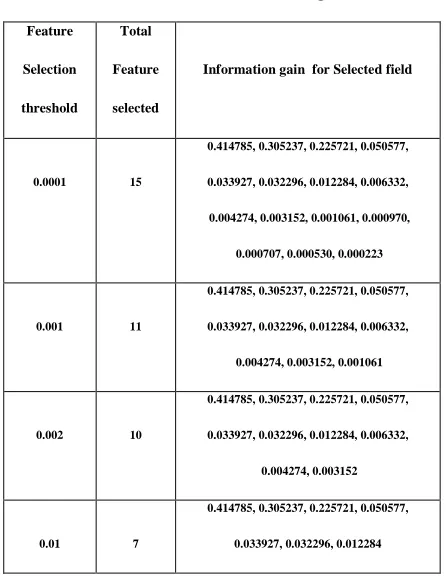
NSL kdd data set is applied into a information gain concept .than all 41 field gain is calculated according to gain. Feature compares the threshold label when the threshold label is less than to the gain feature than this NSL kdd data set is applied into a information gain concept .than all 41 field gain is calculated according to gain. Feature compares the threshold label when the threshold label is less than to the gain feature than this feature is selected by the information gain concept and all features gets the higher detection rate for NSL kdd data set. The selected feature shown below according to feature gain.
Table III
Selected feature information gain
Feature
Selection
threshold
Total
Feature
selected
Information gain for Selected field
0.0001 15
0.414785, 0.305237, 0.225721, 0.050577,
0.033927, 0.032296, 0.012284, 0.006332,
0.004274, 0.003152, 0.001061, 0.000970,
0.000707, 0.000530, 0.000223
0.001 11
0.414785, 0.305237, 0.225721, 0.050577,
0.033927, 0.032296, 0.012284, 0.006332,
0.004274, 0.003152, 0.001061
0.002 10
0.414785, 0.305237, 0.225721, 0.050577,
0.033927, 0.032296, 0.012284, 0.006332,
0.004274, 0.003152
0.01 7
0.414785, 0.305237, 0.225721, 0.050577,
0.033927, 0.032296, 0.012284
[image:5.612.48.282.370.547.2]And also the gain feature attribute value showed below table.
Table IV
Selected field attribute with higher information gain Feature Gain of 41 Features
Feature1 0.0339 Feature11 0.0063 Feature21 0 Feature31 0
Feature2 0 Feature12 0 Feature22 0 Feature32 0.2257
Feature3 0 Feature13 0.0005 Feature23 0.3052 Feature33 0.4148
Feature4 0 Feature14 0 Feature24 0.0506 Feature34 0
Feature5 0.0002 Feature15 0.0011 Feature25 0 Feature35 0
Feature6 0.0032 Feature16 0.0007 Feature26 0 Feature36 0
Feature7 0 Feature17 0.001 Feature27 0 Feature37 0
Feature8 0.0123 Feature18 0 Feature28 0 Feature38 0
Feature9 0 Feature19 0.0043 Feature29 0 Feature39 0
Feature10 0.0323 Feature20 0 Feature30 0 Feature40 0
Feature41 0
Feature
Selection
threshold
Total
Selected
feature
Selected attributes
0.0001 15 33,23,32,24,1,10,8,11,19,6,15,17, 16,13,5
0.001 11 33,23,32,24,1,10,8,11,19,6,15
0.002 10 33,23,32,24,1,10,8,11,19,6
[image:5.612.334.556.525.681.2]International Journal of Emerging Technology and Advanced Engineering
Website: www.ijetae.com (ISSN 2250-2459, Volume 2, Issue 1, January 2012)329
VI .
H
ARDWARER
EQUIREMENTA
NDA
NALYSIST
OOLIn our experiment, we have written a mat lab program for preprocessing the data we have also applied a layered approach for intrusion detection as a result we could generate for different layer for normal or attack The classes in NSL KDD99 dataset can be categorized into five main classes (one normal class and four main intrusion classes: probe, DOS, U2R, and R2L) [11].
a) Normal connections are generated by simulated daily user behavior such as downloading files, visiting web pages. b) Denial of Service (DoS) attack causes the computing
power or memory of a victim machine too busy or too full to handle legitimate requests. DoS attacks are classified based on the services that an attacker renders unavailable to legitimate users like apache2, land, mail bomb, back, etc.
c) Remote to User (R2L) is an attack that a remote user gains access of a local user/account by sending packets to a machine over a network communication, which include send-mail, and Xlock.
d) User to Root (U2R) is an attack that an intruder begins with the access of a normal user account and then becomes a root user by exploiting various vulnerabilities of the system. Most common exploits of U2R attacks are regular buffer-overflows, load-module, Fd-format, and Ffb-config.
e) Probing (Probe) is an attack that scans a network to gather information or find known vulnerabilities. An intruder with a map of machines and services that are available on a network can use the information to look for exploits.
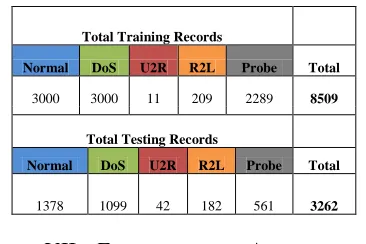
There are total 41 input attributes in NSL KDD99 dataset for each network connection that have either discrete or continuous values and divided into three groups. The first group of attributes is the basic features of network connection, which include the duration, prototype, service, number of bytes from source IP addresses or from destination IP addresses, and some flags in TCP connections. The second group of attributes in KDD99 is composed of the content features of network connections and the third group is composed of the statistical features that are computed either by a time window or a window of certain kind of connections. Table I shows the number of examples of 10% training data and 10% testing data in KDD99 dataset. There are some new attack examples in testing data, which is no present in the training data.
Table V
Number of examples in training and testing NSL kdd99 data
Total Training Records
Normal DoS U2R R2L Probe Total
3000 3000 11 209 2289 8509
Total Testing Records
Normal DoS U2R R2L Probe Total
1378 1099 42 182 561 3262
VII.
E
XPERIMENTALA
NALYSISIn order to evaluate the performance of proposed learning algorithm, we performed 5-class classification using KDD99 network intrusion detection benchmark dataset. All experiments were performed using an Intel Core 2 Duo Processor 2.0 GHz processor (2 MB Cache, 800 MHz FSB) with 1 GB of RAM. [13]The detection rates (DR) and false Positives (FP) are used to estimate the performance of IDS, which are given as bellow:
Detection Rate
(7)
False Positive
(8)
[image:6.612.352.535.186.308.2]The experimental results of proposed algorithm with naive Bayesian classifier (NB) are tabulated
Table VI Result Using 41 attributes
Methods Normal DoS U2R R2L Probe
Proposed Algorithm
(DR %) 58.71 99.90 100 98.64 99.64
Proposed Algorithm
(FAR %) 0.13 22.74 2.33 00 31.33
NB (DR %) 99.27 99.69 64.0 99.11 99.11
International Journal of Emerging Technology and Advanced Engineering
Website: www.ijetae.com (ISSN 2250-2459, Volume 2, Issue 1, January 2012)330
Table VII Results using 15 attributes
Methods Normal DoS U2R R2L Probe
Proposed Algorithm
(DR %) 99.63 99.81 100 98.90 99.64
Proposed Algorithm
(FAR %) 0.45 0.19 00 0.56 0.36
NB (DR %)
99.65 99.71 64.84 99.15 99.35
NB (FAR %)
0.06 0.04 0.12 6.87 0.49
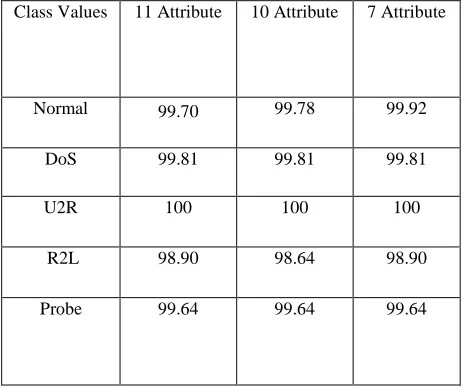
We also tested the performance of proposed algorithm Using the reduced dataset of 11, 10 and 7 attributes in NSL kdd99, which increase the detection rate that are summarized.
Table VIII
Experiment in selected dataset Detection rate (DR %)
Class Values 11 Attribute 10 Attribute 7 Attribute
Normal 99.70 99.78 99.92
DoS 99.81 99.81 99.81
U2R 100 100 100
R2L 98.90 98.64 98.90
[image:7.612.42.281.171.316.2]Probe 99.64 99.64 99.64
Table IX
Experiment in selected data set False alarm rate (FAR %)
Class Values 11 Attribute 10 Attribute 7 Attribute NORMAL 0.44 0.44 0.44
DOS 0.19 0.1 00 U2R 00 00 00 R2L 0.56 0.56 0.56 PROBE 0.18 0.18 0.18
VIII.
C
ONCLUSIONIntrusion detection using naive Bayesian classifier with Fuzzyfied logic the proposed algorithm is suitable for analyzing large number of network logs or audit data. It improves the performance of detection rates for different types of intrusions. The main propose of this paper is to improve the performance of naïve Bayesian classifier for intrusion detection. In this, we tested out Proposed algorithm on NSLKDD99 dataset that shows it maximized the balance detection rates for 4 attack classes in NSL KDD99 dataset and minimized false positives at acceptable level. The future work focus on apply this algorithm in real time network and ensemble with other data mining algorithms for improving the detection rates in intrusion detection.
References:
[1] R. Lippmann, J. W. Haines, D. J. Fried, J. Korba, and K. Das, “The 1999 DARPA off-line intrusion detection evaluation,” Computer networks: The International Journal of Computer and Telecommunications Networking, 34, 2000, pp. 579-595.
[2] M. Stillerman, C. Marceau, and M. Stillman, “Intrusion detection on distributed systems,” Communications of the ACM, 42(7), pp. 62-69.
[3] D. Barbara, J. Couto, S. Jajodia, L. Popyack, and N. Wu, “ADAM: Detecting intrusion by data mining,” IEEE Workshop on Information Assurance and Security, West Point, New York, June 5-6, 2001. .
[4] N.B. Amor, S. Benferhat, and Z. Elouedi, “Naïve Bayes vs. decision trees in intrusion detection systems,” In Proc. of 2004 ACM Symposium on Applied Computing, 2004, pp. 420-424.
[image:7.612.42.277.440.635.2]International Journal of Emerging Technology and Advanced Engineering
Website: www.ijetae.com (ISSN 2250-2459, Volume 2, Issue 1, January 2012)331
[6] J. Luo, and S.M. Bridges, “Mining fuzzy association rules and fuzzy frequency episodes for intrusion detection,” International Journal of Intelligent Systems, John Wiley & Sons, vol. 15, no. 8, 2000, pp. 687-703.
[7] A. B. M. S. Ali, A. Abraham. An Empirical Comparison of Kernel Selection for Support Vector Machines. 2nd International Conference on Hybrid Intelligent Systems: Design, anagement and Applications, The Netherlands, 2002
[8]Shilpa Lakhina, Sini Joseph and Bhupendra Verma, “Feature reduction using PCA for effective Anomaly-based intrusion detection on NSL-KDD”, Int. J. of engineering science and technology, 2010
[9]Jaiwei Han and Micheline Kamber, Elseiver book
[10] P.Garcia- Teodoro, J.Diaz- Verdejo, “Anomalyy network intrusion detection: Techniques, systems and challenges”, www.elsevier.com , 2009
[11]Dewan Md. Farid, Nouria Harbi, Suman Ahmmed, Md. Zahidur Rahman, and Chowdhury Mofizur Rahman, Mining Network Data for Intrusion Detection through Naïve Bayesian with Clustering World Academy of Science, Engineering and Technology 66 2010
[12] Fayyad.U.M, Piatetsky-Shapiro.G, and Smyth.P, .From data mining to knowledge discovery in databases. AI Magazine, vol. 17, no. 3, pp. 37.54, 1996
[13] Dewan Md. Farid, Nouria Harbi, Suman Ahmmed, Md. Zahidur Rahman, and Chowdhury Mofizur Rahman mining network data for intrusion detection through naïve bayesian with clustering World Academy of Science, Engineering and Technology 66 2010
[14] John.G, Kohavi.R and Pfleger.K Irrelevant features and the subset selection problem. In the 11th International Conference on Machine Learning, pages 121-129, 1994.
[15] Kohavi.R and John.G Wrappers for feature subset selection. Artificial Intelligence Journal, Volume 97, special issue on relevance, pp 273-324. Dec. 1997
[16] Srilatha Chebrolu, Ajith Abraham and Johnson P Thomas “Hybrid Feature Selection for Modeling Intrusion Detection Systems”, Department of Computer Science, Oklahoma State University, USA [email protected], [email protected]
[17] Cheng-Huei Yang Li-Yeh Chuang, Cheng-Hong Yang “IG-GA: A Hybrid Filter/Wrapper Method for Feature Selection of
Microarray Data” Journal of Medical and Biological Engineering, 30(1): 23-28
[18] Bai-Ning Jiang Xiang-Qian Ding Lin-Tao Ma “A Hybrid Feature Selection Algorithm:Combination of Symmetrical Uncertainty and Genetic Algorithms” The Second International Symposium on Optimization and Systems Biology (OSB’08) Lijiang, China, October 31– November 3, 2008 Copyright © 2008 ORSC & APORC, pp. 152–157
[19] V.P Kshirsagar and Dharamraj R.Patil, “An overview of adaboost-based NISD and performance evaluation on NSL-KDD dataset”, International Journal of Computer Engineering and Computer Application, Vol. 1, 2010
[20] S.SethuramalingamAssociate Professor and Head, Department of Computer Science Aditanar College Tiruchendur 62815. India Dr.E.R. Naganathan Professor and Head, Department of Master of Computer Applications Velammal Engeering College, Chennai. India hybrid featrue selection for network intrusion. S.Sethuramalingam et al. International Journal on Computer Science and Engineering (IJCSE) ISSN : 0975-3397 Vol. 3 No. 5 May 2011