www.hydrol-earth-syst-sci.net/13/663/2009/ © Author(s) 2009. This work is distributed under the Creative Commons Attribution 3.0 License.
Earth System
Sciences
Physically based retrieval of crop characteristics for improved water
use estimates
K. Richter1and W. J. Timmermans2
1Department of Agricultural Engineering, University of Naples “Federico II”, via Universit`a 100, 80055 Portici (Na), Italy 2International Institute for Geo-information Sciences and Earth Observation, Dept. of Water Resources, P. O. Box 6,
7500 AA Enschede, The Netherlands
Received: 28 January 2009 – Published in Hydrol. Earth Syst. Sci. Discuss.: 6 March 2009 Revised: 20 May 2009 – Accepted: 21 May 2009 – Published: 27 May 2009
Abstract. The increasing scarcity of water from local to global scales requires the efficient monitoring of this valu-able resource, especially in the context of a sustainvalu-able man-agement in irrigated agriculture. In this study, a two-source energy balance model (TSEB) was applied to the Barrax test site. The inputs of leaf area index (LAI) and fractional vegetation cover (fCover) were estimated from CHRIS im-agery by using the traditional scaled NDVI and a look-up table (LUT) inversion approach. The LUT was constructed by using the well established SAILH + PROSPECT radiative transfer model. Simulated fluxes were compared with tower measurements and vegetation characteristics were evaluated with in situ LAI and fCover measurements of a range of crops from the SPARC campaign 2004. Results showed a better retrieval performance for the LUT approach for canopy pa-rameters, affecting flux predictions that were related to land use.
1 Introduction
Given the increasing scarcity of water at local, regional and global scales, an efficient monitoring of this valuable re-source becomes more and more essential, especially in the context of a sustainable management in irrigated agricul-ture and other water-related disciplines, such as hydrological modelling, numerical weather forecasting or climate change prediction (Anderson et al., 2007). Partitioning of avail-able energy between sensible and latent heat is hereby of prime interest and various models have been developed in the
Correspondence to: K. Richter ([email protected])
last years that describe this interaction between land surface and atmosphere. Those models, known as soil-vegetation-atmosphere transfer schemes (SVAT), vary widely in their complexity and dimensionality (Timmermans et al., 2007).
The conjunction of currently optical, thermal and mi-crowave Earth Observation (E. O.) data with SVAT schemes allows the spatial estimation of surface flux partitioning from land-surface temperature and dynamic vegetation variables (Anderson et al., 2007; Bindlish et al., 2001; Schmugge et al., 1998). For homogeneous canopies and land surfaces, a single-source modelling approach can be sufficient. How-ever, vegetated surfaces are usually under heterogeneous conditions, which are better described by two-source models, treating the land surface as a composite of soil and vegeta-tion components with separate fluxes and temperatures (An-derson et al., 2007; Timmermans et al., 2007). The Two-Source Energy Balance model (TSEB) for instance, first de-scribed in Norman et al. (1995) and updated by Kustas and Norman (1999) and Kustas et al. (2004), uses directional ra-diometric surface temperature for estimating component heat fluxes from soil and vegetation, i.e. instantaneous fluxes of net radiation (RN), soil (G), sensible (H ) and latent heat
more recently by Timmermans et al. (2007) revealed that TSEB, as well as other existing models, shows a considerable sensitivity to small variations of fractional vegetation cover (fCover) and/or leaf area index (LAI) on soil and canopy tem-perature estimation, in particular for high cover conditions. These findings emphasize the importance of accurate values of these parameters, usually determined from optical E. O. data. Although not model specific, the common approach applied within the TSEB model to estimate LAI and fCover is by means of rather simple empirical formulations utilizing either the Normalized Difference Vegetation Index (NDVI) (Schmugge et al., 1998) or a scaled NDVI (Choudhury et al., 1994; French et al., 2003; Kustas and Norman, 1999). Such empirical approaches are based on relationships be-tween the parameter (e.g. LAI) and Vegetation Indices (VIs). Many studies showed that the application of VIs can give appropriate results, especially when using newly developed hyperspectral VIs (e.g. Haboudane et al., 2004). However, a spectral signature is the integration of several factors and can not be explained by just one parameter. Moreover, these empirical models are often crop-, site- and sensor-specific (Atzberger, 2004; Vuolo et al., 2008). Therefore, many ef-forts have been undertaken in the last decades to develop and improve canopy reflectance models based on radiative transfer equations. In these radiative transfer models (RTM), the complexity of the spectral signal is taken into account by a function of canopy geometry (e.g. LAI, leaf angle dis-tribution), optical leaf and soil properties, illumination and viewing geometry. Inversion of such models then offers the possibility of extracting these biophysical parameters.
The objective of the present study is to test whether a phys-ically based retrieval of LAI and fCover can support more accurate estimations of fluxes in two-source energy balance modelling.
2 Material and methods
In this section first a description of the models used for the estimation of vegetation characteristics and energy fluxes is given. Then the campaign with ground and E. O. data acqui-sitions is described.
2.1 Estimation of vegetation characteristics
2.1.1 Empirical model
Traditionally, the estimation of surface parameters for en-ergy balance modelling is based on empirical methods. Sev-eral empirical models have been developed to estimate the biophysical parameters. Though not characteristic for the TSEB model, recent versions (French et al., 2003; Li et al., 2005) employ the approach as proposed by Choudhury et al. (1994). This so-called scaled NDVI – approach
deter-mines fCover for nadir viewing angles (fCover (θo),θo=0)
as follows: fCover(0)=1−
NDVI
max−NDVI
NDVImax−NDVImin
p
(1) Hereby, the end-member NDVI values, NDVImax and
NDVImin, characterize a surface fully covered and
com-pletely uncovered by vegetation, respectively. The parameter
p is defined asp=3/κ, describing the ratio of a leaf angle distribution term,3(set to 0.5 for randomly oriented leaves, Campbell and Norman, 1998), to canopy extinction,κ(set to 0.55, approximating typical extinction for many canopies at a solar zenith angle of 25 degrees, following Campbell and Norman, 1998), leading to apvalue of 0.9.
The NDVI end-members were obtained by combining an NDVI histogram analysis (Timmermans et al., 2007) with local field observations resulting in NDVImax=0.85 and
NDVImin=0.10.
Leaf area index (LAI), is then calculated from fCover (Choudhury, 1987):
LAI= ln(1−fCover(0))
3 (2)
2.1.2 Radiative transfer model
As an alternative to the empirical approach, a physically based model of canopy reflectance was applied: the com-bined SAILH (Kuusk, 1991; Verhoef, 1984, 1985) and PROSPECT (Jacquemoud and Baret, 1990) models (called “PROSAILH”), widely used for canopy reflectance mod-elling and applications, amongst others by Atzberger (2004), Baret et al. (2007), Darvishzadeh et al. (2008), Richter et al. (2009) or Weiss et al. (2000).
SAILH is a one-dimensional turbid medium radiative transfer model, later modified to take into account the hot spot effect (Kuusk, 1991). It simulates the bidirectional top-of-canopy (TOC) reflectance as a function of three structure parameters, defined by LAI (m2/m2); average leaf inclina-tion angle, ALA (deg), assuming an ellipsoidal distribuinclina-tion, and hot spot size parameter, Hot (m/m). Further it requires the soil spectral reflectance, fraction of diffuse incoming so-lar radiation (skyl), and the view and illumination geome-try (i.e. sun zenith angle,θs (deg); sensor viewing angle,θo
(deg) and azimuth angle between sun and sensor,φ(deg)). Leaf hemispherical reflectance and transmittance are simu-lated by the PROSPECT model as a function of four struc-tural and biochemical parameters: leaf chlorophyll a+b con-centration,Cab(µg/cm2); dry matter content,Cm(mg/cm2);
leaf water thickness,Cw(cm) and a leaf mesophyll structural
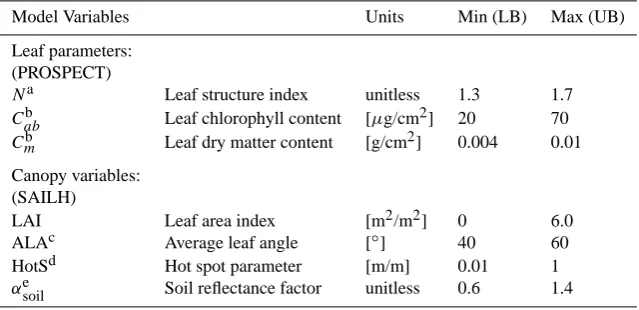
Table 1. Ranges of the input variables for PROSAILH to generate the LUT database.
Model Variables Units Min (LB) Max (UB)
Leaf parameters: (PROSPECT)
Na Leaf structure index unitless 1.3 1.7 Cabb Leaf chlorophyll content [µg/cm2] 20 70 Cmb Leaf dry matter content [g/cm2] 0.004 0.01 Canopy variables:
(SAILH)
LAI Leaf area index [m2/m2] 0 6.0
ALAc Average leaf angle [◦] 40 60
HotSd Hot spot parameter [m/m] 0.01 1
αesoil Soil reflectance factor unitless 0.6 1.4
anot measurable, therefore range set in order to comprise values often used in literature (e.g. by Weiss et al., 2000); b(somewhat extended) range of measurements (SPARC report 2004);
cALA – mean of MTA (measured with LAI-2000 instrument)±standard deviation, sd (mean: 50, sd: 11) (SPARC report 2004); dsimilar to range often used in literature (e.g. Baret et al., 2007; Vuolo et al., 2008);
edistribution of the factor observed over a number of bare soil pixels from the CHRIS imagery.
When calculating reflectance, the SAILH model estimates the gap fraction, which is a key variable driving light inter-ception by the canopy. Gap fraction is defined as the prob-ability of a ray of light passing through the canopy without encountering foliage or other plant elements, and is conse-quently the complement of fCover. The gap fraction, calcu-lated by SAILH corresponds therefore to 1-fCover.
In order to estimate LAI and/or the other parameters, the PROSAILH model must be inverted. In this study a fast look-up table (LUT) approach (e.g. Darvishzadeh et al., 2008; Richter et al., 2009; Weiss et al., 2000) has been chosen, of-fering a good alternative to other inversion procedures such as artificial neural networks (NN) (Atzberger, 2004) or nu-merical optimization methods (Vuolo et al., 2008), amongst others for the following reasons: first, the LUT technique permits a global search and avoids therefore the trapping into local minima as occurs with the optimisation methods (Darvishzadeh et al., 2008). Second, it shows less unex-pected behaviour than NN when the spectral signal of the surface is not well simulated by the model (for a discus-sion of different inverdiscus-sion methods see Atzberger, 2004; Darvishzadeh et al., 2008; or Richter et al., 2009).
PROSAILH was selected since it presents a good com-promise between physical complexity and computation time requirements and has been therefore preferred over (per-haps more accurate) models with complex parameterization schemes.
2.1.3 RTM models setup
The LUT is established in advance of the model inversion process. For this purpose PROSAILH is run to simulate bidirectional canopy reflectance and fCover for a number of
100 000 parameter combinations. This size was regarded by Weiss et al. (2000) as a good compromise between computer resources requirements and the accuracy of the estimates. The LUT was established by randomly sampling all param-eters within their bounds. In this way, all combinations of parameters were covered, but no adaptations to possible sen-sitivities of the parameters were implemented.
The range of canopy characteristics was described by tak-ing partly into account a priori information from the cam-paigns measurements. The usage of on-site measurement information is one possibility to regulate the ill-posed in-verse problem, which is pronounced between LAI and ALA, and therefore to improve the parameter (LAI) retrievals (Atzberger, 2004; Combal et al., 2003) (Sect. 2.3.3, SPARC report, 2004). The information about all parameter ranges can be found in Table 1.
Distributions of all parameters were uniform, so that no emphasis was placed on higher or larger values. Illumina-tion and view condiIllumina-tions were set according to the condiIllumina-tions during the overpass: θs=21◦,θo=8.4◦andφ=138◦. The
pa-rameter skyl was set to 0.1 across all wavebands, according to similar studies (e.g. Richter et al., 2009).
As the absorption of leaf water is not influencing the spec-tral range used in this study (<0.9µm),Cw was fixed to an
arbitrary value (Cw=0.02 cm).
framework of Global Monitoring for Environment and Se-curity (GMES/Kopernikus, ESA, 2007) to replace and im-prove the old generation of satellite sensors. Sentinel-2 is scheduled to be launched in the year 2012 and as outcome the mission will provide service data, comprising products such as LAI and fCover. The multi spectral data, used for the simulations in the study, involve the following CHRIS wavebands: 492, 563, 664, 706, 738, 773, 844 and 862 nm (corresponding to Sentinel-2: 490, 560, 665, 705, 740, 775, 842 and 865 nm, ESA 2007). In this way all spectral bands of Sentinel-2 with the purpose to retrieve LAI and other veg-etation characteristics (i.e. 8 out of 13 bands) are included. This spectral sampling has been tested for its suitability for LAI estimation by Richter et al. (2009).
In the final step the solution within the LUT is selected by applying a simple cost function calculating the root mean square error (RMSE) between simulated and measured spec-tra (e.g. Darvishzadeh et al., 2008), as follows:
RMSE=
s Pn
i=1Rmeas(λ)−Rlut(λ))2
n (3)
where Rmeas corresponds to the measured reflectance at
wavelengthλ, andRlut stands for the simulated reflectance calculated with the PROSAILH model. The number of bands is indicated withn.
The resulting parameter combination was built as the av-erage of all parameter combinations found within less than 20% of the lowest RMSE value (e.g. Richter et al., 2009). 2.2 TSEB model
The land surface model used here to derive latent and sensi-ble heat fluxes is originally designed to use input data primar-ily from remote sensing platforms. Its main characteristic is that it discriminates between a soil and vegetation compo-nent, aiming at a more physical description of heterogeneous surfaces when dealing with radiative and aerodynamic prop-erties. Required remote sensing input consists of spatial in-formation on surface temperature as well as vegetation den-sity, being fCover and LAI. The version implemented here basically follows what is described as the “series resistance network” in Appendix A of Norman et al. (1995). In the cur-rent version a physically based algorithm is implemented for estimating the net radiation, which is described in detail in Kustas and Norman (1999). As such, the model implemented is described in detail in Norman et al. (1995) and Kustas and Norman (1999); reason to only sketch its main characteris-tics and highlight those parts that are affected by fCover and LAI.
First of all, fCover is used to estimate canopy and soil tem-peratures (TCandTS, respectively) from observed
radiomet-ric surface temperature,TR, with a simple non-linear mixing
model, described by:
TRn=fCoverTn
C +(1−fCover)T
n
S. (4)
where n is the power in the Stefan-Boltzmann equation that reasonably approximates the appropriate integral of the Planck blackbody emission function for the wavelength of the sensor.
A first estimate of the latent heat flux from the canopy, LEC, is obtained by applying the Priestley and Taylor
ap-proach on the canopy component of the net radiation,RN,C,
which works reasonably well under unstressed vegetation conditions. The canopy sensible heat flux,HC, is then
de-termined by evaluating the canopy energy budget. By using a linearized form of Eq. (4), following the procedure out-lined in the Appendix A of Norman et al. (1995), the within-canopy air temperature,TAC, is derived, which also yields
the canopy temperature, TC. Substitution in Eq. (4) yields
TS, providing the possibility of obtaining the soil sensible
heat flux,HS. The soil heat flux,G, is determined as a
time-dependant ratio of the soil net radiation,RN,S, after which
the soil latent heat flux, LES, is determined by evaluating the
soil energy budget. In case LES is negative, then the soil is
likely to be dry and LES is set to zero. Under these
circum-stances,HS is derived from the soil energy budget, and an
adjustedTS is obtained. Equation (4) provides a new
esti-mate forTCwhich is then used to calculate an updatedHC.
The algorithm used for estimating the net radiation diver-gence requires incident solar radiation observations and for-mulations for the transmission of direct and diffuse short-wave radiation and for the transmission of longshort-wave radia-tion through the canopy (Campbell and Norman, 1998). The canopy component of net radiation,RN,C, is given by:
RN,C =(1−τLW)×(RLW,sky+RLW,S−2RLW,C) (5)
+(1−τSW)×(1−ρC)×RSW
and the soil net radiation component,RN,S, by:
RN,S =τLW×RLW,sky+(1−τLW)×RLW,C (6)
−RLW,S+τSW×(1−ρS)×RSW
The parameterization of the resistances used in the series resistance network was taken from Norman et al. (1995). Aerodynamic properties such as canopy height, displacement height, aerodynamic roughness, leaf width, as well as lim-ited micrometeorological observations are required as input parameters and are assigned a priori. They are described in the following section.
2.3 Experimental setup and observations
2.3.1 Site description
The analyses are based on data of the interdisciplinary ESA SPARC 2004 Campaign. (Moreno et al., 2004; SPARC re-port 2004). The objective of the campaign was to advance the understanding of land – atmosphere exchanges of water and energy in space and time over heterogeneous land surfaces.
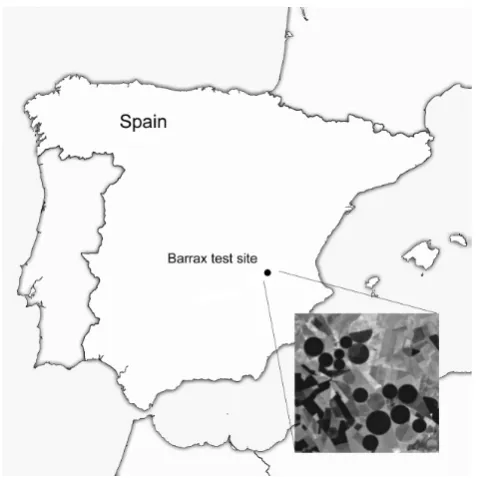
In this context, satellite and ground data were collected in Barrax (30◦30N, 2◦60W), an agricultural test area situated in the Castilla-La Mancha region in southern Spain. Figure 1 shows an overview of the location and the area of interest.
The Barrax site, a flat area at 700 m above sea level, is characterized by a large variety of uniform land use units of different crops and dry bare soils, leading to a wide range of LAI from 0 up to 6.5.
The Castilla-La Mancha region receives an annual precip-itation of only 400 mm and is therefore one of the driest re-gions in Europe. One third of the land is irrigated (35%), comprising amongst others alfalfa, maize, potatoes, sun-flower, onion, garlic, sugar beet and vineyard. The other two thirds (65%) are rainfed cultivations, such as winter/spring cereals and bare soils/fallow land.
2.3.2 E. O. data acquisition
Optical data
Hyperspectral and multiangular E. O. data from Compact High Resolution Imaging Spectrometer (CHRIS) instrument, located on the Project for On-Board Autonomy (PROBA) platform, were acquired on 16 July 2004 around 11:25 UTC. Since the system PROBA/CHRIS has multiangular capabili-ties, five consecutive images from five different view angles have been obtained during the overpass, with a minimum satellite zenith angle of 8.4◦. Since it was not the scope of the current study to analyze the contribution of directional information to the parameter estimates (Vuolo et al., 2008), only the imagery with the viewing angle closest to nadir has been considered.
[image:5.595.309.548.60.301.2]The sensor covers the visible/near-infrared region (from 400 nm to 1050 nm) with a spectral sampling interval rang-ing between 1.25 nm (at 400 nm) and 11 nm (at 1000 nm). CHRIS data were acquired in Mode-1, having a spatial reso-lution of 34 m and 62 spectral bands.
Fig. 1. Location of the study area: Barrax Site, La-Mancha, Spain.
Radiometric calibration and atmospheric and geometric correction of CHRIS imagery were carried out by the De-partment of Thermodynamics of the University of Valencia. Thermal imagery
The thermal remote sensing data from SPARC 2004 used in this study consisted of ASTER imagery, acquired on 18 July 2004 to obtain surface temperature. ASTER has 5 thermal infrared bands with a 90 m spatial resolution.
After atmospheric correction, the land surface tempera-ture was extracted using a split-window technique (Jimenez-Munoz and Sobrino, 2007) on channels 13 and 14 of the ASTER data. This method was preferred over the standard TES algorithm due to insufficient accuracy in land surface temperature retrieval that was noted over certain land cover types (Sobrino et al., 2007).
Despite ASTER’s excellent capabilities for surface energy flux mapping here CHRIS/PROBA data were used due to their more advantageous spectral characteristics for mapping the vegetation characteristics, assuming these do not change significantly within 2 days time.
2.3.3 Ground observations
The ground-based data used here consisted of vegetation characteristics, meteorological observations as well as radia-tion and turbulent flux exchanges (Su et al., 2008), collected during the time of the satellite acquisitions.
(Fernandez et al., 2005) at several locations for calibration and validation of remote sensing derived vegetation input to the flux model.
Non-destructive field measurements of LAI were per-formed with the Plant Canopy Analyzer LAI-2000 instru-ment (LICOR Inc., Lincoln, NE, USA), measuring simul-taneously the MTA that corresponds to the ALA parameter in the PROSAILH model (Sect. 2.1.2).
To reduce the effect of multiple scattering on LAI-2000 measurements, the instrument was operated maximal two hours after sunrise or before sunset, under diffuse radiation conditions. In order to prevent interference caused by the op-erator’s presence and the illumination condition, the sensor field of view was limited with a 180◦view-cap. Measure-ments were azimuthally oriented opposite to the sun azimuth angle. Each single LAI value was the result of an average of 24 measurements taken randomly within an Elementary Sampling Unit (ESU) of approximately 15×15 m2.
Since no corrections were applied to account for clump-ing or the influence of non-photosynthetic plant components (such as stems), the term “LAI” should here be understood as “effective plant area index” (PAIeff)(Chen et al., 1997;
Darvishzadeh et al., 2008). However, LAI measured by LAI-2000 (or other optical methods) is quite close to the leaf sur-face visible by a remote sensor which is not necessarily the case for the real LAI. Therefore, a correction for the clump-ing effect is not absolutely necessary (Stenberg et al., 2004). A data set of 48 LAI measurements, located in/near the area of interest (maize: 8, garlic: 13, potatoes: 15, sugar beet: 6, sunflower: 6) have been selected for the validation.
Measurements of fCover, being of essential interest for this study, have been performed using hemispherical pho-tography. According to the crop structure, different sam-pling strategies were applied. The photographs were pro-cessed using a specialized software package (CAN-EYE), developed at INRA-CSE Avignon. The procedure of the software is based on gap fraction estimation using classifi-cation techniques (detailed information about the measure-ments and data elaboration can be found in the SPARC 2004 report). The final fCover estimate for each ESU (20×20 m) was calculated as the average of twelve measurements. For the present study, a total number of 21 measurements have been used for validation (garlic: 4, potatoes: 4, sunflower: 4, onion: 4, sugar beet: 3, maize: 2).
Meteorological and radiation observations (incoming shortwave radiation, air temperature, relative humidity, air pressure and wind speed) that were needed as input to the TSEB model, were taken from a tower in the centre of the area.
Validation data concerning turbulent fluxes exchanges and radiation for the time of the ASTER overpass were made at several locations that were chosen such that typical land cover units were covered (described in detail in Su et al., 2008). They comprised a forest nursery, a wheat stubble field, vineyard (2 sites), a sunflower field and a corn field. At
all sites measurements of sensible heat flux,H, were made either by 1-D or 3-D sonic anemometers or by scintillometer (vineyard) and in one position also latent heat flux, LE, was measured (vineyard). However, due to the pivot irrigation system at the corn field, the sensor had to be located at the edge of the corn field adjacent to the vineyard, meaning that the measurement either represented the vineyard or the corn, depending on wind direction. Net radiation and soil heat flux were measured only at four sites; the vineyard, forest nurs-ery, corn and a wheat stubble field. For a location map one is referred to Fig. 1 in Van der Kwast et al. (2009) where also a land cover map is provided, showing the main land cover units.
Aerodynamic properties were assigned to the different land cover units using averaged field observations of canopy height,hc (Fernandez et al., 2005) in combination with the
classical relations (Brutsaert, 1982) where surface rough-ness length for momentum transport,z0M, is taken equal to
1/8*hC and the displacement height, d0, equal to 2/3*hC.
An exception was made for the roughness length of the corn fields, which were extremely dense, resulting in a much smoother surface. Therefore a roughness length value equal to that of the sunflower was assigned, which closely resem-bled estimates from turbulence measurements done over the maize (Timmermans et al., 2009). Moreover, the displace-ment heights of the wheat stubble and forest nursery land cover were chosen equal to zero, since these units were char-acterized by a very open and heterogeneous character.
3 Results and discussion
In this section we first present the quality and the differences in LAI and fCover estimations using the LUT inversion and the scaled NDVI approaches. Validation of the energy bal-ance model output is then performed by means of the flux towers measurements. Differences in the flux components simulated with both canopy parameter retrieval methods are analyzed additionally in a spatial context. A general discus-sion on the applied method(s), their problems and applicabil-ity (in an operational context) concludes this section. 3.1 Vegetation characteristics versus observations
Retrieval performances of the LUT inversion and NDVI ap-proaches were evaluated using LAI and fCover data from campaigns measurements (see Sect. 2.3.3). Crops not cov-ered by the flux stations, such as sugar beet, garlic, potatoes and onion, were included in the analyses as well to test the general applicability of the models.
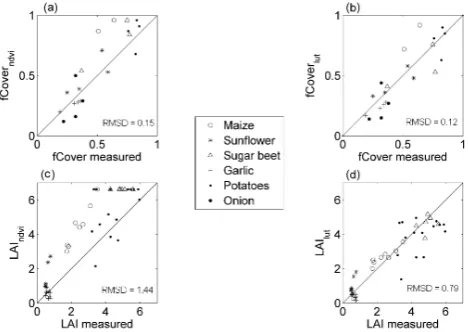
The comparison with the ground measured fCover data with both approaches (LUT inversion: “fCoverlut”; NDVI
approach: “fCoverndvi”) resulted in a slightly higher
ac-curacy of fCoverlut, with Root Mean Squared Differences
plots in Fig. 2a, b give a graphical impression of the estima-tion quality, indicating a tendency of overestimaestima-tion of the NDVI approach, especially at the higher values. Since TSEB has a greater sensitivity to fCover, in determining the tur-bulent fluxes, especially at high vegetation cover conditions (Timmermans et al., 2007) this is considered an important drawback of the NDVI approach.
In case of LAI (LUT inversion: “LAIlut”; NDVI approach:
“LAIndvi”) the LUT inversion approach provided clearly a
higher retrieval accuracy in comparison with the ground data (Fig. 2c, d), with RMSD of 0.79 (LAIlut)versus RMSD of 1.44 (LAIndvi). Also here the empirical model has a trend to overestimate the parameter. Clearly noticeable is also the well-known problem of saturation at higher LAI values (“plateau-effect”), illustrated by the scatter plot in Fig. 2c.
The overestimation of fCover using the scaled NDVI ap-proach can be caused by an inaccurate NDVImin value, i.e.
the value for bare soil reflectance, which in reality varies and is probably different (higher) when calculating the mean over all bare soil pixels in the scene (Montandon and Small, 2008). Soils have a variable NDVI due to the fact that the rel-ative variation of the spectral signal in the visible red wave-band region is larger than in the near infrared. Increasing soil water leads consequently to an augmentation of NDVI, gen-erating for example a difference of NDVI of 10% between a wet and a dry soil background for a LAI of 1 (Bach and Ver-hoef, 2003). Differences of land cover and irrigation practise which influence the soil background will therefore also have an effect on fCover estimation accuracy.
The PROSAILH model overcomes this problem by taking into account the soil reflectance variation by means of the
αsoil-factor.
However, the model tends to slightly underestimate high LAI values for crops with strong leaf clumping, as it was the case for potatoes in the present growth stage. This be-haviour results from the nonlinearity of the LAI-reflectance relationship, leading to saturation effects (Baret et al., 2007). On the other hand, even the measurements could cause an overestimation of LAI, since the LAI-2000 can not separate between photosynthetic and non-photosynthetic plant com-ponents. This may occur whenever the built-in assumption of randomly distributed plant elements holds true. Thus, non-green elements (such as stems or senescent leaves) reduce the measured gap fractions.
[image:7.595.311.546.63.229.2]A detailed interpretation of the retrieval performances for the specific crop types is not given, since the objective is to evaluate the overall applicability of the RTM model for canopy parameter estimations. Considering that the PRO-SAILH model simplifies the canopy as a turbid medium, of which none of the crops really corresponds to, the retrieval performance can be regarded as satisfying. The implemen-tation of some a priori information from the field measure-ments can support accurate retrievals.
Fig. 2. Estimated versus measured fCover (a, b) and LAI values (c, d) using the scaled NDVI approach (a, c) and a LUT inversion approach based on PROSAILH model (b, d), for different crops monitored during the SPARC 2004 campaign.
3.2 Water and heat fluxes
Validation of the TSEB model output was performed in com-parison with tower-based flux observations for the day of ASTER overpass. Model flux components were extracted from the image pixels in the vicinity of the flux towers, fol-lowing a simple analytical footprint model, which is a re-formulated version of Gash (1986). Details of the footprint model can be found in Timmermans et al. (2009).
The models are run on an area of almost 6×6 km compris-ing 64×64 pixels around the Barrax vineyard which was the centre point of attention during the SPARC 2004 campaign (see also Fig. 1).
For all components, both TSEB runs (RTM inversion: “TSEBlut” and scaled NDVI: “TSEBndvi”) yielded
compara-ble results versus observations and RMSD were in all cases lower than 50 W/m2, which is considered acceptable. Net radiation yielded a RMSD of 46 W/m2 versus observations for both approaches and gave almost identical results in all 4 sites (Fig. 3a). Also for the soil heat flux (Fig. 3b) and the sensible heat flux (Fig. 3c) output negligible differences between the NDVI and LUT approaches were seen. RMSD with observations forGwere 36 and 38 W/m2for the NDVI and LUT approaches, whereas for H these were 43 and 42 W/m2, respectively.
Although RMSD forGandHwere almost equal for both TSEBndvi and TSEBlut, TSEBlut appears to perform better
at the lower values ofGandH. With the exception of the
Gobservation at the cut wheat site, all other sites showed similar performances for bothGandH. TSEBlut
Fig. 3. Modelled versus observed fluxes ofRN(a),G(b) andH(c),
using the two approaches of canopy parameter estimations. Cross symbols represent the output from the scaled NDVI approach and the circles from LUT inversion.
3.3 Spatial differences of flux modelling
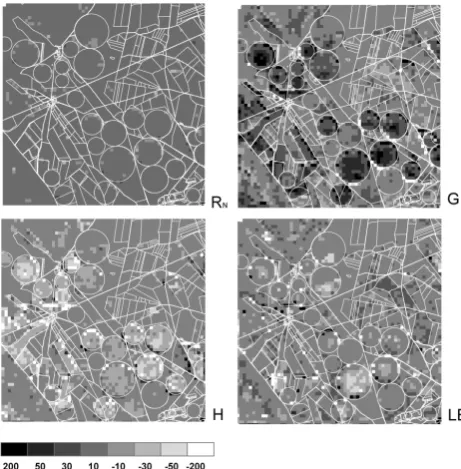
Differences between the two modelling approaches are shown in Fig. 4. Spatially distributed output forRN,G,H
and LE from TSEBndviare subtracted from output of TSEBlut
(TSEBlut– TSEBndvi).
The maps reflect what was noticed from observations at the flux tower sites;RNdifferences are negligible whereasG
estimates for TSEBlut are higher than for TSEBndvi at high
fCover, whileH (and to a lesser extent LE) shows lower fluxes for TSEBlut in these areas, especially in the maize
fields. The net radiation estimation seems rather insensitive to variations in LAI and fCover. This is understandable since LAI and fCover are only indirect inputs to the net radiation estimation, which is mainly driven by incoming solar radi-ation, and their effects basically act on the soil and canopy components. For example an increase in LAI will decrease the shortwave transmission which will increase the canopy net radiation but at the same time decrease the soil net radi-ation, see also Eqs. (4) and (5). As a result the net effect on the total net radiation is negligible. In order to consider the variations in the other energy balance components, that seem to originate from crop characteristics, the flux estimates will be analyzed in terms of land cover classes.
On the basis of a land cover map (Van der Kwast et al., 2009), simulated fluxes were extracted for all land uses. However, here we will focus on the five different land use classes covered by the stations (forest nursery, vineyard, sun-flower, corn and wheat stubble), which enables us to assess the model accuracy to a certain extent. SinceRN estimates
are rather similar for both approaches we will focus on the remaining flux components from now on.
Figure 5 shows the spatial differences between TSEBlut
and TSEBndvi calculated flux components, for every of the
five land use classes and Fig. 6 the estimated fCover and LAI values for the respective classes.
Even though the estimation ofHandGwas almost identi-cal for both model versions at the flux site at the forest nurs-ery, the physical approach shows a trend of higherH and lowerGfluxes when examining the entire class. HigherH
values theoretically might indicate more realistic results from
Fig. 4. Differences between TSEB output RN, G, H and LE
(W/m2), subtracting empirical approach of surface parameter es-timations from the physical (TSEBlut– TSEBndvi), Barrax test site, 18 July 2004.
TSEBlut, although uncertain as to how high, since this land
use class is characterized by rather small green vegetation cover, low LAI values, but at the same time has rather large amounts of senescent grass cover. This would imply rela-tively highHand relatively lowG. To a certain extent this is also reflected in the higher estimates of fCover by the LUT approach. However, unfortunately there are no observations of fCover and LAI made over the forest nursery.
The vineyard case shows almost no differences between the two approaches, but the small number of pixels (n=5) does not allow to draw significant conclusions.
Due to their planophile leaf orientation, sunflowers in early growth stages exhibit – with still relatively low LAI values (≤2.7) – already high fCover (here up to 0.76). For this crop class the physical approach yielded also more re-alistic estimates of fCover (RMSD=0.07 for fCoverlut and
RMSD=0.11 for fCoverndvi). Since TSEB is sensitive to fCover with respect toH, the fluxes were probably modelled more accurate by TSEBlut(as is shown forH ). No
measure-ments ofGandRNwere available from this station, but the
trend of higherGfrom TSEBlut confirms the conclusion of
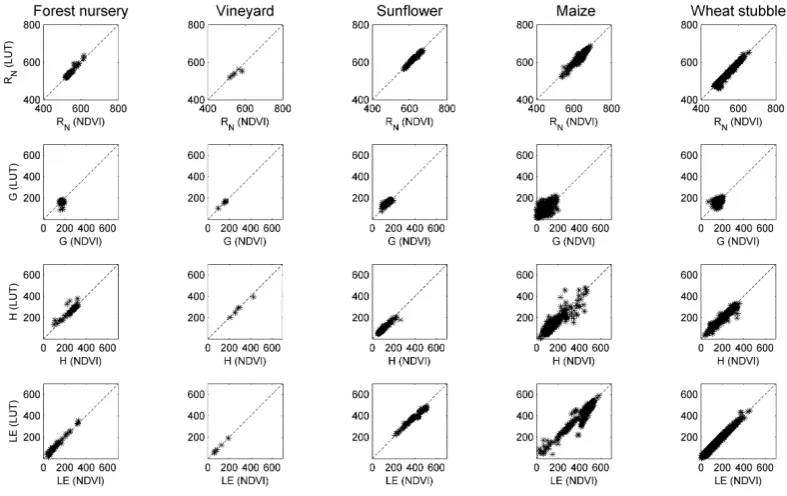
[image:8.595.49.288.64.143.2]Fig. 5. Simulated fluxes ofRN,G,H and LE and by TSEBndviversus TSEBlutfor different land use classes.
Fig. 6. Estimated values of fCover and LAI from scaled NDVI versus estimated by LUT inversion for the land use classes.
of 0.9 and LAI up to 6. The estimation of LAI for maize was performed more accurate by the physical model (RMSD of 0.4 from LAIlut against RMSD of 2.1 from LAIndvi), as
well as for fCover, even though only two measurements were available (RMSD=0.24 for fCoverlut and RMSD=0.34 for
fCoverndvi).
The overestimation of LAI, and to a lesser extent fCover, by the TSEBndvi approach results in an underestimation of Gfor this land use, also illustrated by the observation at this site, Fig. 3b. This effect is clearly visible for all maize-fields in Fig. 4b.
TSEBlutestimates ofH for this land cover generally were
lower than those from TSEBndvi, where differences over
the maize field next to the vineyard reached values up to 50 W/m2, with TSEBlutvalues around 75 W/m2. These
[image:9.595.127.470.348.536.2]estimates. The differences seem to vary from field to field, which may originate from the irrigation scheme. The differ-ent estimation results of the two approaches may be caused by variations in soil reflectance due to (superficial) soil mois-ture differences, which are taken into account only by the physical model. This may also be an explanation for the fact that regarding the comparison of fluxes between TSEBlutand
TSEBndvi, maize exhibits the most pronounced differences of
all land use classes, since some fields were fully irrigated and some neglected. The tendency of overestimating fCover with the NDVI approach seems to influence especially the LE for a certain group of pixels, mainly over irrigated maize, result-ing in differences rangresult-ing from 30 to 35 W/m2.
In the last land use class, a wheat field shortly harvested, TSEBlutresulted in a slightly better estimate ofH, whereas Gwas better estimated by TSEBndvi at the flux observation
site. When looking at the entire land cover class however, no distinct differences are seen for either one of the fluxes. Both
GandH exhibit some scatter around the 1:1 line, which is also seen in the LE flux but at a lesser extent. Although no measurements of LAI and fCover were made over this land use, it is characterized by rather low fCover (<0.1) and LAI (≤2). When looking at the scatter plots of Fig. 6 it is noticed that in the lower regions of LAI and fCover no clear dis-tinction can be made between the NDVI and LUT approach, which is reflected in the scatter of the fluxes around the 1:1 line in Fig. 5 for this class.
Summarizing,RNshows for all land use classes the
small-est variations between the two approaches.GandH, and to a somewhat lesser extent LE, exhibit more pronounced dif-ferences, mainly over areas with high vegetation cover and high LAI. The LAI mainly influences the estimation ofG, since an increase in LAI invokes a decrease in radiation re-ceived at the soil, whereas fCover mainly influences the tur-bulent fluxes through its effect on the component tempera-tures. This is of importance since the TSEB model is sen-sitive to fCover, when estimating turbulent fluxes, in partic-ular at the high end as stated by Timmermans et al. (2007). This could be of interest for a wider range of crops or veg-etation, because even for other crops with high fCover – not included in the measurements of flux towers – the physical approach yielded a slightly higher retrieval accuracy (see also Fig. 2) with sugar beet: RMSD (fCoverlut)=0.14 vs. RMSD (fCoverndvi)=0.16 and potatoes: RMSD (fCoverlut)=0.10 vs. RMSD (fCoverndvi)=0.11. Even though flux observations were only available for a limited number of land covers, it is argued that the improved estimation of both LAI and fCover in general leads to slightly better flux estimates. However, further research is needed to demonstrate this effect also un-der a wiun-der range of canopy characteristics.
Spatial differences between the TSEBlutand the TSEBndvi
model results were clearly related to land cover, with notice-able differences up to 50 W/m2for H and 35 W/m2for LE over irrigated crops and up to 20 W/m2 for both the turbu-lent fluxes over dry areas. Although this may seem rather
small, an instantaneous error of 35 W/m2could translate into 1.2 mm error in water use, which has considerable conse-quences for irrigation management.
4 Conclusions
In this study, the TSEB model was applied to the Barrax test site and evaluated with ground measurements from the SPARC campaign 2004. The inputs of leaf area index and fractional vegetation cover were estimated from CHRIS im-agery by using the traditional scaled NDVI and a LUT inver-sion approach, based on the proposed bands of future ESA Sentinel-2 satellite. The LUT was constructed using the well established SAILH + PROSPECT radiative transfer model. The validation by means of a range of crops over the SPARC Barrax test site resulted in a better retrieval performance for the LUT approach. Differences in flux predictions in com-parison with a limited number of station measurements were rather small. However, a differentiation between land use classes indicated a higher estimation quality of the physical approach, especially over areas that were characterized by higher LAI and higher fCover.
In view of operational applications, a physically based ap-proach has several advantages over empirical methods. Dif-ferences in soil background due to soil moisture variations are taken into account by the RTM model and thus canopy parameters, such as LAI and fCover can be estimated more accurately. Moreover, the RTM based inversion does not (necessarily) require detailed in situ calibration data sets. This constitutes a major general advantage of physical over empirical models, rendering them more robust and generally applicable. The application of physically based models for estimating vegetation parameter as input for energy balance models is therefore recommended.
Acknowledgements. This work has been partly funded through ESA 18307/04/NL/FF. We would like to thank Juan-Carlos Jimenez-Mu˜noz from the Global Change Unit of the University of Valencia for radiometric and atmospheric correction of the thermal ASTER data and Luis Guanter from Geo-ForschungsZentrum (GFZ) Potsdam, and his former Department of Thermodynamics of the University of Valencia, for preprocessing of CHRIS/Proba data.
Edited by: J. Wen
References
Anderson, M. C., Norman, J. M., Mecikalski, J. R., Otkin, J. A., and Kustas, W. P.: A climatological study of evapotranspiration and moisture stress across the continental U.S. based on ther-mal remote sensing. I. Model formulation, J. Geophys. Res,. 112, D11112, doi:10.1029/2006JD007506, 2007.
Bach, H. and Verhoef, W.: Sensitivity studies on the effect of sur-face soil moisture on canopy reflectance using the radiative trans-fer model GeoSAIL, in proceedings of IGARSS 2003, 1679– 1681, 2003.
Baret, F., Hagolle, O., Geiger, B., Bicheron, P., Miras, B., Huc, M., Berthelot, B., Nino, F., Weiss, M., Samain, O., Roujean, J. L., and Leroy, M.: LAI, fAPAR and fCover CYCLOPES global products derived from VEGETATION. Part 1: Principles of the algorithm, Remote Sens. Environ., 110, 275–286, 2007. Bindlish, R., Kustas, W. P., French, A. N., Diak, G. R., and
Mecikalski, J. R.: Influence of near-surface soil moisture on re-gional scale heat fluxes: model results using microwave remote sensing data from SGP97, IEEE T. Geosci. Remote, 39, 1719– 1728, 2001.
Brutsaert W.: Evaporation into the atmosphere. Reidel, Dordrecht, The Netherlands, 299 pp., 1982.
Campbell, G. S. and Norman, J. M.: An introduction to Environ-mental Biophysics, Springer, New York ISBN 0-387-94937-2, 286 pp., 1998.
Chen, J. M., Rich, P. M., Gower, S. T., Norman, J. M., and Plummer, S.: Leaf area index of boreal forests: Theory, techniques and measurements, J. Geophys. Res.-Atmos., 102, 429–443, 1997. Choudhury, B. J., Ahmed, N. U., Idso, S. B., Reginato, R. J., and
Daughtry, C. S. T.: Relations between evaporation coefficients and vegetation indices studied by model simulations, Remote Sens. Environ., 50, 1–17, 1994.
Choudhury, B. J.: Relationships between vegetation indices, radia-tion absorpradia-tion, and net photosynthesis evaluated by a sensitivity analysis, Remote Sens. Environ., 22, 209–233, 1987.
Combal, B., Baret, F., Weiss, M., Trubuil, A., Mace, D., Pragn`ere, A., Myneni, R., Y. Knyazikhin, Y., and Wang, L.: Retrieval of canopy biophysical variables from bidirectional reflectance using prior information to solve the ill-posed inverse problem, Remote Sens. Environ., 84, 1–15, 2003.
Darvishzadeh, R., Skidmore, A., Schlerf, M., and Atzberger, C.: Inversion of a radiative transfer model for estimating vegetation LAI and chlorophyll in a heterogeneous grassland, Remote Sens. Environ., 112, 2592–2604, 2008.
European Space Agency (ESA): GMES Sentinel-2 Mission Re-quirements Document, issue 2 revision 0-30/01/2007, EOP-SM/1163/MR-dr, p. 31, 2007.
Fernandez, G., Moreno, J., Gandia, S., Martinez, B., Vuolo, F., and Morales, F.: Statistical variability of field measurements of bio-physical parameters in SPARC-2003 and SPARC-2004 data cam-paigns, in: Proceedings of the SPARC Final Workshop WPP-250, Enschede, The Netherlands, 4–5 July 2005, 2005.
French, A. N., Schmugge, T. J., Kustas, W. P., Brubaker, K. L., and Prueger, J.: Surface energy fluxes over El Reno, Oklahoma, using high-resolution remotely sensed data, Water Resour. Res., 39 (6), 1164, 2003.
Gash, J. H. C.: A note on estimating the effect of a limited fetch on micrometeorological evaporation measurements, Bound.-Lay. Meteorol., 35, 409–413, 1986.
Haboudane, D., Miller, J. R., Pattey, E., Zarco-Tejada, P. J., and Strachan, I. B.: Hyperspectral vegetation indices and novel algo-rithms for predicting green LAI of crop canopies: Modeling and validation in the context of precision agriculture, Remote Sens. Environ., 90, 337–352, 2004.
Jacquemoud, S. and Baret, F.: PROSPECT: A model of leaf optical
properties spectra, Remote Sens. Environ., 34, 75–91, 1990. Jimenez-Munoz, J. C. and Sobrino, J. A.: Feasibility of
retriev-ing land-surface temperature from ASTER TIR bands usretriev-ing two-channel algorithms: a case study of agricultural areas, IEEE T. Geosci. Remote, 4, 60–64, 2007.
Kustas, W. P. and Norman, J. M.: Evaluation of soil and vegeta-tion heat flux predicvegeta-tions using a simple two-source model with radiometric temperatures for partial canopy cover, Agr. Forest Meteorol., 94, 13–29, 1999.
Kustas, W. P., Norman, J. M., Schmugge, T. J., and Anderson, M. C.: Mapping surface energy fluxes with radiometric temperature, in: Thermal remote sensing in land surface processes, edited by: Quattrochi. D. A. and Luvall, J. C., Boca Raton, Florida, CRC Press, 205–253, 2004.
Kuusk, A.: The hot-spot effect in plant canopy reflectance, in: R.B. Myneni and J. Ross (Ed.), Photon –vegetation interactions, Springer-Verlag, New York, 139– 159, 1991.
Li, F., Kustas, W. P., Prueger, J. H., Neale, C. M. U., and Jackson, T. J.: Utility of remote sensing based two-source energy balance model under low and high vegetation cover conditions, J. Hy-drometeorol., 6, 878–891, 2005.
Montandon, L. M. and Small, E. E.: The impact of soil reflectance on the quantification of the green vegetation fraction from NDVI, Remote Sens. Environ., 112(4), 1835–1845, 2008.
Moreno, J. and participants of the SPARC campaigns: The SPEC-TRA Barrax Campaign (SPARC): Overview and first results from CHRIS data, in: Proceeding of the 2nd CHRIS/Proba Workshop Frascati, Italy, ESA/ESRIN, 28–30 April, 2004. Norman, J. M., Kustas, W. P., and Humes, K. S.: A two-source
approach for estimating soil and vegetation energy fluxes in ob-servations of directional radiometric surface temperature, Agr. Forest Meteorol., 77, 263–293, 1995.
Richter, K., Atzberger, C., Vuolo, F., Weihs, P., and D’Urso, G.: Ex-perimental assessment of the Sentinel-2 band setting for RTM-based LAI retrieval of sugar beet and maize, Can. J. Remote Sens., in press, 2009.
Schmugge, T. J., Kustas, W. P., and Humes, K. S.: Monitoring land surface fluxes using ASTER observations, IEEE T. Geosci. Re-mote, 36, 1421–1430, 1998.
Sobrino, J. A., Jimenez-Munoz, J. C., Balick L., Gillespie, A. R., Sabol, D. A., and Gustafson W. T.: Accuracy of ASTER level-2 thermal-infrared standard products of an agricultural area in Spain, Remote Sens. Environ., 106, 146–153, 2007.
SPARC data acquisition report, Contract no: 18307/04/NL/FF, Uni-versity Valencia, 2004.
Stenberg, P., Rautiainen, M., Manninen, T., Voipio, P., and Smolan-der, H.: Reduced simple ratio better than NDVI for estimating LAI in Finnish pine and spruce stands, Silva Fenn., 38(1), 3–14, 2004.
Su, Z., Timmermans, W. J., Gieske, A. S. M., Jia, L., Elbers, J. A., Olioso, A., Timmermans, J., Van der Velde, R., Jin, X., Van der Kwast, H., Sabol, D., Sobrino, J. A., Moreno, J., and Bianchi, R.: Quantification of land-atmosphere exchanges of water, en-ergy and carbon dioxide in space and time over the heteroge-neous Barrax site, Int. J. Remote Sens., 29, 5215–5235, 2008. Timmermans, W. J., Kustas, W. P., Anderson, M. C., and French,
384, 2007.
Timmermans, W. J., Su, Z., and Olioso, A.: Footprint issues in scin-tillometry over heterogeneous landscapes, Hydrol. Earth Syst. Sci. Discuss., 6, 2099–2127, 2009,
http://www.hydrol-earth-syst-sci-discuss.net/6/2099/2009/. van der Kwast, J., Timmermans, W., Gieske, A., Su, Z., Olioso,
A., Jia, L., Elbers, J., Karssenberg, D., and de Jong, S.: Eval-uation of the Surface Energy Balance System (SEBS) applied to ASTER imagery with flux-measurements at the SPARC 2004 site (Barrax, Spain), Hydrol. Earth Syst. Sci. Discuss., 6, 1165– 1196, 2009,
http://www.hydrol-earth-syst-sci-discuss.net/6/1165/2009/. Verhoef, W.: Light scattering by leaf layers with application to
canopy reflectance modeling: the SAIL Model, Remote Sens. Environ., 16, 125–141, 1984.
Verhoef, W.: Earth observation modeling based on layer scattering matrices, Remote Sens. Environ., 17, 165–178, 1985.
Vuolo, F., Dini, L., and D’Urso, G.: Retrieval of Leaf Area In-dex from CHRIS/PROBA data: an analysis of the directional and spectral information content, Int. J. Remote Sens., 29(17), 5063–5072, 2008.
Weiss, M., Baret, F., Myneni, R. B., Pragn`ere, A., and Knyazikhin, Y.: Investigation of a model inversion technique to estimate canopy biophysical variables from spectral and directional re-flectance data, Agronomie, 20, 3–22, 2000.