EFFICIENT MULTIPLE HEART DISEASE DETECTION SYSTEM USING
SELECTION AND COMBINATION TECHNIQUE IN CLASSIFIERS
G. Revathi and L. Vanitha
Electronics and Communication Engineering, Prathyusha Institute of Technology and Management, Chennai, India E-Mail: [email protected]
ABSTRACT
In this work selection and combination technique is used to enhance the performance of classifiers. The main objective of the work is to select efficient classifiers, from a group of seven classifiers, based on the error rate and combining them, to determine multiple heart diseases simultaneously. The classifiers are combined efficiently based on the decision of each classifier thus improving the classification accuracy of the signal. Heart ailments are the major health problem in the current scenario. These ailments in heart may even lead to death when not found at correct time. In recent years rate of patients with heart disease is increasing due to stress and unhygienic activities etc. This work is mainly done to develop an efficient detection system of multiple heart ailments. Three types of ECG signal, Normal, Arrhythmia and Sudden cardiac arrest signal is taken from physionet database is used as input signal.
Keywords: heart disease detection, sudden cardiac death (SCD), arrhythmia, electro cardiogram (ECG).
1. INTRODUCTION
Arrhythmia occurs due to the change in heart beat rate or due to alterations in beat to beat interval. Arrhythmia usually occurs in two situations when heart beats too fast or when heart beats too slow. When beat is fast it is tachycardia, it is usually harmless and occurs in persons involved in physical activity. When heart beat too slowly, it is bradycardia, this needs greater attention because heart cannot pump enough blood to organs. This leads to damage to organs and life threatening situations. SCD is due to failure in heart function. SCD causes Electrical disturbance in heart which leads to malfunction in pumping action this causes stoppage of blood flow to the body. SCD occurs when blood flow to the portion of heart is blocked. In this work, multiple heart disease detection system is designed by selecting efficient classifiers based on the individual classifier performance and is combined by weighted majority voting system.
The organization of this paper is as follows, literature survey is discussed in section II. Section III deals with methodology of proposed detection system. The results are summarized and discussed in section IV. Section V gives conclusion.
2. LITERATURE SURVEY
Haibo He [1] described a SSC algorithm to combine classifier based on signal strength. Pablo A. Dalbem [12] described an immune inspired approach, to design ensembles of heterogeneous neural network. Here a distribution algorithm is estimated that replaces probabilistic model for representing joint distribution of promising solutions. Usman Rashed [17] designed an algorithm to detect the chances of myocardial infarction beforehand on the basis of spectral analysis of an ECG. Himanshu Gothwal [5] described a cardiac arrhythmias detection using Fast Fourier transform and artificial neural network. Sharanyan [7] introduced a work based on classification of speech signals and reduction of training
sets for classification was analyzed. Rui-Min Shen [13] used kernel functions to improve the performance of support vector machine classifiers. Youglin Li [2] evaluates an algorithm to predict arrest with lower accuracy. A clustering based approached for generating ensemble of classifier was described by Ashfaqur Rahman [4]. Here the decision of a test pattern is derived by finding the decision of the base classifier at each layer. Nicolas Garcia [11] developed an ensemble of classifiers using instance weighted selection. Here boosting by instance selection method was used, when noise is added to datasets the complexity of the classifier is reduced.
3. METHODOLOGY
The proposed work consists of two datasets 1. Dataset 1 (Arrhythmia and normal) 2. Dataset 2 (SCD and normal)
The training phase consists of five modules, they are Data acquisition
HRV analysis Segmentation Classifier selection
Combination using weighted majority voting.
The testing phase consists of four modules, they are Data acquisition
Segmentation HRV analysis Segmentation
Figure-1. Block diagram for heart ailments detection during training phase.
Figure-2. Block diagram for heart ailments detection during testing phase.
A. Data acquisition
The ECG signals were obtained from the MIT-BIH physionet database. Physionet [17] is the collection of physiologic signals and uses open source software called physio tool kit. Physiobank consists of digital recordings of physiologic signals. The MIT-BIH database consists of many ECG databases of both normal and abnormal patients. Three databases are considered for this work is Normal sinus rhythm, Arrhythmia, and Sudden cardiac death. The database consists of 10 patients in arrhythmia, 10 patients in SCD and 10 patients in normal sinus rhythm. Each data consists of 1 hour signal. Each data splits into 10 segments, each segment of 5 min. Thus in total of 300 signals (100 arrhythmia, 100 SCD and 100 normal), 210 signals is used in training phase and 90 signals are used in testing phase.
B. HRV analysis
Heart rate variability (HRV) is the degree of fluctuation in the length of the intervals between heart beat. It is the beat to beat alterations in the heart rate. Detection of R peak and peak cancellation are the two main process involved in analysis of HRV [12]. The fast variation in heart rate leads to changes in sympathetic and vagal activity this causes variation in the RR interval (R peak). HRV analysis is done to estimate power spectrum in different frequency band (lower frequency band and higher frequency band). HRV measurement is done with time domain and the frequency domain. HRV measurement in time domain includes SDNN (standard deviation of NN interval), SDANN (standard deviation of average of NN interval) and RMSSD (square root of mean of the squares of the differences between adjacent NN intervals). HRV measurement in frequency domain includes LF (low frequency), HF (high frequency), LF / HF (ratio of LF power to HF power).
C. Segmentation
Segmentation is the process of dividing the data into multiple segments. The goal of segmentation is to simplify the representation of data more meaningful for easier analysis. The ECG signals from the MIT-BIH physionet databases are segmented. As 5 min of ECG signal is sufficient to extract the HRV parameters. Each segment is of 5 min interval. Each 5 min segmented signal is processed to detect R peak and peak cancellation to get NN interval, this is done to get the time domain and the frequency domain parameters Training phase.
D. Classifier selection
The classifiers used for dataset 1 are Support vector machine, Principal component analysis, Adaptive boost classifier, Associative rule mining and Back propagation network and classifiers used for dataset 2 are PNN, KNN, SVM, Decision Tree algorithm and Discriminant analysis. Here three types of signals is used from the physionet database [17] includes normal sinus rhythm, arrhythmia, sudden cardiac death. From the set of seven classifiers three efficient classifiers are selected using absolute error estimation technique for the classification of multiple heart diseases simultaneously. Absolute error calculation brings out the magnitude difference between actual and individual values of the signal.
Figure-4. Classifier combination 2.
E. Combining using weighted majority voting
The decision of the three efficient classifiers is combined using the weighted majority voting system [1]. Majority voting rule selects the class with more than half of the votes
(1)
where wj is the weight coefficient for classifier
F. Classification
G.
Support Vector Machine (SVM)
SVM [5] is a binary classifier. The main goal of the SVM is to separate the two classes. Equation to separate the set of training vector to two separate classes with a hyper plane is
<w, x> + b = 0 (2)
Where ‘w’ is the normal vector, ‘x’ is the observed data and ‘b’ is the bias term. ‘w’ and ‘b’ defines a boundary that maximizes the margin between data of two classes. The input ‘x’ is classified, depending upon the sign of the function. SVM generates hyper plane for discriminating two classes.
Principal Component Analysis (PCA)
PCA develops small artificial variable called principal components [21] and this produces variances in the observed variable. It is used for compression and classification of data. The purpose of PCA is to reduce the dimensionality of the dataset by finding new set of variable from the original set of variables.
Associate rule mining
Associative rule mining uses two criteria such has support and confidence to bring out keen relationships to analyze the data. It is used to analyze and predict the behaviour of the system. It can build programs capable for machine learning.
Probabilistic Neural Network (PNN)
It is a feed forward neural network [22], which was derived from Bayesian network and a statistical algorithm called kernel fisher discriminant analysis. PNN is used in classification problems.
Decision tree algorithm
A decision tree is a decision support tool [20] that uses treelike graph or models of decisions. It includes events outcomes, cost of resource and utility. It is a descriptive means for calculating conditional probabilities.
Discriminant analysis
Discriminant analysis is used to combine the linear combination of features which separates’ two or more classes of objects. The resulting combination may be used as a linear classifier, this is most commonly used for dimensionality reduction.
k- Nearest Neighbour (K-NN)
It is a non parametric method used for classification and regression. It is an instance based learning system and is also called as lazy algorithm. It works based on k nearest value its neighbours.
Testing phase
The testing signal is given as input to the testing phase in proposed system. From the training phase the efficient classifier is selected and combined using weighted majority voting system and is used in testing phase.
Performance evaluation
Performance during training and testing phase is evaluated by determining the efficiency of combined classifier. The performance of the 7 classifiers in each dataset is calculated by finding error rate of each classifier. The error rate is inversely proportional to efficiency. When the error rate increases, the efficiency gets decreased and vice versa.
The error rate is estimated by,
(3) A – Actual class
D – Determined class T – Total number of classes
Using the error estimation technique the performance of each classifier is determined. In this work, the efficient 3 classifiers among the total of 7 classifiers is selected and will be fed has input to majority voting technique for the combined decision.
4. RESULTS AND DISCUSSIONS
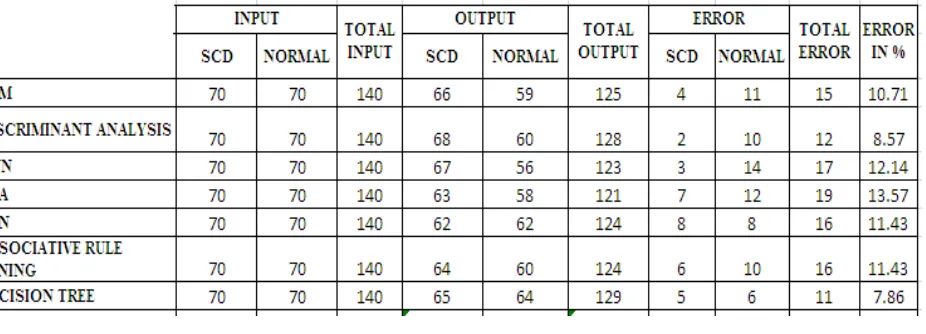
classification. Since the classifiers SVM, KNN, PNN have low error percentage compared to other classifiers, these three classifiers are considered. Table-3 gives the performance of combined decisions of SVM, KNN, PNN. Table 4 explains the error estimation of classifiers during training phase for SCD classification, it is found that the classifiers Decision tree, Discriminant analysis, SVM has low error rate. Table-5 shows the performance analysis of combined classifiers for SCD data set during training phase. Table-6 shows the performance analysis of combined classifiers during testing phase for dataset of arrhythmia and SCD & Normal. Table-7 shows the performance analysis of combined classifiers during testing phase for dataset of SCD and Normal. The result shows that the designed combined classifier efficiently
classifies the multi signal dataset of arrhythmia SCD and Normal.
[image:4.612.72.555.292.437.2]Table-1. Input signal for training and testing phase.
Table-2. Error estimation of 7 classifiers for Arrhythmia classification during training phase.
[image:4.612.85.548.583.750.2]Table-3. Performance analysis of combined classifier for arrhythmia database during training phase.
Table-5. Performance analysis of combined classifier for SCD database during training phase.
Table-6. Performance analysis of combined classifier during testing phase – Stage I.
Table-7. Performance analysis of combined classifier during testing phase – Stage II.
5. CONCLUSIONS
In this work, an efficient classifier is designed by using selection and combination technique. The experimental results show that the proposed classification system is capable to detect multiple heart diseases efficiently.
REFERENCES
[1] Haibo He and Yuan Cao. 2012. “SSC: A classifier combination method based on signal strength” IEEE Transactions on Neural Networks and Learning systems, Vol. 23, No.7, July.
[2] Yougqin Li, Joe Bisera, Max Harry Weil and Wanchun Tang. 2012. ”An algorithm used for ventricular fibrillation detection without interrupting chest compression” IEEE Transactions on Biomedical Engineering, Vol. 59, No. 1, January.
[3] Himanshu Gothwal. “Cardiac arrhythmias detection in an ECG beat signal using fast fourier transform and artificial neural network”
[4] A. Tauqir, S. Akram and A. H. Khan. “Non invasive induction model for implantable biomedical micro systems pacemaker to monitor arrhythmic patients in body area network”
[5] Sharanyan and Asim Mukherjee. 2010. “Performance analysis of support vector machines as classifier for voiced and unvoiced speech” International conference computer and communication technology”.
[6] Bin Wang and Hsiao-Dong Chiang. 2011. ELITE: Ensemble of Optimal Input-Pruned Neural Networks Using TRUST-TECH, IEEE Transactions on Neural Networks, Vol. 22, No. 1, January 2011.
[7] N.Liu, Z.X.Koh, G.B. Huang, W. Ser and M. E. H. Ong. 2011. “Patients outcome prediction with heart rate variability and vital signs,” J. Signal process. syst, Vol. 64, pp.265-278.
[8] Pablo A. Dalbem Castro and Fernando José Von
System”, IEEE Transactions on Neural Networks, Vol. 22, No. 2, February.
[9] Rui-Min Shen and Young-Gng. 2004. “Modifications of kernels to improve support vector machines classifiers. Third international conference on machine learning and cybernetics, August.
[10] Michael D. Muhlbaier, Apostolos Topalis and Robi Polikar. 2009. “Learn++ .NC: Combining Ensemble of Classifiers With Dynamically Weighted Consult-and-Vote for Efficient Incremental Learning of New Classes”, IEEE Transactions on Neural Networks, Vol. 20, No. 1, January.
[11] Vanessa Gómez-Verdejo, Jerónimo Arenas-García and Aníbal R. Figueiras-Vidal. 2008. “A Dynamically Adjusted Mixed Emphasis Method for Building Boosting Ensembles, IEEE Transactions on Neural Networks, Vol. 19, No. 1, January.
[12] M.E.H. Ong, P. Padmaabhan, Y. H. Chan, Z. Lin, J. Overton, K. R. Ward and D. Y. Fei. 2008. “An observational prospective study exploring the use of heart rate variability as a predictor of clinical outcomes in pre-hospital ambulance patients,” Resuscitation, Vol. 78, pp. 289-297.
[13] Usmam Rashed and Muhamed Javed Mirza. 2008. “Identification of sudden cardiac death using spectral domain analusis of ECG”, IEEE conference.
[14] Role of fibrillatory waves amplitude as predictors of immediate arrhythmia termination after maze surgery of arterial fibrillation, International conference computing in cardiology, 2012.
[15] Terry Windeatt. 2006. “Accuracy/Diversity and Ensemble MLP classifier design”, IEEE Transactions on Neural Networks”, Vol. 17, No. 5, September.
[16] Nicolas Garcia Pedrajas. 2009.”Constructing ensemble of classifiers by means of weighted instance selection” , IEEE Transactions on Neural Networks, Vol. 20, No. 2, February.
[17] http://www.physionet.org/cgi-bin/atm/ATM
[18]http://www.webmd.com/heat-disease/guide/sudden-cardiac-death.
[19] Liu Sheng. 2002. “Disease classification using support vector machine”, International conference in neural information processing.
[20] Zhang Wei. 2013. “Study on classification rules of hypertension based on decision tree” IEEE international conference on software engineering and service science.
[21] Nait Hamoud. 2010. “Two novel methods for multiclass ECG arrhythmias classification based on PCA and fuzzy support vector machine and unbalanced clustering”. International conference on web and machine intelligence.
[22] Dubey. 2012. “Blind modulation classification based on MLP and PNN”, Students conference on engineering and system.