A New Method for Predicting the UL of
Circular CFST Columns
Xinmeng Yu*, Baochun Chen
College of Civil Engineering, Fuzhou University, Fuzhou, China Email: *[email protected], [email protected]
Received April 27, 2013; revised May 27, 2013; accepted June 5,2013
Copyright © 2013 Xinmeng Yu, Baochun Chen. This is an open access article distributed under the Creative Commons Attribution License, which permits unrestricted use, distribution, and reproduction in any medium, provided the original work is properly cited.
ABSTRACT
Concrete filled steel tube structures have gained booming development in recent decades, especially in China. Simpli- fied methods have been proposed in design codes, such as the Eurocode 4 (EC4) and the China engineering and con- struction specification (CECS). In EC4, the confinement effect is reasonably related to slenderness and load eccentricity. The CECS method is much straight forward in that the slenderness ratio and load eccentricity are treated as independent reduction factors. To make use of the advantages of both the CECS and the EC4 methods, the CECS method is modi- fied to consider the confinement effect associated with slenderness and load eccentricity. It is shown that the proposed method can predict well the ultimate load capacity of circular section concrete filled steel tube columns.
Keywords: Concrete Filled Steel Tube Column; Ultimate Load Capacity; Simplified Method; Reduction Factor
1. Introduction
Concrete filled steel tube (CFST) columns have been widely used in high rise buildings and bridges. Previous researches have shown that the mutual strengthening mechanism of the steel tube and the concrete core helps to gain higher load capacity, especially in circular CFST columns. This mechanism has attracted significant re- search efforts on the development of simplified methods to predict the ultimate load capacity (UL) of CFST col- umns. The outcomes have been incorporated into design codes, such as EC4 [1], LRFD [2], AIJ [3], CECS [4], DL/T [5] and so on.
The philosophy behind these methods may be different; however, the accuracy of them is reasonable in that they are more or less based on statistical analysis on available test data. No doubt, this is a right way in scientific re- search and application.
However, since each method has its own material properties and methodology, the equivalency behind them seems vague. It is meaningful to develop a new method which makes the best of the pros but cons of the methods. This research aims to derive a new UL predic- tion method based on CECS and EC4 crosswise.
2. Simplified UL Prediction Methods in
CECS and EC4
In CECS, the UL of a CFST column is calculated by
0
=
CECS CECS CECS CECS
u l e
N N (1)
where is the cross section resistance derived from limit equilibrium state [6]; and are
0 CECS
N
CECS l
CECS
e
independent reduction factors considering stability and load eccentricity, respectively, obtained from regressive analysis on test data.
0 1 +
CECS c c
N f A
(2)
1 for
1 0 115 4 for 4
l
CECS L / D
. L D L / D
4
(3)
1 if 1 55 1 1 85
0 3
if 1 55 0 4
CECS e
c c
CECS e
c c
e .
. e / r r
. e
.
e / r . r
(4)
Note that there is no eccentricity limit in Equation (4). In EC4, the UL of a CFST column is calculated by
4 0
4 0 EC
where 4 0
EC
N is the cross section resistance considering the influence of confinement effect, which is related to load eccentricity and slenderness.
4
0 1 0 25
EC
a a y c c c c c c a
N A f A f A f . 1
(6) where a and c are the steel strength reduction fac- tor and concrete strength enhancement factor (due to confinement effect), respectively, when eD10 and0 5.
; is the relative slenderness of the CFST column. Otherwise, the strengthening effect is neglected.
0 0
0
1 10 1
0 25 3 2 1
a a a
a
e D .
;
(7)
1 1 2
2 2
1 1 10
4 9 18 5 17 0 y
c c c c
c
c
f t
e D D f
. .
; 0 ;
(8)
is analogues to the column buckling resistance reduc- tion factor derived theoretically from a steel column with initial out-of-straightness deflection at mid-height with a little modification [7].
2 2 1
(7)
where is a parameter depending on internal reinforc- ing bars. When the axial reinforcing ratio is no greater than 3%,
20 5 1 0 21. . 0 2.
(8)
Apparently, the EC4 approach is different from CECS in that the load eccentricity is no longer an independent parameter, neither is the slenderness effect. Therefore, the philosophy behind CECS and EC4 is different. In addition, the stress-strain relationships of confined con- crete are different.
In CECS, a nonlinear restrained concrete property is employed.
1 1 5 2
CECS
cc c c c
f f . p f p f (9)
In EC4, the restraining effect can be expressed in the following form as prescribed in EC2 [8].
4
1 2
EC
cc c
f C C p f (10)
where C1 and C2 depends on the lateral confinement pressure, p. That is
4 1 000 5 00 for 0 05
1 125 2 50 for 0 05
c c
EC cc
c c
. . p f p .
f
. . p f p .
f f
2
(11)
From the illustration above, it is clear that the CECS method is much simpler. However, the effects of load eccentricity and slenderness on the strength of concrete
are not clear in CECS. This triggers the motive of this research to develop a method which absorbs the merits of these two methods: inheriting the simple framework of the CECS method, but explicitly enriching the reduction factors with the confinement characteristics prescribed in the EC4.
3. Development of a Simplified Method for
UL Prediction of Circular CFST Columns
3.1. The Cross Section Resistance of CFST Columns
In limit equilibrium state, the steel tube reaches its ulti- mate strength, i.e., gets yielded. From Equation (10), it is
known that the concrete strength is a function of lateral pressure governed by the state of the steel tube. The UL of the CFST column section is the maximum combina- tion of the stresses in steel and concrete. It is assumed here that the stress distributions on the concrete section and the steel section are both uniform.
The stress distribution in a thin wall steel tube can be reasonably assumed to be planar. When the tube gets yielded, according to the Von Mises yield criterion, we have
2 2
1 2 1 2 fy
(12) where 1 and2 are principal stresses in axial and la- teral directions; fy is the yield strength of tube steel. Note n 2, where n is the axial compressive stress.
It can be derived that
2 2 2 2
D
t p
t
D p (13)
And a 4 c
A t
A D (14)
Substituting Equations (13) and (14) into Equation (12) and rearranging, we have
2
2 2
1 3 c
n y
a a
A Ac
f p
A A
p (15) Therefore, at ultimate limit states, the load resistance of the cross section can be expressed as
2 2 20 c c 1 2 c a y 3 c c
a
A
N A f C C p f A f p pA
A
(16) The maximum value of N0 requires
2
0
2 2
2 2
3
1 0
c a
a c
c y
a
A
A p
A dN
A C dp
A
f p
A
Therefore, at ultimate limit states, the lateral pressure on the concrete core is
c
pk f (18)
where is the confinement effect factor,
A fa y
A fc c
, and
0 5 2
2
0 517 for 0 05 3
3
0 555 for 0 05 1
.
c c
. p .
k
. p .
C
f
f (19)
In engineering practice, such as in CFST bridges, 0 09.
, hence
0 517
k . (20)
It can be easily derived from Equations (16), (18) and (20) that
3
1 3 0 517 c 0 792
n y c
a A
k f . f . f
A
y (21)
And
0 1 125 c c 2 085 a y c c 1 125 2
N . A f . A f A f . (22) When eccentric loading and stability are not consid- ered, i.e., e0; 0, Equation (5) can be simplified as
4
0 1 1 975 1 2
EC
c c c c
N A f . A f
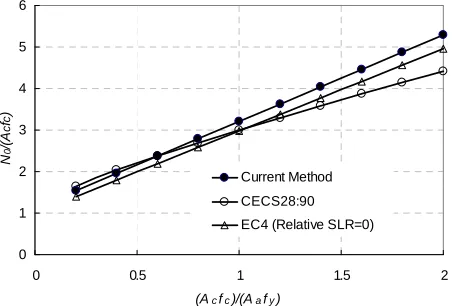
(23) It can be seen from Equations (22) and (23) that the cross section resistance calculated using this proposed method is about greater than that obtained from EC4 method. This difference can be regarded as a conserva-tive simplification in EC4. The comparison of the cross section resistances calculated by this method and CECS and EC4 methods is shown in Figure 1. The differenceamong three methods is not significant. It should be pointed out that the CECS method is a conser-
0 125. A fc c
vative simplification from N0 f Ac c
1 1 1.
as illustrated in [6].0 1 2 3 4 5 6
0 0.5 1 1.5 2
(Acfc)/(Aafy)
N
0
/(
A
c
f
c
)
Current Method
CECS28:90
EC4 (Relative SLR=0)
Figure 1. Comparison of the cross section resistances calcu-
3.2. The Influence of Slendernes
lated with different methods.
s
In EC4, the relative slenderness, , is the influences of slenderness: 1) the c
used to consider onfinement effect reduces with increase of ; 2) the stability decreases with increase of . In CECS, these two mechanisms are combined together into a factor, CECS
l
, which is ob- tained regressive from a large number of test data, adopting
ly
L D as a sole parameter ecting the con- figuration of
, negl
D t and material properties; When 20
L D UL of a CFST column is assumed to be governed by Eule ckling resistance.
tioned above, both methods are calibrated from test data. The different treatment on the
, the r bu As men
slenderness in- fluence between EC4 and CECS makes in Equa- tion (5) greater than CECS
l
in Equation (1). If the influ- ence of on the confinement effect is con dered, si i.e.,
0; 0
e , then an e lent parameter can be derived, that is
quiva
1 2
1 21
c c a c c a
c c A f
4 1 0 25
EC l
A f .
(24)
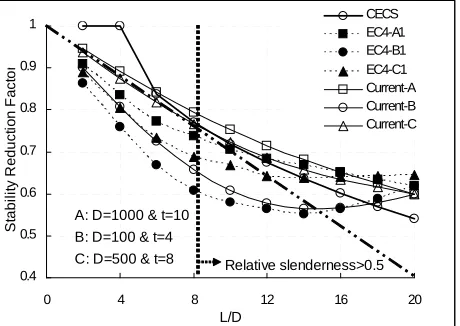
The comparison of the stability reduction fac EC4 (neglecting the limit of
tors of 0 5.
) and CECS is shown in Figure2. It can be seen from this figure that: 1)
4 EC l
values (the dash curves) proximately the mirror of
are ap
values (the solid curves) along the CECS ; 2)
curve D t has a significant influence on the reduc- tion factor; ) when 3 L D reaches 20, the EC4
l
curves go together, which indicates L D20 is a divide for Euler buckling. Ther , CECS and EC4 agree with each other again in this point, although the confinment effect is considered only when
efore
0 5.
.
From Figure2, it can be concluded that the influence
of D t is significant and therefore s uld be consid- ho ered in the reduction factor. By observing the sinusoidal
0.5 0.6 0.7 0.8 0.9 1
0 4 8 12 16 20
L/D
S
tabi
li
ty
R
educ
ti
on
F
ac
to
r
CECS EC4-A
EC4-B EC4-C
EC4-A1 EC4-B1 EC4-C1
A: D=1000 & t=10 B: D=100 & t=4
[image:3.595.61.288.555.708.2]C: D=500 & t=8 Relative slenderness>0.5
Figure 2. Comparison of stability reduction factors of χ (EC4-A, B & C), EC4
l (EC4-A1, B1 & C1) and l
(unit of D and t: mm).
shape of the EC4 cu s, a new method for predictin stability reduction can
rve g the
be obtained, as shown in Equation (25).
4t L π 1 L
sin 1
20 50
l n
D D D (25) The parameter n in Equation (25) govern
the curve. Through curve fitting, the curves agree well w
s the shape of
ith both EC4 and CECS curves when n1 2. , as shown in Figure 3. This factor, i.e., Equation (25), in-
corporates the advantage of CECS l
, with extended slen- derness boundary, and EC4, which includes the influence of D t.
3.3. Th Effect of Load Eccentricity e
reduces with As the confinement strengthening effect
eccentric loading, a reduction factor e is used to ac- count for this change. This factor in CECS can be used in a wide range of eccentricity conditions, as shown in Equation (4), which stems from the M-N curve analysis
followed by curve fitting [6]. However, in EC4, the load eccentricity induced influence is integrated into the cal- culation of cross section resistance when eD10. Similar to CECS
l
, an equivalent factor, EC4 e
, can be obtained by letting e0; 0.
4 1 2 9 75 1 1
1
EC e
. e / D
2 1 2 1 2
0 1 0 2
e / D . e / D .
(26 It is seen from Equation (26) that
)
4 EC e
is a function of both and e D. However, in only th ce
CECS, e ec- ntricity is considered (see Equation (4)). The compare- son of EC4
e
and CS is shown in
Figure4. in which
the
CE e
e D is allowed to extend to 0.2. Although there is a huge difference between these two methods to deal with
0.4 0.5 0.6 0.7 0.8 0.9 1
0 4 8 12 16 20
L/D
St
ab
il
it
y
R
e
d
u
c
ti
o
n
F
a
c
to
r
CECS EC4-A1 EC4-B1 EC4-C1 Current-A Current-B Current-C
A: D=1000 & t=10 B: D=100 & t=4
C: D=500 & t=8 Relative slenderness>0.5
Figure 3. Comparison of stability reduction factors of l
0 0.2 0.4 0.6 0.8 1
c
to
r
0 0.2 0.4 0.6 0.8 1
e/rc
Lo
a
d E
c
ce
nt
ri
c
it
y
R
e
du
c
ti
o
n F
a
(current), lEC 4
and CECSl (unit of D and t: mm).
CECS EC4-A EC4-B EC4-C Current-A Current_B Current_C
A: t/D=10/1000, fc=40, fy=325
: t/D=4/100, fc=40, fy=325 B
C: t/D=8/500, fc=40, fy=325
Figure 4. Comparison of the load eccentricity reduction fac- tors of φe,
EC e 4
and
ce icity end reduction with eccentricity similar. One compromise to this disagreement is to
CECS e
.
load ec ntr , the tr of is
create an exponential function with both and e D as its parameters, as given in Equation (27).
exp 1 2
e
e m
D
(27) The 1 2
param that
in Equation (27) is tak (23). The eter m is used to calibr
is
en from Equation ate curve fitting. It found when m0 85. , the e agrees well with both EC4
e
and CECS e
, as shown in Figure4.
4. The UL of CFST Columns Predicted by
Current Method
From previous derivation, it is therefore proposed th UL of a CFST column
at
the to be predicted by
0 20
20 e l
u
cr
N L D
N
N L D
(28)
0
N , l and e d (27),
where can be calcul
tions (2 an respectively. When
ated from Equa-
2), (25) L D20,
the UL is ov ned by e Euler buckling resistance.
4.1. The UL of Eccentrically Loaded CFST Columns
g er th
In order to understand the behaviour of eccent ed CFST co
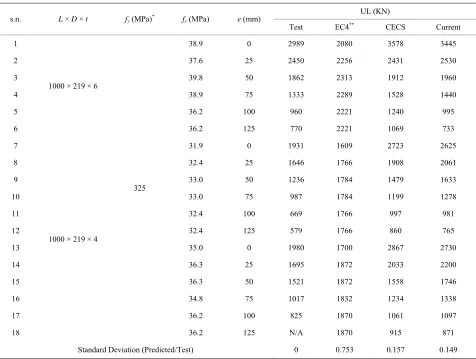
rically load lumns, Chen et al. [9] tested 18 speci-
mens with various load eccentricity and D t ratios. The specimen details, test results and UL predictions using different methods are listed in Table 1.
It is clear from Table 1 that when the load eccentricity
is low, the EC4 prediction is fairly conservative. When the load eccentricity is high, the N-M curve has to be
[image:4.595.59.289.536.699.2]loa steel tube Table 1. Comparison of the predicted and measured ultimate d r sistances of eccentrically loaded concrete filled
columns.
e
UL (KN) s.n. L × D × t fy(MPa)
*
fc(MPa) e (mm)
Test EC4** CECS Current
1 38.9 0 2989 2080 3578 3445
2 37.6 25
100 1000 × 219 × 6
1931 2625
25
10 33.
100
1980 2867 2730
25
100 1000 × 219 × 4
325
Standard Deviation (Predicted/Test) 0 0. 0.
2450 2256 2431 2530
3 39.8 50 1862 2313 1912 1960
4 38.9 75 1333 2289 1528 1440
5 36.2 960 2221 1240 995
6 36.2 125 770 2221 1069 733
7 31.9 0 1609 2723
8 32.4 1646 1766 1908 2061
9 33.0 50 1236 1784 1479 1633
0 75 987 1784 1199 1278
11 32.4 669 1766 997 981
12 32.4 125 579 1766 860 765
13 35.0 0 1700
14 36.3 1695 1872 2033 2200
15 36.3 50 1521 1872 1558 1746
16 34.8 75 1017 1832 1234 1338
17 36.2 825 1870 1061 1097
18 36.2 125 N/A 1870 915 871
0.753 157 149
Note: *
fcis converted from cubic strength byfc0 67. fcube; The
** limit of relative slenderness in E ethod, w 0.5, is no ered.
3 to The
the best and smooth prediction re
clusions
CFST columns can be predicted by methods with different consideration
C4 m hich is t consid
4.2. UL of CFST Column with Various L/D
0.6 0.8 1
A number of CFST column tests with L/D vary from
50 were conducted during 1982 to 1983 by Cai et al.
1.2
es
ul
t
1.4
1 2 3 4 5 6
Specimen Number
Pre
dic
to
in
/
Te
st
R
Nec4/Nt Ncecs/Nt Ncurr/Nt
specimen and test details can be found in [6]. Only the test results of specimens in Batch II are taken hereby. The UL of the specimens predicted by current method as well as those calculated using CECS and EC4 are com- pared in Figure5.
Again, the EC4 prediction is conservative and the proposed method gives
sults.
[image:5.595.310.537.498.647.2]5. Con
Figure 5. Comparison of the UL prediction of CFST col- umns by three different methods.
but cares less on the cross section parameters.
A simplified method is veloped by inheriting the
tricity reduction factors The UL of circular
various simplified
on confinement effect. These methods have their pros and cons. The EC4 method considers the influence of load eccentricity and slenderness on the confinement effect. The CECS method is simple and straight forward,
de
with cross section configuration influences in accordance enable fin
C4.
.1: General Rules and Rules ropean Communities, Brus-sels, 2004.
[2] American Inst on (AISC),
“Man-lled Steel Tubular Structures,” Architectural
fication for Design and
ete Compos-
hina Communications Press,
of Concrete-Filled Composite Columns,” Ins
with those implied by the EC4 method, so as to
er tuning capability than in CECS. Therefore, the proposed method makes the best of both EC4 method and CECS method.
The proposed method is derived from material pro- perties in the limit equilibrium state, adopting the re- strained concrete properties prescribed in EC2 and ex- tending the boundary of load eccentricity and relative slenderness limit in E
Validation against a series of tests shows that the pro- posed method can predict the UL of circular CFST col- umns with good accuracy.
REFERENCES
[1] Eurocode 4 (EC4), “Design of Composite Steel and Con- crete Structures, Part 1
Buildings,” Commission of Eu for
itute of Steel Constructi
ual for Structural Steel Buildings: Load and Resistance Factor Design (LRFD),” Chicago, 2005.
[3] AIJ, “Recommendations for Design and Construction of Concrete Fi
titute of Tokyo, Japan, 1997.
[4] China Association of Engineering and Construction Stand- ardization-CECS 28:90, “Speci
Construction of Concrete Filled Steel Tubular Struc- tures,” China Planning Press, Beijing, 1991.
[5] The Electric Power Industry Standard of PRC: DL/T 5085-1999, “Code for Design of Steel-Concr
ite Structure,” Issued by State Economic and Trade Commission of PRC, 1999.
[6] S. H. Cai, “Modern Steel Tube Confined Concrete Struc- tures (Revised Edition),” C
Beijing, 2007.
[7] J. Y. R. Liew and D. X. Xiong, “Effect of Preload on the Axial Capacity
Journal of Constructional Steel Research, Vol. 65, No. 3, 2009, pp. 709-722. doi:10.1016/j.jcsr.2008.03.023 [8] Eurocode 2 (EC2), “Design of Concrete Structures, Part
1-1: General Rules and Rules for Buildings,” Commis-
te Filled
omenclatures
sion of European Communities, Brussels, 2004.
[9] B. C. Chen, Z. J. Ou, L. Y. Wang and L. H. Han, “Ex- perimental Study on Carrying Capacity of Concre Steel Tubular Column under Eccentrically Load,” Journal of Fuzhou University-Natural Science Edition, Vol. 30, No. 6, 2002, pp. 838-844.
N
a
A : Steel area of the cross section of CFST column (mm2)
c
A : Concrete area of the cross section of CFST col- umn (
uter diameter of CFST column (mm)
e:L
oung’s Modulus of steel and secant modulus of
column,
L:Effe
Cross section resistance of CFST column calcu- lated by method i
mn calcu- lated
mm2)
D: O
oading eccentricity (mm)
Ea, Ecm:Y concrete
EI eff:Bending stiffness of CFST
EI eff E Ia a0 6. E Icm cctive length of CFST column (mm)
0 i N :
i u
N : Ultimate load capacity of CFST colu
by method i
plR
N :Plastic resistance of the cross section of CFST
column, plR
a y
c c
Euler buckling resistance of CFST column,
N A f A f
cr
N :
2 2
cr eff
N EI L
Ia, Ic:Second moment of inertias of steel tube and con- crete core section
P:Lateral confinement pressure on concrete core rc:Radius of concrete core
l
, e: Current st tion factor and load eccentrici
ability reduc y reduction factor t
i l
, i e
: Stability reduction factor and load eccentric- ity reduction factor of method i
: A factor considering the influence of internal axial reinforcing bars in EC4
: Stability reduction factor in EC4
: Relative slenderness,
1
pl
R Ncr A fc c Ncr
1
N
, 2: Principal stresses in axial and lateral direc- tions
: Confinement effect factor,