Evaluation of Optimal Parameters for machining with
Wire cut EDM Using Grey-Taguchi Method
S V Subrahmanyam*, M. M. M. Sarcar**
*Research scholar, Dept of Mechanical Engg, Gayatri Vidya Parishad College of Engineering, Vizag, A.P. INDIA **Professor and Head of the Department of Mechanical Engg.,A.U.College of Engineering, Vizag, A.P. INDIA
Abstract- The main objective of this work is to demonstrate the optimization of Wire Electrical Discharge Machining process parameters for the machining of H13 HOT DIE STEEL, with multiple responses Material Removal Rate (MRR), surface roughness (Ra) based on the Grey–Taguchi Method. taguchi’sL27(21x38) Orthogonal Array was used to conduct experiments, which correspond to randomly chosen different combinations of process parameter setting, with eight process parameters: TON, TOFF, IP, SV WF, WT, SF, WP each to be varied in three different levels. Data related to the each response viz. material removal rate (MRR), surface roughness (Ra) have been measured for each experimental run; With Grey Relational Analysis Optimal levels of process parameters were identified. The relatively significant parameters were determined by Analysis of Variance. The variation of output responses with process parameters were mathematically modeled by using non-linear regression analysis. The models were checked for their adequacy. Result of confirmation experiments showed that the established mathematical models can predict the output responses with reasonable accuracy.
Index Terms-Grey-Taguchi method, MRR, H13, WEDM
I. INTRODUCTION
ne of the important non-traditional machining processes is Wire Electro Discharge machining (WEDM), used for machining difficult to machine materials like composites and inter-metallic materials. WEDM involves complex physical and chemical process including heating and cooling. Increased use of newer and harder materials like titanium, hardened steel, high strength temperature resistant alloys, fiber-reinforced composites and ceramics in aerospace, nuclear, missile, turbine, automobile, tool and die making industries, a different class of modern machining techniques such as Wire Electrical Discharge Machining (WEDM) have emerged. These techniques satisfy the present demands of the manufacturing industries such as better finish, low tolerance, higher production rate, miniaturization etc.
In WEDM operations, material removal rate determine the economics of machining and rate of production, surface roughness is the measure of quality. Proper selection of process parameters is essential to obtain good surface finish and higher MRR. In setting the machining parameters, particularly in rough cutting operation, the goal is - the maximization of MRR, minimization of SF. The machine tool builder provides machining parameter table to be used for setting optimal machining parameters, but in practice, it is very difficult to utilize the optimal functions of a machine owing to there being too many adjustable machining parameters. This process relies heavily on the experience of the operators.
With a view to alleviate this difficulty, various investigations have been carried out by several researchers for improving selection of optimal parametric values for the MRR, Surface Finish [1–5]. However, the problem of selection of machining parameters is not fully depending on machine controls rather material dependent. To improve manufacturing processes with single performance characteristic, the optimal selection of process parameters Taguchi method has been extensively adopted. Traditional Taguchi method cannot solve multi-objective optimization problems. To overcome this, the Taguchi method coupled with Grey relational analysis has a wide area of application in manufacturing processes [6– 11]. To deal with a poor, incomplete, and uncertain system there is a need for a crucial mathematical criteria, Deng (1982) [12] proposed grey relational analysis to fulfill that need. With the grey relational analysis, a grey relational grade is obtained to evaluate the multiple performance characteristics. As a result, optimization of the complicated multiple performance characteristics can be converted into the optimization of a single grey relational grade. The grey– Taguchi method was established for combining both grey relational analysis and the Taguchi method. This approach can solve multi-response optimization problem simultaneously.
approximate interrelation among various process parameters as well as response variables. Finally, the analysis of variance (ANOVA) and necessary confirmation tests were conducted to validate the experimental results.
II. EXPERIMENTATION AND DATA COLLECTION
2.1. Work Material and tool/cutting tool material
Hot die steel H13 has been considered in the present set of research work. In the recent past H13 gained dominance, where high strength and/or hardness is required at elevated temperatures. The work piece material chemical composition of the is shown in Table 1 Brass wire of 0.25 mm diameter was used as tool electrode in the experimental set up. This is a diffused wire of brass of type ELECTRA_Duracut.0.25 mm diameter stratified wire (Zinc coated copper wire) with vertical configuration has been used and discarded once used. High MRR in WEDM without wire breakage can be attained by the use of zinc coated copper wire because evaporation of zinc causes cooling at the interface of work piece and wire and acoating of zinc oxide on the surface of wire helps to prevent short-circuits (Sho et al., 1989).
The table 1: the chemical composition of H13 Hot Die tool steel.
Material C Cr Mn MO Si V S P Fe
H13 0.395 5.25 0.35 1.475 1.00 1.00 0.0025 0.0125 Balance %wt
2.2. Schematic of machining
All the experiments were conducted on SPRINTCUT (AU) WITH PULSE GENERATOR ELPULS 40A DLX CNC Wire-cut EDM machine. In this machine, all the axes are servo controlled and can be programmed to follow a CNC code which is fed through the control panel. All three axes have an accuracy of 1μm. Through an NC code, machining can be programmed. The size of the work piece considered for experimentation on the wire-cut EDM is 25 mm x 5 mm x 5 mm.A small gap of 0.025 mm to 0.05 mm is maintained in between the wire and work-piece. The high energy density erodes material from both the wire and work piece by local melting and vaporizing. The di-electric fluid (de-ionized water) is continuously flashed through the gap along the wire, to the sparking area to remove the debris produced during the erosion. A collection tank is located at the bottom to collect the used wire erosions and then is discarded. The wires once used cannot be reused again, due to the variation in dimensional accuracy.
2.3. Process parameters and design
Input process parameters such as PulseOntime (TON), PulseOfftime (TOFF), PeakCurrent (IP), SparkgapVoltageSetting (SV), Wiretensionsetting (WT), WireFeedratesetting (WF), ServoFeedSetting (SF), Flushingpressureofdielectric fluid (WP) used in this study are shown in Table 2. Each factor is investigated at three levels to determine the optimum settings for the WEDM process. These parameters and their levels were chosen based on the review of literature and as per the few preliminary pilot experiments that were carried out by varying the process parameters to find their significance and relevance to the response parameters.
Table: 2 wire EDM input parameters and their levels
Sl.No. PARAMETERS SYMBOL LEVEL1 LEVEL2 LEVEL3 UNITS
1 PulseOntime TON 115 131 -- µsec
2 PulseOfftime TOFF 53 58 63 µsec
3 PeakCurrent IP 130 180 230 Amper
e 4 SparkgapVoltageSetting SV 20 30 40 Volts
5 Wiretensionsetting WT 2 3 4 Kg-f
6 WireFeedratesetting WF 4 5 6 m/min
7 ServoFeedSetting SF 500 1300 2100 mm/mi
n 8 Flushingpressureofdielect
ricfluid
WP 2 3 4 Kg/cm
In this study most important output performances in WEDM such as Material Removal Rate (MRR), Surface Roughness (Ra) were considered for optimizing machining parameters. The surface finish value (in μm) was obtained by measuring the mean absolute deviation, Ra (surface roughness) from the average surface level using a Computer controlled surface roughness tester. The Material Removal Rate (MRR) is calculated [13] as, MRR =k t vcWhere, k is the Kerf width (mm), t is the thickness of work piece (mm), vc is the Cutting speed (mm/min).
III. PARAMETRIC OPTIMIZATION
3.1 Data generation as per Taguchi L27 (38) OA design
The WEDM process consists of three operations, a roughing operation, a finishing operation, and a surface finishing operation. The performance of various types of cutting operations is judged by different measures. In rough cutting operation both metal removal rate and surface finish are of primary importance. In finish cutting operation, the surface finish is of primary importance. Dimensional accuracy is highly dependent on cutting width. This means that the rough cutting operation is more challenging because three goals must be satisfied simultaneously. Hence, the rough cutting phase is investigated in the present approach considering three performance goals like MRR, SF.
As per the design catalogue (Peace, 1993) prepared by Taguchi, L27(21*37) Orthogonal Array design of experiment has been found suitable in the present work. Experiments have been carried out using Taguchi’s L27(21*37) Orthogonal Array (OA) experimental design which consists of 27 combinations of eight process parameters. It considers eight process parameters (without interaction) to be varied in three discrete levels. Based on Taguchi’s L27(21*37) Orthogonal Array design, the predicted data provided by the mathematical models can be transformed into a signal-to-noise (S/N) ratio.
The characteristic that higher value represents better machining performance, such as MRR, ‘higher-the-better, HB; and inversely, the characteristic that lower value represents better machining performance, such as surface roughness is called ‘lower-the-better’, LB. Therefore, HB for the MRR, LB for the SF have been selected for obtaining optimum machining performance characteristics. The loss function (L) for objective of HB and LB is defined as follows:
Here y2MRR,y 2
SF represent response for metal removal rate, surface finish and cutting width respectively and n denotes the number of experiments. The S/N ratio can be calculated as a logarithmic transformation of the loss function as shown below. The optimal setting would be the one which could achieve highest S/N ratio. The S/n ratios for the experimental results shown in Table3.S/N ratio for MRR = -10log 10( LHB );S/N ratio for SF = -10log 10 ( LLB).
Table3 S/ N RATIO VALUES
CONTROL FACTORS S/N RATIOS
SlNo TON TOFF IP SV WF WT SF WP MRR S/N Ra S/N
1 1 1 1 1 1 1 1 1 35.89394 -1.43764
2 1 2 2 2 2 2 2 2 42.03823 -4.13652
3 1 3 3 3 3 3 3 3 45.99407 -6.06392
4 1 1 1 1 1 2 2 2 40.14760 -3.31527
5 1 2 2 2 2 3 3 3 44.73276 -5.62067
6 1 3 3 3 3 1 1 1 41.41705 -3.16725
7 1 1 1 2 3 1 2 3 41.05234 -3.10672
8 1 2 2 3 1 2 3 1 44.52931 -5.77839
9 1 3 3 1 2 3 1 2 39.91621 -3.22736
10 1 1 1 3 2 1 3 2 44.10623 -4.84088
12 1 3 3 2 1 3 2 1 43.56661 -5.13445
13 1 1 2 3 1 3 2 1 41.51712 -4.20333
14 1 2 3 1 2 1 3 2 45.16939 -5.88050
15 1 3 1 2 3 2 1 3 39.07445 -1.79810
16 1 1 2 3 2 1 1 3 38.33068 -2.00741
17 1 2 3 1 3 2 2 1 42.74788 -4.55773
18 1 3 1 2 1 3 3 2 44.55022 -5.50552
19 2 1 2 1 3 3 3 1 49.09923 -5.97706
20 2 2 3 2 1 1 1 2 46.41234 -4.32941
21 2 3 1 3 2 2 2 3 48.02734 -4.99354
22 2 1 2 2 3 3 1 2 45.46097 -3.41696
23 2 2 3 3 1 1 2 3 48.46029 -5.79178
24 2 3 1 1 2 2 3 1 49.28949 -6.06392
25 2 1 3 2 1 2 3 3 49.49535 -6.56759
26 2 2 1 3 2 3 1 1 45.43859 -3.17230
27 2 3 2 1 3 1 2 2 48.19310 -5.22526
28 2 1 3 2 2 2 1 1 46.01640 -4.08615
29 2 2 1 3 3 3 2 2 47.64865 -4.78614
30 2 3 2 1 1 1 3 3 49.67074 -6.48565
31 2 1 3 3 3 2 3 2 49.62710 -6.49799
32 2 2 1 1 1 3 1 3 45.19889 -3.29972
33 2 3 2 2 2 1 2 1 48.29575 -5.44148
34 2 1 3 1 2 3 2 3 47.92865 -5.43219
35 2 2 1 2 3 1 3 1 48.87371 -5.96396
36 2 3 2 3 1 2 1 2 46.39099 -4.06867
However, traditional Taguchi method can optimize a single objective function; it cannot solve multi-objective optimization problem (Datta et al., 2006; Moshat et al., 2010). MRR, SF can be optimized individually by using this Taguchi technique. But it may so happen that, the optimal setting for a response variable cannot ensure other response variables within acceptable limits. But the aim is to go for such an optimal parameter setting so that all the objectives should fulfill simultaneously (maximum MRR, minimum SF) in one go. This can be achieved using grey based Taguchi method as discussed below. This method can convert several objective functions into an equivalent single objective function (representative of all desired response characteristics of the product/process), which would be maximized next.
3.2 Grey Relation Analysis (GRA)
In grey relational generation, the normalized data i.e. Ra surface finish corresponding to lower-the-better (LB) criterion can be expressed as [13]:
For MRR should follow higher-the-better criterion (HB), which can be expressed as:
where xi(k) is the value after grey relational generation, min yi(k) is the smallest value of yi (k) for the kth response, and max yi (k) is the largest value of yi (k) for the kth response. The normal ideal sequence for the responses is x0 (k ) (where k=1,2,3,...,27). The grey relational coefficient ξi(k) can be expressed as follows:
Where Δ0i= difference of absolute value x0( k) and xi (k); ψ is the distinguishing coefficient 0 ≤ψ ≤1; usually taken as 0.5 Δmin = the smallest value of Δ0i ; Δmax = the largest value of Δ0i . In GRA the grey relational grade is to reveal the degree of relation between the 27 sequences x0( k) xi(k ), ( k=1,2,3,...,27). After averaging the grey relational coefficients, the grey relational grade γi can be computed as:
Where γi is the grey relational grade and n is the number of performance characteristics. The best process sequence is taken as reference sequence x0(k).The intense relational degree between the reference sequence x0(k) and the given sequence xi (k) corresponds to the higher value of grey relational grade. Hence, higher grey relational grade means that the corresponding parameter combination is closer to the optimal.
3.3 Grey-Taguchi technique for multi-objective optimization
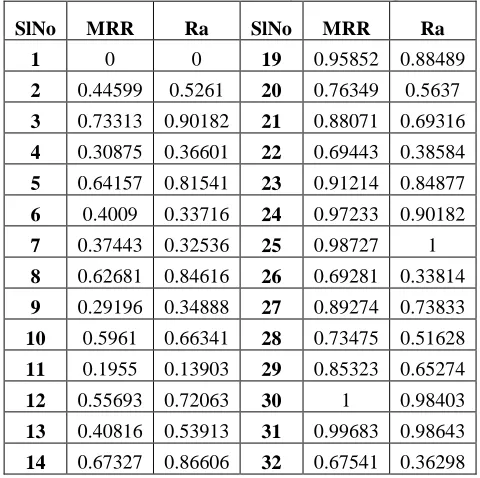
[image:5.612.186.426.500.739.2]Generated data (Table4) have been normalized first (grey relational generation). The normalized data for each of the parameters of process output viz. MRR, Ra have been furnished in Table 5.
Table 5. Normalized S/N data (Grey relational generation)
SlNo MRR Ra SlNo MRR Ra
1 0 0 19 0.95852 0.88489
2 0.44599 0.5261 20 0.76349 0.5637
3 0.73313 0.90182 21 0.88071 0.69316
4 0.30875 0.36601 22 0.69443 0.38584
5 0.64157 0.81541 23 0.91214 0.84877
6 0.4009 0.33716 24 0.97233 0.90182
7 0.37443 0.32536 25 0.98727 1
8 0.62681 0.84616 26 0.69281 0.33814
9 0.29196 0.34888 27 0.89274 0.73833
10 0.5961 0.66341 28 0.73475 0.51628
11 0.1955 0.13903 29 0.85323 0.65274
12 0.55693 0.72063 30 1 0.98403
13 0.40816 0.53913 31 0.99683 0.98643
15 0.23086 0.07027 33 0.9002 0.78048
16 0.17687 0.11107 34 0.87355 0.77867
17 0.4975 0.60821 35 0.94215 0.88233
[image:6.612.168.445.71.398.2]18 0.62832 0.79297 36 0.76194 0.51288
Table 6. Evaluation of Δ0i for each of the responses
SlNo MRR Ra SlNo MRR Ra
Ideal
sequence 1 1
Ideal
sequence 1 1
1 1 1 19 0.04148 0.11511
2 0.55401 0.4739 20 0.23651 0.4363
3 0.26687 0.09818 21 0.11929 0.30684
4 0.69125 0.63399 22 0.30557 0.61416
5 0.35843 0.18459 23 0.08786 0.15123
6 0.5991 0.66284 24 0.02767 0.09818
7 0.62557 0.67464 25 0.01273 0
8 0.37319 0.15384 26 0.30719 0.66186
9 0.70804 0.65112 27 0.10726 0.26167
10 0.4039 0.33659 28 0.26525 0.48372
11 0.8045 0.86097 29 0.14677 0.34726
12 0.44307 0.27937 30 0 0.01597
13 0.59184 0.46087 31 0.00317 0.01357
14 0.32673 0.13394 32 0.32459 0.63702
15 0.76914 0.92973 33 0.0998 0.21952
16 0.82313 0.88893 34 0.12645 0.22133
17 0.5025 0.39179 35 0.05785 0.11767
18 0.37168 0.20703 36 0.23806 0.48712
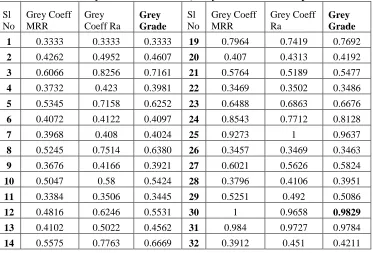
Grey relational coefficients for each performance characteristics have been calculated and furnished in Table 7. This calculation requires the estimation of quality loss Δ0i of each response from its best suited value which is obtained from Table 6. These grey relational coefficients for each response have been accumulated to evaluate overall grey relational grade. Equal weight age has been given to all the responses (Ψ = 0.5 ). The mean response Table for the overall grey relational grade is shown in Table 8.
[image:6.612.122.495.479.732.2].
Table 7. Grey relational coefficient, Grey Grade for each response
Sl No
Grey Coeff MRR
Grey Coeff Ra
Grey Grade
Sl No
Grey Coeff MRR
Grey Coeff Ra
Grey Grade
1 0.3333 0.3333 0.3333 19 0.7964 0.7419 0.7692
2 0.4262 0.4952 0.4607 20 0.407 0.4313 0.4192
3 0.6066 0.8256 0.7161 21 0.5764 0.5189 0.5477
4 0.3732 0.423 0.3981 22 0.3469 0.3502 0.3486
5 0.5345 0.7158 0.6252 23 0.6488 0.6863 0.6676
6 0.4072 0.4122 0.4097 24 0.8543 0.7712 0.8128
7 0.3968 0.408 0.4024 25 0.9273 1 0.9637
8 0.5245 0.7514 0.6380 26 0.3457 0.3469 0.3463
9 0.3676 0.4166 0.3921 27 0.6021 0.5626 0.5824
10 0.5047 0.58 0.5424 28 0.3796 0.4106 0.3951
11 0.3384 0.3506 0.3445 29 0.5251 0.492 0.5086
12 0.4816 0.6246 0.5531 30 1 0.9658 0.9829
13 0.4102 0.5022 0.4562 31 0.984 0.9727 0.9784
15 0.3486 0.3333 0.3410 33 0.6018 0.6436 0.6227
16 0.3333 0.3333 0.3333 34 0.5427 0.6416 0.5922
17 0.3333 0.4579 0.3956 35 0.7308 0.7919 0.7614
18 0.3333 0.6152 0.4743 36 0.5714 0.8205 0.6960
Within selected experimental domain the most significant factor becomes SF. Next to SF TON, IP, TOFF, WT, WF, SV, WP are the parameters in order to influence on responses.
IV. ANALYSIS OF VARIANCE (ANOVA)
[image:7.612.135.482.348.422.2]The results obtained from the experiments were analyzed using Analysis of Variance to find the significance of each input factor on the measures of process performances, Material Removal Rate, surface roughness. Using the grey grade value, ANOVA is formulated for identifying the significant factors. The results of ANOVA are presented in Table 8.
Table 8: The mean response Table for the overall grey relational grade
Level TON TOFF IP SV WF WT SF WP 1 0.4713 0.5427 0.4908 0.5576 0.5836 0.5603 0.3983 0.5411 2 0.6342 0.5212 0.5716 0.5306 0.5281 0.5809 0.5156 0.5389 3 0.5942 0.5958 0.5700 0.5465 0.5169 0.7442 0.5781 Delta 0.1629 0.0730 0.1050 0.0394 0.0555 0.0640 0.3459 0.0392 Rank 2 4 3 7 6 5 1 8
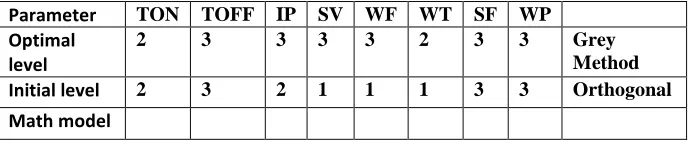
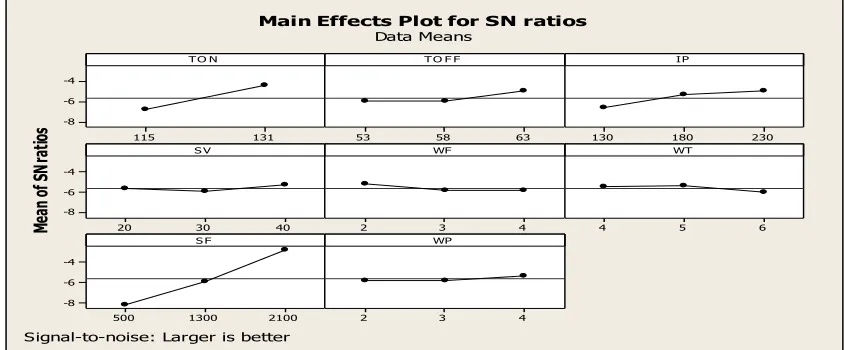
The optimal parameter setting has been evaluated from the Figure 3. The optimal setting comes:
Parameter TON TOFF IP SV WF WT SF WP
Optimal level
2 3 3 3 3 2 3 3 Grey
Method
Initial level 2 3 2 1 1 1 3 3 Orthogonal
Math model
V. CONFIRMATION EXPERIMENT
The confirmation test for the optimal parameter setting with its selected levels was conducted to evaluate the quality characteristics for WEDM of H13. Experiment 30 (Table7) shows the highest grey relational grade, indicating the optimal process parameter set of TON2, TOFF3, IP3, SV3, WF3, WT2, SF3, WP3 has the best multiple performance characteristics among the nine experiments [15], which can be compared with results of confirmation experiment for validation of results. Table 9shows the comparison of the experimental results using the initial
(TON2, TOFF3, IP2, SV1, WF1, WT1, SF3, WP3) and optimal (TON2, TOFF3, IP3, SV3, WF3, WT2, SF3, WP3)WEDM parameters onH13. The response values obtained from the confirmation experiment are MRR = 304.46 mm3/min, Ra = 2.11μm . The Material Removal Rate shows an increased value of 13.2 mm3/min, the Surface Roughness shows a reduced value of2.11μm to 2.01μm respectively. The corresponding improvement in Material Removal Rate, Surface Roughness 5.97%, 4.74% respectively.
Table 9. Results of the confirmation experiment for MRR and Ra
Initial Othor Result Experimental Prediction Prediction
Orthogonal Array Grey theory Design mathematical model
TON2, TOFF3, IP2, SV1, WF1, WT1, SF3, WP3
TON2, TOFF3, IP3, SV3, WF3, WT2, SF3, WP3
MRR 304.46 MRR 322.66 MRR 313.76
[image:7.612.75.536.614.701.2]131 115 -4 -6 -8 63 58
53 130 180 230 40 30 20 -4 -6 -8 4 3
2 4 5 6 2100 1300 500 -4 -6 -8 4 3 2 T O N
Me an of SN ra tio s
T O F F IP S V WF WT S F WP
Main Effects Plot for SN ratios
Data Means
[image:8.612.94.516.60.235.2]Signal-to-noise: Larger is better
Figure 3. Evaluation of optimal parameter setting
VI. DEVELOPMENT OF MATHEMATICAL MODELS
The experimental results are used to obtain the mathematical relationship between process parameters and machining outputs. The coefficients of mathematical models are computed using method of multiple regressions. In this study, SPSS, Minitab15 (Software Package for Statistical Solutions), for regression analysis custom made software created by the author was used for the regression analysis. This software is used to test several models, viz., linear, exponential, power series (user-defined). Out of all models tested, the model that has high coefficient of multiple determination (r2) value is chosen. The adequacy of the models and the significance of coefficients are tested by applying analysis of variance. The relationship between response variable(s) and process parameters can be expressed as:
Y= c x TONa x TOFFb x IPc x SVd x WFe x WTf x SFg x WPh
where Y is the output response(s) c, a, b, c, d, e, f, g, h - regression variables. TON, TOFF… – Process parameters the material removal rate MRR is expressed as:
MRR = 1.18E-12x TON 5.159x TOFF0.8001x IP0.2703 x SV 0.1226x WF1.69E-02 x WT0.1212x SF0.3638 x WP-1.54E-02 (r2 = 0.998)
The surface roughness Ra is expressed as: Ra = 4.25E-04 x ON 0.9163 x TOFF0.2935 x IP0.1964x SV 3.04E-02 x WF-4.64E-02 x WT5.61E-02 x SF 0.2234 x WP-0.03624(r2 = 0.996)
The high correlation coefficients (r2) indicate the suitability of the function (model) and the correctness of the calculated constants. Equations were used successfully to estimate the machining outputs without experimentation.
VII. CONCLUSION
In this study an attempt has been made to establish mathematical models to highlight parametric influence on two selected process responses: material removal rate, surface roughness. Application of grey based Taguchi technique has been utilized to evaluate optimal parameter combination to achieve maximum MRR, minimum roughness value; with selected experimental domain. This method is very reliable for solving multi-objective optimization problem; for continuous quality development of the process/product. In the research study it has been assumed that all
response features are uncorrelated i.e. they are independent to each other. The response correlation if it exists may be considered in future research.From the study it is evident that this method greatly simplifies the optimization of complicated multiple performance characteristics and since it does not involve any complicated mathematical computations, this can be easily utilized by the Manufacturing world.
REFERENCES
[1] D.Scott, , S. Boyna, and K.P. Rajurkar,. Analysis and optimization of parameter combinations in WEDM. Int. J. Prod. Res, 29,2189–2207 (1991).
[2] Y.S.Tarng,, S.C.Ma and L.K.Chung , Determination of optimal cutting parameters in wire electrical discharge machining, Int. J. Machine Tools Manuf, 35, 1693– 1701(1995).
[3] Y.S.Liao, , J.T.Huang, and H.C.Su , A study on the machining-parameters optimization of wire electrical discharge machining, J. Mater. Process. Technol, 71, 487–493(1997).
[4] T.A. Spedding, and Z.O. Wang , Parametric optimization and surface characterization of wire electrical discharge machining process. Precision Eng, 20, 5–15 (1997).
[5] C.Y. Ho, and Z.C Lin, , Analysis and application of grey relation and ANOVA in chemical mechanical polishing process parameters, Int. J. Adv Manuf. Technol.,21, 10–14, (2003)
[6] M.Shajan, , M.Kamal, and M.S.Shunmugam, Data Mining applied to Wire-EDM process, J. Mater. Process. Technol, 142 ,182– 189(2003).
[7] Tosun, N.,. Determination of optimum parameters for multiperformance characteristics in drilling by using grey relational analysis. Int,.J. Adv. Manuf. Technol., 28, 450–455. 2006
[8] Chang, C.K. and Lu, H.S.,. Design optimization of cutting parameters for side milling operations with multiple performance characteristics, Int. J. Adv. Manuf. Technol., 32, 18–26. (2007)
[9] L.K Pan,., C.C.Wang,., S.L.Wei,. and H.F Sher , Optimizing multiple quality characteristics via Taguchi method-based grey analysis., J. Mater. Process. Technol., 182, 107–116, (2007)
[10] J Kopac, and P.Krajnik, ,Robust design of flank milling parameters based on grey-Taguchi method, J. Mater. Process. Technol., 191, 400–403, (2007)
[11] A.Noorul Haq, , P.Marimuthu, and R.Jeyapaul , Multi response optimization of machining parameters of drilling Al/SiC metal matrix composite using grey relational analysis in the Taguchi method, Int. J. Adv. Manuf. Technol., 37, 250–255(2008).
[12] J.L. Deng, Introduction to grey system, J. Grey. Sys., 1, 1–24.(1989).
[13] S.S. Mahapatra, and A.Patnaik, , Optimization of wire electrical discharge machining (WEDM) process parameters using Taguchi method, International Journal of Advanced Manufacturing Technol., 34 , 911–925 (2007).