Objective quality measurement of audio using multiband dynamic range analysis
Original Citation
Fenton, Steven, Fazenda, Bruno and Wakefield, Jonathan P. (2009) Objective quality measurement
of audio using multiband dynamic range analysis. In: Institute of Acoustics (IOA) Conference 2009
Reproduced Sound, November 2009, Brighton.
This version is available at http://eprints.hud.ac.uk/id/eprint/8672/
The University Repository is a digital collection of the research output of the
University, available on Open Access. Copyright and Moral Rights for the items
on this site are retained by the individual author and/or other copyright owners.
Users may access full items free of charge; copies of full text items generally
can be reproduced, displayed or performed and given to third parties in any
format or medium for personal research or study, educational or notforprofit
purposes without prior permission or charge, provided:
•
The authors, title and full bibliographic details is credited in any copy;
•
A hyperlink and/or URL is included for the original metadata page; and
•
The content is not changed in any way.
For more information, including our policy and submission procedure, please
contact the Repository Team at: [email protected].
Vol.31. Pt.4. 2009
OBJECTIVE QUALITY MEASUREMENT OF AUDIO USING
MULTIBAND DYNAMIC RANGE ANALYSIS
SM Fenton The University Of Huddersfield, Huddersfield, UK BM Fazenda The University Of Huddersfield, Huddersfield, UK JP Wakefield The University Of Huddersfield, Huddersfield, UK
ABSTRACT
Ever since the very first recordings were made, people have strived to improve the recording and playback process to a point of ‘complete transparency’. However, in music production, it’s certainly the case that sound-engineers and producers employ techniques to deliberately ‘colour’ or ‘enhance’ the completed piece to achieve ‘release quality’ material. The measure of ‘release quality’ is open to both subjective discussion and measurement, but its objective measurement remains somewhat of a ‘holy grail’ within the music industry. Attempts to maximize the loudness of a piece of music and the proliferation of a new default listening standard, mp3, are examples where a reliable metric that quantifies sound quality, or loss of it, is required. This paper describes an approach where the objective measurement of quality of audio based upon a novel multiband analysis technique is investigated. We demonstrate the relationship between the subjective quality assessment of the ‘produced’ audio and it’s correlation with measured dynamic range descriptors.
1
INTRODUCTION
This paper is concerned with investigating the influences of dynamic range on the perception of audio quality of produced music. The experiment described here forms part of a pilot study conducted to obtain an objective measure that can be used, in conjunction with other extracted objective features, to describe the basic audio quality (BAQ) of recordings under test.
Audio can have many purposes. In the context of this paper, it is musical performance captured by a recording process (or a programmed sequence) and stored on a medium for later listening and enjoyment. Ever since the very first recordings were made1, we have strived to improve the quality of the recording and playback process.
Over the decades, recording technology has improved (in particular in the digital domain) to such an extent that the signal path from capture to recording could be argued to be virtually transparent in terms of colouration of the original signal source. Of course, there are slight differences due to microphone responses, the performance of the pre-amplifier and the signal conversion (A/D), if applicable.
These differences are either compensated for or exploited by the audio engineer in the production stages. It is the skill of the engineer in the production stages that often leads to a completed recording being deemed as ‘clear’, ‘defined’, ‘punchy’ or ‘highly polished’, a poorly executed recording can be engineered and produced to sound ‘good’. A badly engineered and produced recording could be referred to as ‘woolly’, ‘distorted’, ‘poorly balanced’ or ‘muddy’.
Vol.31. Pt.4. 2009
Since the mid-1980’s, a trend has developed in music production that has resulted in the loudness of completed productions being increased during the mastering process. This increase in loudness has seen the gradual reduction in dynamic range of produced music.
Thanks to this on going loudness war, and the resulting reduction in overall dynamic range, has our perception of both the subjective and objective quality of the audio become somewhat distorted with regards to an acceptance of a louder product vs. a reduced dynamic range?
1.1
Subjective & Objective Measures
Formal listening tests are regarded as being the most reliable method for audio quality assessment and a number of methodologies have been established2. The proliferation of such tests have in the most part been in response to a need to evaluate the quality of low bit rate codecs3,4 due to the wide use of voice over internet, streaming technologies and the dominance of the MP3 format for music distribution.
Three major recommendations with regards to the subjective assessment of audio quality have been established. These are standardized as ITU-R BS.11165, developed primarily to evaluate small impairments in audio quality, ITU-R BS.1534-16, commonly referred to as MUSHRA, developed to evaluate intermediate impairments in audio quality and ITU-T P.8007, primarily used to evaluate narrowband speech quality.
Generally, these testing and measurement techniques are employed to establish audio quality in audio systems (such as codecs) under test with respect to an original ‘untreated’ reference signal. The resulting index is named the subjective difference grade (SDG) which attempts to categorize the subjective audio quality. These types of test can be very time consuming and subject to errors through various forms of biasing8 some of which will be described later.
In order to address the need for automatic quality measurement of audio, a number of objective measures have been proposed. These attempt to predict the BAQ from extracted features of the audio under test. Many of the techniques have been standardized as ITU-R BS.1387-19, otherwise known as PEAQ (Perceptual Evaluation of Audio Quality).
PEAQ combines many different model variables (MOVs) in order to compute the objective difference grade (ODG). The basic version of PEAQ combines 12 of the MOV’s to calculate the ODG whilst the advanced version combines a further 5.
All of the tests, subjective and objective, are full-reference quality indexed, i.e. they compare the audio under test with respect to an original reference signal (uncompressed/unprocessed). Whilst we can attempt to measure and quantify the BAQ of a piece of audio that has been processed using a codec, it remains difficult to measure the quality of a ‘produced’ piece of music that has no reference.
1.2
Loudness
A fundamental factor that contributes to our perception of sound quality is its loudness. Many factors and studies relating to loudness are documented including its measurement; one such standard for measurement is detailed in ITU-R BS.177010. This loudness model has been extended with further descriptors to allow the effective measurement over time11.
Vol.31. Pt.4. 2009
Our perception of the overall loudness between differing genres of music and speech excerpts has also been shown to vary12. The push for ever louder recordings has led to the ‘loudness wars’13 and also, in contrast, to movements such as ‘Turn Me Up’ to promote the opposite14.
1.3
Dynamic Range
The term dynamic range is often quoted in decibels (dB) when describing the performance of an audio system. The context of measurement is an important factor to consider when the interpretation of the dB value is evaluated. The context can either be categorized as that of a system or signal.
In the context of a system the measurement is used to describe the maximum range that is permissible, before distortion takes place (clipping), measured from the noise floor to the peak level. The AES specify this measurement as "20 times the logarithm of the ratio of the full-scale signal to the R.M.S noise floor in the presence of signal, expressed in dB FS"17. This value gives an indication of the true headroom of a system and shouldn’t be confused with SNR (Signal to Noise Ratio) which is often measured without the presence of a signal and can therefore give an inaccurate system measurement due to muting circuits.
When we describe the signal itself rather than the system under test, the dynamic range can be given as the ratio of the full-scale level of the signal to its lowest level. Given that audio signals under test are generally varying in level, particularly during fade ins-outs, interludes etc, an average level (R.M.S) is generally taken of a section of audio under test representative of the ‘active’ passage of music. This average level is then used to compute the dynamic range in conjunction with the peak level measured during the same passage. This is the method adopted in this paper.
One of the aims of this paper is to identify trends and relationships between the perception of audio quality and the measurements of the dynamic range across key frequency bands.
2
DESCRIPTION OF THE LISTENING TEST
2.1
Elicitation Process
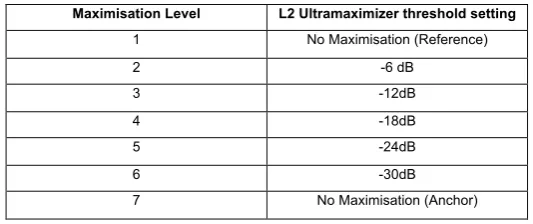
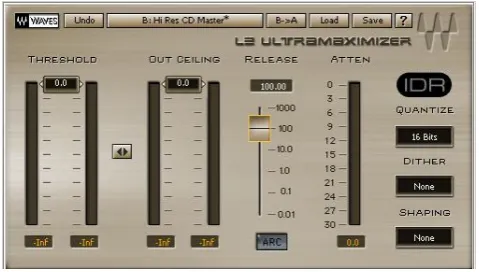
A listening test was designed to measure the subjective preference of listeners to changes in dynamic range caused by the maximisation of the audio signal. The objective is to extract the degree of signal degradation that a signal maximisation process could cause. The experiment involved playing a selection of audio excerpts to the subjects and allowing them to compare them against a reference signal. Each subject was asked to compare each excerpt to the reference and grade its quality on a seven point sliding scale. The reference signal was unprocessed whilst the audio excerpts had been processed using the Waves L2 Ultramaximizer (Figure 1) to reduce their respective dynamic ranges. The level of maximisation of each excerpt can be seen in Table 1.
Maximisation Level L2 Ultramaximizer threshold setting
1 No Maximisation (Reference)
2 -6 dB
3 -12dB
4 -18dB
5 -24dB
6 -30dB
[image:4.595.164.431.622.734.2]7 No Maximisation (Anchor)
Vol.31. Pt.4. 2009
Figure 1. The L2-Ultramaximizer Interface
Before any processing of the excerpts took place the peak level of each was measured and this formed the ‘Out Ceiling’ setting of the maximizer thus preventing the peak level of the signals being affected by the make up gain of the processing. Make up gain is added internally within the L2-ultramaximizer which is inversely proportional to the level of threshold that is set by the user.
One effect that occurs when the dynamic range of a musical piece is reduced is that it’s overall perceptual loudness is increased. This is due to the R.M.S level of each frequency component becoming normalised towards the overall peak level of the signal as the make up gain is increased.
There have been numerous studies to investigate the bearing of loudness upon our perception of audio quality. In order to avoid biasing effects caused by differences in loudness level each excerpt had its loudness normalised to that of the reference sample. Measurements were taken using a BS1170 loudness meter and the overall gain of the maximised excerpts was reduced until they equalled that of the reference signal. This process enabled the subjects to give scores based on the perception of quality associated with the reduction of dynamic range alone and not the loudness increase. Arguably, this supports the notion that the increase in quality afforded by a loudness increase can be obtained simply by turning the volume control up and hence the need for maximisation is reduced.
The subjects were given a training phase prior to the experiments taking place, this was to allow subjects to familiarise with the test and the audio excerpts they were expected to listen to. This training process helps to reduce the contraction biasing that may occur during the testing process8.
The overall scores obtained from the tests were normalised and combined with other subject scores resulting in a Mean Subject Score (MSS) for each excerpt.
The tests were performed using Matlab based around an existing script developed for performing MUSHRA based tests15. The MUSHRA script was modified to accommodate key factors prevalent to this study, details can be found in section 2.2
2.2
Choice of Method
As detailed previously, there are a variety of potential methods available to investigate the BAQ of a segment of audio. The subjective tests, despite being primarily developed for the evaluation of low bit rate CODECs remain suitable for the purposes of this experiment, giving a standardised and recognised approach to both the collection and analysis of data.
Vol.31. Pt.4. 2009
on these scales have an internal numerical representation in the range 0-100, where 0 corresponds with the bottom of the scale (Bad) and 100 corresponds with the top of the scale (Excellent).
The MUSHRA specification6 states that at least one of the excerpts under test should be a hidden reference, therefore its score should correspond to 100 when under test. This method, in conjunction with other hidden anchors is an attempt to gain consistent grading between subjects.
Whilst this scaling and numerical representation allows for the audio excerpts under test to be compared to the reference, it does not allow the subject to give a score representative of subjective quality deemed greater than that of the reference.
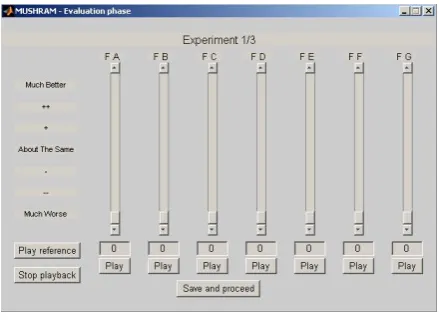
To accommodate this, the MUSHRA test was modified to incorporate a seven interval scale to allow subjective scores to exceed that of the unprocessed reference (figure 2). In addition the internal numerical representation range was increased to accommodate the larger seven point scale, 0-140.
The seven point scale is specified as the Comparison Category Rating (CCR)7,16 and has the advantage that it allows processing to be rated that either degrades or improves the quality. A score of 0 given by the subject would correspond to the bottom of the scale (Much Worse) and a score of 140 would correspond to the top of the scale (Much Better).
The length of the testing was a consideration. The test methodology chosen enables a large number (up to 15) test sounds to be evaluated alongside a single reference signal, thus keeping the test length to a minimum and ensuring fatigue of the listeners is not a biasing factor. Further to this, most listeners utilise short term memory whilst assessing music in qualitative tests, therefore the use of longer exceprts lengths in assessment of audio quality is not required..
[image:6.595.188.408.468.631.2]In this case, 3 references were chosen. Each one was processed giving 5 excerpts with progressively reduced levels of dynamic range. In addition a hidden anchor was also incorporated into the test corresponding to the 3.5Khz low pass signal specified in the MUSHRA standard 6. This results in a total of 7 samples to compare against each reference.
Figure 2
The audio excerpts were played back in random order during each experiment, thus every experiment can be classed as double blind with multiple stimulus, hidden reference and anchor.
2.3
Biasing
Vol.31. Pt.4. 2009
to reduce the contraction biasing that may occur during the testing process8. In addition, the loudness of each excerpt was normalised, as detailed in section 2.1, to prevent this from being a factor contributing to the scores given by each subject.
2.4
Stimuli
3 different audio excerpts were chosen with much consideration, these were:
• Excerpt 1 - Acoustic Guitar
• Excerpt 2 - Pop Music - Eddie Rabbitt • Excerpt 3 - Dreadlock Holiday – 10cc.
The excerpts were 16bit, 44.1Khz, stereo WAV format.
The reason for choice was to allow for a varied test set, thus testing the perception of the dynamic range across a number of different stimuli, including transient and harmonically rich material.
The Eddie Rabbitt excerpt was obtained from the EBU SQAM test CD18. It can be considered as such, a standard excerpt used for subjective testing. In the context of this test the excerpt is well suited as it contains a main vocal line, is well balanced and has not been subjected to a maximisation process.
The acoustic guitar recording was recorded using an Audio Technica AT4033 large diaphragm condenser microphone and a Rode NT2 (Mk1) large diaphragm condenser microphone. No mastering (final bus compression) of the recordings took place. Pre-amps utilised for the recordings were Calrec (M-Series) PQ1789s.
Dreadlock Holiday by 10cc was chosen as it represents a produced piece of music that hasn’t been subjected to over compression. The song, released in July 1978, could be considered to be an album that avoided the forthcoming ‘loudness wars’ that commenced around the mid-late 1980’s and is perhaps one that would be familiar to most experienced listeners.
The tests took place in a critical listening room in the University of Huddersfield utilising a PC with a Realtek HD sound card. All the excerpts were auditioned on Sennheiser HD650 headphones and therefore biasing effects caused by both room acoustics and background noise were eliminated.
The subjects auditioned the excerpts at a level of 72dB(A).
2.5
Test Subjects
A total of 10 test subjects participated in the experiment. All were experienced listeners. These were selected from staff members, engineers & music producers, doctoral and final year students.
The listeners were pre-screened to ensure that they were suitable to take part in such a test. The pre-screening involved the subjects taking part in both a hearing test and listening experiment to determine that they were a) sound of hearing and b) could detect impairments in audio excerpts that had been subjected to processing.
Each subject, following the training phase, was given an explanation of the experiment and was told to listen to the excerpts and grade each with respect to the reference in terms of ‘overall quality’.
Vol.31. Pt.4. 2009
3
RESULTS AND DISCUSSION
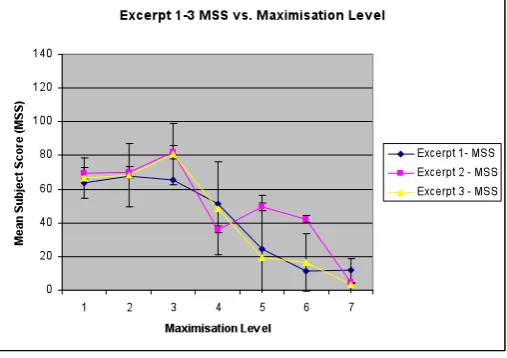
In total 21 audio excerpts were listened to and graded by each subject. Scores for each experiment were collected and collated by order of maximisation level and excerpt type. The MSS (Mean Subject Score) and standard deviation were then calculated and the results plotted (Figure 3).
Figure 3
The reader is reminded that level 1 corresponds to the reference and that maximisation is applied in steps leading to 6dB dynamic range reduction. The results suggest that quality degrades as increasing levels of maximisation are applied. Not surprisingly, the 3.5KHz low pass filtered anchor is rated as ‘worst’ quality by the panel. Perhaps more interestingly, there appears to be a perceived increase of quality up to maximisation level ‘3’ for 2 of the three excerpts auditioned. In other words, the reference does not appear to be associated with maximum quality according to our test panel.
A 2-way analysis of variance test (ANOVA) was performed on the data in order to determine the significance of each test factor – i.e. excerpt and dynamic range reduction (Figure 4) . The ANOVA results show that the effect of the reduction in dynamic range is highly significant (p<0). This is a strong indication that our subjects consistently perceive a change in quality as the dynamic range of the samples is varied. In addition the effect of the audio excerpt could be considered as being significant (p<0.05), suggesting that the particular excerpts used have some influence on how subjects rated the quality of perceived audio across the different maximisation levels. However, this marginal result, with such a low F-ratio from the ANOVA combined with a significant level of interaction between excerpt and dynamic range (p=0.0026) make a generalisation of results somewhat difficult.
[image:8.595.171.425.201.380.2]A closer inspection of results in Figure 3 shows that in general the quality is perceived to increase or remain constant (depending on excerpt) until maximisation level 3 and then decrease rapidly as maximisation is increased. Indeed, there seems to exist a marked difference between excerpt 1 and excerpts 1 and 2. The fact that excerpt 1 is of a single instrument recorded with no mastering process may explain the observed difference – also see figure 6.
Vol.31. Pt.4. 2009
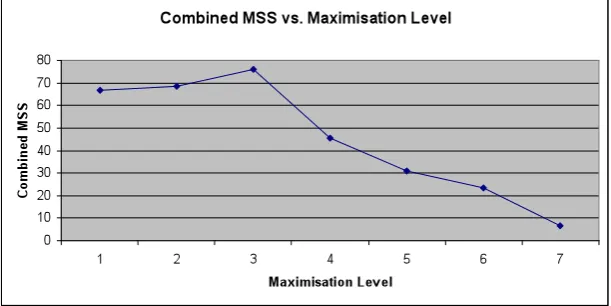
[image:9.595.146.452.151.304.2]If the differences between audio excerpt factor are disregarded, it is possible to determine an overall MSS for each maximisation level. (Figure 5).
Figure 5.
A MSS of 70 represents a rating whereby the subject has rated the excerpt as being ‘About the same’ quality to the reference. In fact, the resolution of the sliders was 0.05 with 20 steps representing each band. As one can see, the general trend is an almost linear reduction on MSS as the maximisation level is increased beyond level 3.
The combined MSS is shown to drop off quite rapidly once the maximisation level is increased beyond the 12dB point (level 3). Despite the differences in source material and, as we will see later, differences in peak level between the excerpts, this maximisation level does appear to be the point at which the MSS begins to reduce.
Interestingly, one can observe a slight increase in the MSS as the maximisation level is increased from 1 to 3 (corresponding to 12dB level maximisation). This appears to contradict the notion that listeners might prefer a wider dynamic range in music production. Indeed, it seems that our listeners have a preferred level of dynamic range that seems to improve audio quality of the samples tested. Movements such as ‘Turn Me Up’ and ‘Pleasurize Music Foundation’19 advocate the maximum use of dynamics within music production. The maximum MSS value of 75.29 equates to a mean 7.56% increase in perceived audio quality from the reference, based on the listeners subjective perception of quality.
3.1
Dynamic Range Analysis
One could argue that the peak levels of each of the excerpts would dictate the overall reduction of dynamic range achieved during maximisation, and indeed they do. All three excerpts used contained differing peak signal levels, however, given the results shown in figure 3 and the results of the ANOVA test, one can observe that there is some correlation between the maximisation level MSS given by the subjects, irrespective of excerpt in this case.
3.2
WDR (Wideband Dynamic Range)
Vol.31. Pt.4. 2009
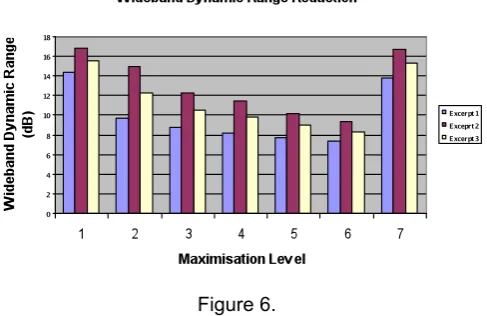
[image:10.595.179.423.126.284.2]Figure 6.
Comparing except 1 to the other excerpts, one can see that there is a much sharper decline in WDR between maximisation level 1 and 2, reductions of excerpt 1, 2 and 3 being 5.32dB, 1.85dB and 3.26dB respectively. This could be explained by the high level transients present in excerpt 1 due to the artist adopting a percussive playing style to accentuate the beat of the piece. These transients, which form the majority of the peak level signal, are the first to exceed the threshold of the maximizer therefore, the effect of gain reduction is greatest in the initial maximisation ranges..
Therefore the reduction in dynamic range is due to the peak differences and therefore differing magnitudes of peak reduction taking place between excerpts. Figure 6 indicates a more uniform reduction in WDR as the maximisation level is increased for excerpts 2 & 3. This could, in part, be due to the well balanced nature of the pieces in the frequency domain.
The loudness normalisation process requires the excerpt to have their overall levels reduced until the loudness of the processed excerpt matches that of the reference. As such, the R.M.S level plots shown have a trend of reduction rather than increase. As the WDR is measured in respect of the peak and R.M.S values, which are affected by the same gain normalisation, this does not affect the measured dynamic range.
As with combining the MSS given per maximisation level, we can also combine the WDR of each excerpt to give an indication of the dynamic range reduction that is taking place (Figure 7).
Figure 7.
[image:10.595.173.424.529.700.2]Vol.31. Pt.4. 2009
value is undesirable. Interestingly, this maximisation level is also shown to be preferred over levels 1 & 2, having mean WDR values of 15.59dB and 12.33dB respectively.
3.3
MDR (Multiband Dynamic Range)
One could argue that due to the human hearing response differing at each critical band, a single wideband dynamic range figure, as described above, would be inaccurate in describing the basic audio quality of a signal, although it could be used to represent an overall mean ‘figure of merit’ score.
[image:11.595.164.437.297.365.2]A possible solution would be to analyse the dynamic range at each critical band of hearing and measure the interaction of each against the combined MSS. As a basic study of band interaction during the maximisation process each excerpt was filtered using a 3 band linear phase FIR filter. Three filters were used and their respective cut-off frequencies and Q settings are shown as follows (Table 2).
Filter Type Fc(Lower) Fc(Upper) Q
Low Pass LF 947 - 6.5
Band Pass MF 947 3186 6.5
[image:11.595.80.540.451.601.2]High Pass HF - 3186 6.5
Table 2.
These frequencies were chosen as they approximate the 1st, 2nd and 3rd set of 8 critical bands in the auditory system.
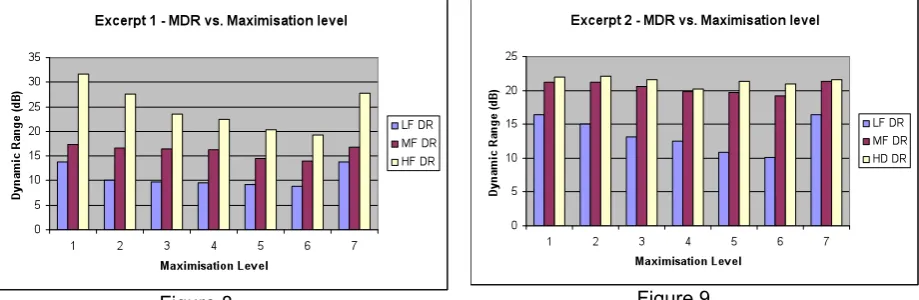
Following this filtering process, R.M.S and dynamic range analysis was performed. Figures 8, 9 & 10 show the dynamic ranges within each frequency band.
Vol.31. Pt.4. 2009
Figure 10
If one considers that the general trend of frequency balance within produced music follows that of the response of the ear i.e. the mid to high frequencies will be balanced at a lower level than that of the low frequencies. One could assume that there would be a loss of low frequency content as the maximisation process takes place. This is clearly evident in excerpts 2 & 3.
Excerpt 1 shows a slightly different trend, in that the HF dynamic range is shown to reduce at greater rate than the LF dynamic range content as the maximisation level is increased. This is probably due to the high level peak content of the signal in excerpt 1 containing greater HF components.
Low frequency content of produced pieces of music contribute greatly to the spectral energy of the piece, therefore a loss in this energy could result in a perceptual loss of audio quality by the subject.
As can be observed from except 2 & 3, the MF to HF DR Measurements remain relatively constant in ratio throughout the maximisation process. This however is in contrast to a gradual decline in LF DR. Excerpts 2 & 3 could be considered to be ‘more balanced’ with excerpt 1 containing the ‘percussive’ accent introduced by the player, thus the HF MDR level is initially very high (no peak reduction) and graduates towards the average 20dB level as shown in excerpt 2 & 3 as the maximisation level is increased.
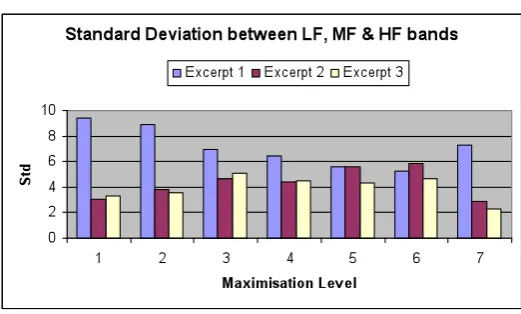
The interband ratio of dynamic ranges, or correlation between each band could suggest further trends relating to the perception of quality. By plotting the standard deviation between each frequency band (figure 11), one can see that, in the case of excerpt 2 & 3, there is a trend of deviation increase up until the point of level maximisation 3. If one examines figure 3, this
corresponds to a gradual increase in MSS up to this point. Interestingly, the trend of deviation that corresponds to excerpt 2, beyond level 3, follows the trend of MSS obtained for it. A slight fall in deviation is shown followed by a rise at level 5 & 6.
Excerpt 3 shows a definite peak deviation being achieved at maximisation level 3, again, corresponding with the maximum MSS given per subject.
Vol.31. Pt.4. 2009
Figure 11.
4
CONCLUSION
This paper represents a pilot study into the effects of dynamic range reduction on the perception and measurement of audio quality. It does begin to quantify and present some objective measures that can be made to assess audio quality with respect to dynamic range.
Low frequency content of produced pieces of music contribute greatly to the spectral energy of the piece, therefore a loss in this energy could result in a perceptual loss of audio quality by the subject.
As observed in this study, all three excerpts exhibited this LF loss in headroom as the maximisation process took place.
Correlation between frequency band dynamic range may have a bearing on the perception of audio quality.
Due to the wide variation in spectral content between pieces of produced music, in addition to fade outs and fade ins a single WDR figure is not accurate enough to describe music quality in detail, however, it could be utilised as a general ‘figure of merit’ score.
5
FURTHER DEVELOPMENTS
Detailed analysis is required to study the relationship between critical bands with respect to their dynamic range, both in their short term and long term measurement, and how this relates to our perception of audio quality in terms of MSS.
Analysis of the data is required to establish whether the ratio of dynamic range between the three audio bands has a relationship to the MSS given by the subjects.
A more accurate model of the basilar membrane will be utilised to separate out and measure the dynamic range across all 24 critical bands.
Vol.31. Pt.4. 2009
6
REFERENCES
1. P Feaster, . Edouard-Leon Scott de Martinville’s – Principes De Phonoautographie (1857), Firstsounds.org, U.S.A., 2008
2. S.Bech and N.Zacharov, Perceptual audio evaluation, theory, method and application, J.Wiley, Chichester, 2006
3. G. Stoll, F.Kozamernik, EBU listening tests on internet audio codecs, EBU Technical Review, 2000
4. D.Marston and A.Mason, Cascaded audio coding, EBU Technical Review 304, Geneva, Switzerland, 1994
5. ITU-R BS.1116-1, Methods for the subjective assessment of audio systems including multichannel sound systems, International Telecommunications Union, Geneva, Switzerland, 1994
6. ITU-R BS.1534-1, Method for the subjective assessment of intermediate quality level of coding systems, International Telecommunications Union, Geneva, Switzerland, 2003 7. ITU-T. P800, Methods for subjective determination of transmission quality, International
Telecommunications Union, Geneva, Switzerland, 1990
8. S.Zielinski and F.Rumsey, On some biases encountered in modern audio quality listening tests-A Review, Journal AES Vol 56, No 6, June 2008.
9. ITU-R BS.1387-1, Method for objective measurement of perceived audio quality’, International Telecommunications Union, Geneva, Switzerland, 1998
10. ITU-R BS.1770, Algorithms to measure audio programme loudness and true-peak audio level, International Telecommunications Union, Geneva, Switzerland, 2006
11. E.Skovenborg and T.Lund, Loudness descriptors to charactirize programs and music tracks, AES Convention paper 7514, October 2008
12. E.Skovenborg, R.Quesnel and S.H.Nielsen, Loudness assessment of music and speech, AES Convention paper, May 2008.
13. Loudness Wars, http://en.wikipedia.org/wiki/Loudness_war [Accessed 24th September, 2009]
14. Turn Me Up, http://www.turnmeup.org/ [Accessed 12th September, 2009]
15. E.Vincent, MUSHRAM 1.0, Centre for Digital Music, Queens Mary, University of London, November 2005.
16. ITU-R BS.1284-1, General methods for the subjective assessment of sound quality International Telecommunications Union, Geneva, Switzerland, 2003
17. AES-6id-2006, AES information document for digital audio – Personal computer audio quality measurements, Audio Engineering Society, Inc, 2006.
18. SQAM Test CD, Sound Quality Assessment Material, Recordings for subjective tests – Cat. No. 422 204-2, EBU 1988,2005.