http://dx.doi.org/10.4236/fns.2016.79078
How to cite this paper: Papanikolaou, Y. and Fulgoni III, V.L. (2016) Certain Grain Food Patterns Are Associated with Im-proved 2015 Dietary Guidelines Shortfall Nutrient Intakes, Diet Quality, and Lower Body Weight in US Adults: Results from the National Health and Nutrition Examination Survey, 2005-2010. Food and Nutrition Sciences, 7, 772-781.
http://dx.doi.org/10.4236/fns.2016.79078
Certain Grain Food Patterns Are Associated
with Improved 2015 Dietary Guidelines
Shortfall Nutrient Intakes, Diet Quality, and
Lower Body Weight in US Adults: Results
from the National Health and Nutrition
Examination Survey, 2005-2010
Yanni Papanikolaou
1*, Victor L. Fulgoni III
21Nutritional Strategies Inc., Paris, ON, Canada 2Nutrition Impact, LLC, Battle Creek, MI, USA
Received 11 May 2016; accepted 22 July 2016; published 25 July 2016
Copyright © 2016 by authors and Scientific Research Publishing Inc.
This work is licensed under the Creative Commons Attribution International License (CC BY). http://creativecommons.org/licenses/by/4.0/
Abstract
Conclusions: Certain grain food patterns are associated with greater 2015-2020 Dietary Guide-lines’ shortfall nutrients, better diet quality and lower body weights in adults. Additionally, certain grain food patterns are associated with lower intake of nutrients to limit, including saturated fat and added sugars.
Keywords
NHANES, Grain Food Patterns, Nutrient Intakes, Diet Quality, Body Weight
1. Introduction
The 2015-2020 Dietary Guidelines for Americans (2015-2020 Dietary Guidelines) policy report identified that a healthy dietary pattern is higher in fruits, vegetables, whole grains, low- and non-fat dairy, seafood, legumes, and nuts; moderate in alcohol for adults; and lower in red and processed meat, sugar-sweetened foods and beve-rages and refined grains [1]. Furthermore, in comparison to recommended United States Department of Agri-culture (USDA) food patterns, the majority of US adults and children have low intakes of select food groups that are key contributors to shortfall nutrients, including vegetables, fruits, whole grains, and dairy products, while intake of refined grains and added sugars remains higher than recommended [1]. However, a variety of grain- based food products, of which include refined grains, are sources for several shortfall nutrients identified by the 2015-2020 Dietary Guidelines [1], including dietary fiber, folate, iron, and magnesium. With mandatory folic acid fortification commencing in 1998 by the Food and Drug Administration [2], specific grain foods became leading sources for folate; breads, rolls, and crackers are the largest contributor of total folate to the US diet, contributing nearly 16% of total intake, which exceeds contribution of folate from vegetables [3]. Similarly, us-ing data from the National Health and Nutrition Examination Survey (NHANES) 2003-2006, researchers have reported that fortification substantially contributes nutrient adequacy for children and adolescents in the US, without excessive intakes for most vitamins and minerals [4].
While certain grain food products are rich in nutrients to limit in the diet, including added sugar, total and sa-turated fat [5] [6], grain foods can contribute positive nutrients to the diet, of which include dietary fiber, iron, magnesium, and B vitamins (thiamin, riboflavin, niacin and folate). A 2003-2006 NHANES analysis examining food sources of energy and nutrients in adults showed that while four of the top ten ranking foods for calorie contribution to the total diet were grain foods, the top ten ranking food sources of dietary fiber included five grain-based products—yeast breads and rolls ranked as the top source of dietary fiber to the diet of US adults, contributing 10.9% of total dietary fiber [7]. Similarly, researchers have demonstrated that half of the top ten greatest contributors of calories also contribute 10% or more of the total dietary fiber and micronutrients to the US diet. Indeed, while three of the top 10 sources of energy provided no nutritional value, the remaining sources of energy, including milk, beef, poultry, cheese and baked goods were significant contributors of nutrients of concern and other essential nutrients, and thus, eliminating these foods from food patterns could potentially have inadvertent effects on diet quality in the US population [6].
While 2015-2020 Dietary Guidelines identify several healthy dietary food patterns, and encourage increased whole grain consumption and reduced refined grain intake, at present, there are no data that evaluate the associ-ation of different grain food patterns on nutrient and health-related outcomes in adults. As such, the objective of the current analyses was to isolate the most commonly consumed grain food patterns in US adults and compare nutrient intakes, diet quality, and health parameters of those consuming various grain food patterns to those not consuming main grain foods using data from several National Health and Nutrition Examination Survey (NHANES) 2005-2010 datasets. The hypothesis for the present analysis was that certain grain food patterns can significantly contribute positive nutrients, while concurrently lowering nutrients to limit in the diet. Additionally, we hypothesized that certain grain food patterns would be associated with improved measures on health para-meters including body weight and overweight or obesity-related outcomes.
2. Subjects and Methods
government-directed program led by the Center for Disease Control and Prevention in collaboration with USDA. Written informed consent was obtained for all participants or proxies, and the survey protocol was approved by the Research Ethics Review Board at the National Center for Health Statistics. Data from the current NHANES analysis are released every two years; for this study three data releases were used, namely 2005-2006, 2007- 2008, and 2009-2010 [8] [9].
Data from the first 24-hr dietary recall in NHANES were used, which was an in-person conducted assessment with trained specialists using the best methods developed to date (i.e., the multiple pass method was developed and validated, at least in adults, by the USDA), with all foods and beverages consumed in the last 24 hour period recorded. USDA’s Food and Nutrient Database for Dietary Studies, 3.0, 4.1, and 5.0 was used to code dietary intake data and calculate nutrient intakes [10]-[12].
To develop patterns of grain consumption we used cluster analyses which is a statistical procedure that ana-lyses large data sets to develop various patterns while trying to maximize differences among the patterns. We used the USDA food coding system to define categories of grain foods [12].
Grain foods intake patterns were identified using SAS 9.4 (SAS Institute, Cary, NC, 2013) PROC CLUSTER using a single 24-hour dietary recall in NHANES 2005-2010 and applying population weights to adjust for the complex design. Clusters were developed based on the percentage of calories consumed from the grain products as the centroid for each cluster. Grains from flour and dry mixes, mixed dishes, and meat substitutes were not included in development of grain clusters. Cluster analyses provides the ability to focus on a particular defined aspect (e.g. calories from grains) and then forces maximal differences in clusters for assessment.. For these ana-lyses, the USDA grains products were collapsed into the grain food groupings mentioned above. All food codes fit in one and only one of the grain foods groupings. The patterns identified by the cluster analysis were then identified by percent calories within each grain food grouping (only groups that contributed 5% or more of calo-ries were used to define the clusters) at the centroid of each cluster. Using this method resulted in seven readily identifiable grain food patterns and a no consumption of main grain groups (i.e., no grains group); creating eight unique patterns of consumption. With grain foods patterns identified, and using the output from the cluster pro-cedure, each subject was then placed in the cluster that matched most closely to the pattern of calories across the food categories.
Adjusted mean values were determined for subjects in each cluster using PROC REGRESS in SUDAAN 11.0 with various sets of covariates. Covariates for analyses of energy intake, Healthy Eating Index (HEI)-2010 and HEI sub-components [13] were age, gender, ethnicity, poverty income ratio, physical activity (sedentary, mod-erate or vigorous based on questionnaire responses), current smoking status, and alcohol intake. The HEI pro-vides a measure of diet quality and conforms to federal dietary guidance and has been predominantly used to monitor dietary practices of the US population and the low-income subpopulation. Nutrient intakes were also adjusted for energy intakes. For body weight, body-mass index (BMI), and waist circumference, covariates were the same as those for energy intake. All other physiological variables had the same covariates but were also ad-justed for BMI. The main comparison of interest was to compare results between the no grains group (cluster 0) and all other clusters. To increase the rigor of the analyses, a P-value of P < 0.01 was set for significance in place of the traditional value of P < 0.05.
3. Results
Eight grain clusters were identified, one of which included isolating a group of adults that did not consume any of the identified grains (5.8% of the population). The eight clusters were defined as outlined in Table 1, namely: 1) no consumption of main grain groups, 2) crackers and salty snacks, 3) yeast breads and rolls, 4) cakes, coo-kies, and pies, 5) cereals, 6) pasta, cooked cereal and rice, 7) quick breads, and 8) mixed grains.
3.1. Energy and Nutrient Intakes
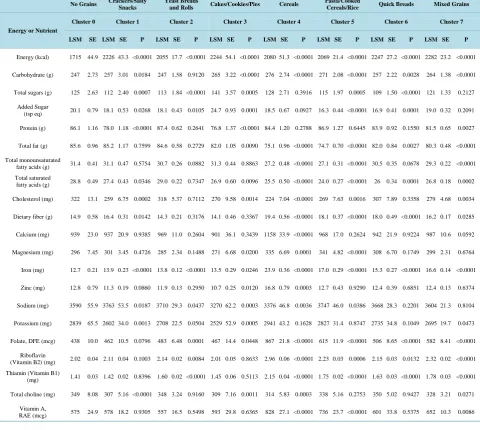
Nutrient and energy intakes in the eight grain food patterns are presented in Table 2. In adults, energy intake was significantly higher in those in all clusters as compared to individuals in the no grains cluster. The higher energy intake ranged from 340 to 567 kcal/d with mixed grains cluster representing the greatest increase in kcal/day (Table 2).
Table 1. Grain cluster pattern based on percentage of calories from grains in adults ≥19 years old of age using data from NHANES
2005-2010.
Cluster number Grain foods pattern Description
0 No grains 5.8% of the population
1 Crackers and salty snacks (9.4% of the population) with over 73% of grains coming from this grain group;
2 Yeast breads and rolls (22.6% of the population) with over 92% of grains coming from this grain group;
3 Cakes, cookies and pies (4.6% of the population) with over 88% of grains coming from this grain group;
4 Cereals (4.3% of the population) with over 75% of grains coming from this grain group;
5 Pasta, cooked cereals and rice (10.5% of the population) with over 59% of grains coming from this grain group;
6 Quick breads (13.1% of the population) with over 69% of grains coming from this grain group;
7 Mixed grains
(29.7% of the population) with almost 50% of grains coming from yeast bread and rolls but with significant percentages of grains coming from cakes, cookies
and pies (14.5%); crackers and salty snacks (12.5%); and cereals (9.4%).
Table 2. Adjusted Mean (SE) nutrient and energy intake for all grain clusters using NHANES 2005-2010, ≥19 years of age.
No Grains Crackers/Salty Snacks
Yeast Breads
and Rolls Cakes/Cookies/Pies Cereals
Pasta/Cooked
Cereals/Rice Quick Breads Mixed Grains
Energy or Nutrient
Cluster 0 Cluster 1 Cluster 2 Cluster 3 Cluster 4 Cluster 5 Cluster 6 Cluster 7
LSM SE LSM SE P LSM SE P LSM SE P LSM SE P LSM SE P LSM SE P LSM SE P
Energy (kcal) 1715 44.9 2226 43.3 <0.0001 2055 17.7 <0.0001 2244 54.1 <0.0001 2080 51.3 <0.0001 2069 21.4 <0.0001 2247 27.2 <0.0001 2282 23.2 <0.0001
Carbohydrate (g) 247 2.73 257 3.01 0.0184 247 1.58 0.9120 265 3.22 <0.0001 276 2.74 <0.0001 271 2.08 <0.0001 257 2.22 0.0028 264 1.38 <0.0001
Total sugars (g) 125 2.63 112 2.40 0.0007 113 1.84 <0.0001 141 3.57 0.0005 128 2.71 0.3916 115 1.97 0.0005 109 1.50 <0.0001 121 1.33 0.2127
Added Sugar
(tsp eq) 20.1 0.79 18.1 0.53 0.0268 18.1 0.43 0.0105 24.7 0.93 0.0001 18.5 0.67 0.0927 16.3 0.44 <0.0001 16.9 0.41 0.0001 19.0 0.32 0.2091
Protein (g) 86.1 1.16 78.0 1.18 <0.0001 87.4 0.62 0.2641 76.8 1.37 <0.0001 84.4 1.20 0.2788 86.9 1.27 0.6445 83.9 0.92 0.1550 81.5 0.65 0.0027
Total fat (g) 85.6 0.96 85.2 1.17 0.7599 84.6 0.58 0.2729 82.0 1.05 0.0090 75.1 0.96 <0.0001 74.7 0.70 <0.0001 82.0 0.84 0.0027 80.3 0.48 <0.0001
Total monounsaturated
fatty acids (g) 31.4 0.41 31.1 0.47 0.5754 30.7 0.26 0.0882 31.3 0.44 0.8863 27.2 0.48 <0.0001 27.1 0.31 <0.0001 30.5 0.35 0.0678 29.3 0.22 <0.0001
Total saturated
fatty acids (g) 28.8 0.49 27.4 0.43 0.0346 29.0 0.22 0.7347 26.9 0.60 0.0096 25.5 0.50 <0.0001 24.0 0.27 <0.0001 26 0.34 0.0001 26.8 0.18 0.0002
Cholesterol (mg) 322 13.1 259 6.75 0.0002 318 5.37 0.7112 270 9.58 0.0014 224 7.04 <0.0001 269 7.63 0.0016 307 7.89 0.3358 279 4.68 0.0034
Dietary fiber (g) 14.9 0.58 16.4 0.31 0.0142 14.3 0.21 0.3176 14.1 0.46 0.3367 19.4 0.56 <0.0001 18.1 0.37 <0.0001 18.0 0.49 <0.0001 16.2 0.17 0.0285
Calcium (mg) 939 23.0 937 20.9 0.9385 969 11.0 0.2604 901 36.1 0.3439 1158 33.9 <0.0001 968 17.0 0.2624 942 21.9 0.9224 987 10.6 0.0592
Magnesium (mg) 296 7.45 301 3.45 0.4726 285 2.34 0.1488 271 6.68 0.0200 335 6.69 0.0001 341 4.82 <0.0001 308 6.70 0.1749 299 2.31 0.6764
Iron (mg) 12.7 0.21 13.9 0.23 <0.0001 13.8 0.12 <0.0001 13.5 0.29 0.0246 23.9 0.36 <0.0001 17.0 0.29 <0.0001 15.3 0.27 <0.0001 16.6 0.14 <0.0001
Zinc (mg) 12.8 0.79 11.3 0.19 0.0860 11.9 0.13 0.2950 10.7 0.25 0.0120 16.8 0.79 0.0003 12.7 0.43 0.9290 12.4 0.39 0.6851 12.4 0.13 0.6374
Sodium (mg) 3590 55.9 3763 53.5 0.0187 3710 29.3 0.0437 3270 62.2 0.0003 3376 46.8 0.0036 3747 46.0 0.0386 3668 28.3 0.2201 3604 21.3 0.8104
Potassium (mg) 2839 65.5 2602 34.0 0.0013 2708 22.5 0.0504 2529 52.9 0.0005 2941 43.2 0.1628 2827 31.4 0.8747 2735 34.8 0.1049 2695 19.7 0.0473
Folate, DFE (mcg) 438 10.0 462 10.5 0.0796 483 6.48 0.0001 467 14.4 0.0448 867 21.8 <0.0001 615 11.9 <0.0001 506 8.65 <0.0001 582 8.41 <0.0001
Riboflavin
(Vitamin B2) (mg) 2.02 0.04 2.11 0.04 0.1003 2.14 0.02 0.0084 2.01 0.05 0.8633 2.96 0.06 <0.0001 2.23 0.03 0.0006 2.15 0.03 0.0132 2.32 0.02 <0.0001
Thiamin (Vitamin B1)
(mg) 1.41 0.03 1.42 0.02 0.8396 1.60 0.02 <0.0001 1.45 0.06 0.5113 2.15 0.04 <0.0001 1.75 0.02 <0.0001 1.63 0.03 <0.0001 1.78 0.03 <0.0001
Total choline (mg) 349 8.08 307 5.16 <0.0001 348 3.24 0.9160 309 7.16 0.0011 314 5.83 0.0003 338 5.16 0.2753 350 5.02 0.9427 328 3.21 0.0271
Vitamin A,
[image:4.595.57.538.296.726.2]Continued
Vitamin B12 (mcg) 5.10 0.24 4.92 0.19 0.5607 5.43 0.12 0.2090 5.12 0.64 0.9709 8.39 0.21 <0.0001 5.25 0.19 0.5869 5.09 0.14 0.9697 5.59 0.09 0.0656
Vitamin B6 (mg) 1.95 0.06 1.85 0.06 0.2415 1.88 0.02 0.3303 1.77 0.07 0.0340 2.88 0.05 <0.0001 2.23 0.04 0.0008 1.99 0.05 0.5909 2.10 0.02 0.0276
Vitamin C (mg) 99.9 6.97 80.2 5.14 0.0277 82.6 1.92 0.0109 76.2 5.07 0.0062 89.7 4.25 0.2309 96.9 3.38 0.6699 83.3 2.77 0.0220 86.2 2.02 0.0694
Vitamin D (D2 + D3)
(mcg) 4.11 0.21 4.15 0.24 0.8750 4.50 0.11 0.0699 4.21 0.22 0.7326 6.80 0.24 <0.0001 5.07 0.16 0.0008 4.38 0.18 0.2589 4.99 0.12 0.0006
Vitamin E as
alpha-tocopherol (mg) 8.02 0.26 7.76 0.19 0.2818 7.39 0.14 0.0176 7.42 0.28 0.1301 8.41 0.39 0.4306 8.08 0.26 0.8833 7.56 0.25 0.1653 7.57 0.12 0.1367
Vitamin K (mcg) 107 8.08 99.3 6.00 0.3709 89.5 3.43 0.0368 112 8.41 0.6924 91.1 7.12 0.1241 131 8.49 0.0342 111 5.44 0.6689 93.1 2.91 0.1066
NHANES 2005-2010, N = 14,384; LSM = least square mean; SE = standard error; P = P value of difference as compared to cluster 0 (No grains); Covariates include age, gender, ethnicity, poverty income ratio, physical activity, current smoking status, alcohol and for all variables except Energy, the covariate of energy (kcal).
adults consuming “cereals”, “pasta, cooked cereals and rice”, and “quick breads”, ranging from 3.1 to 4.5 g/day of increased fiber consumption as compared to those in the no grains group. Vitamin D was greater in those consuming “cereals”, “pasta, cooked cereals and rice” and “mixed grains”, while potassium was lower in adults consuming “crackers and salty snacks” and “cakes, cookies and pies” as compared to those not consuming grain food products.
Regarding nutrients to limit, total saturated fat intake was reduced in all grain patterns examined, except “yeast breads and rolls” and “crackers and salty snacks” (i.e., the range of saturated fat intake was between 1.9 and 4.8 g/day lower; see Table 2) and sodium intake was decreased (213 to 319 mg/day) in adults consuming “cakes, cookies and pies” and “cereals” when compared to adults not consuming grain foods. Total sugars were lower (10.3 to 15.9 g/day) in those consuming “crackers and salty snacks”, “yeast breads and rolls”, “pasta, cooked cereals and rice” and “quick breads”, but significantly higher (16.5 g/d) in adults predominantly con-suming “cakes, cookies and pies” as compared to those not concon-suming grain foods. Added sugars were higher (4.7 tsp/d) in those consuming “cakes, cookies and pies” and lower in those consuming “pasta, cooked cereals, and rice” and “quick breads” grain patterns (3.8 and 3.1 tsp/d, respectively, seeTable 2) in comparison to the no grains group.
Regarding nutrients added to grain foods, via either enrichment or fortification practices, iron intake was greater in adults in all grain cluster food patterns examined except for those consuming “cakes, cookies and pies”, while those consuming “yeast breads and rolls”, “cereals”, “pasta, cooked cereals and rice”, and “mixed grains” had significantly higher intake of thiamin and riboflavin a as compared to adults not consuming grain foods. Folate was higher (46 to 429 µg/d) in those in all grain food clusters, except “crackers and salty snacks” and “cakes, cookies and pies”, while zinc intake was higher only in adults consuming “cereals” compared to those in the no grains cluster. Magnesium intakes were significantly greater in adults consuming “cereals” and “pasta, cooked cereals and rice” patterns relative to the no grains group (Table 2).
3.2. Healthy Eating Index-2010
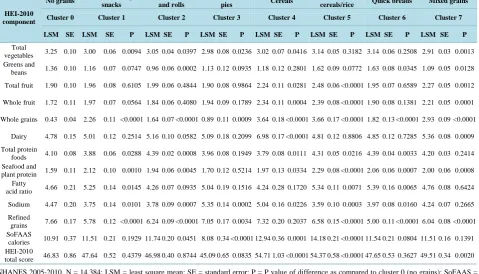
Diet quality, as measured by USDA’s Healthy Eating Index-2010 (HEI-2010) is depicted inTable 3. Adults in the no grain pattern had an HEI score of 46.8 ± 0.9. Adults in three of the grain clusters had significantly higher scores relative to the no grains food pattern; adults consuming “cereals” had a HEI score of 54.7 ± 1.0, while in-dividuals consuming “pasta, cooked cereals and rice”, and “mixed grains” had scores of 54.4 ± 0.6 and 49.5 ± 0.3, respectively (Table 3).
Table 3. Adjusted Mean (SE) total Healthy Eating Index-2010 (HEI) and component scores for all grain clusters using NHANES 2005-2010, ≥19 years of age.
HEI-2010 component
No grains Crackers/salty
snacks
Yeast breads and rolls
Cakes/cookies/
pies Cereals
Pasta/cooked
cereals/rice Quick breads Mixed grains
Cluster 0 Cluster 1 Cluster 2 Cluster 3 Cluster 4 Cluster 5 Cluster 6 Cluster 7
LSM SE LSM SE P LSM SE P LSM SE P LSM SE P LSM SE P LSM SE P LSM SE P
Total
vegetables 3.25 0.10 3.00 0.06 0.0094 3.05 0.04 0.0397 2.98 0.08 0.0236 3.02 0.07 0.0416 3.14 0.05 0.3182 3.14 0.06 0.2508 2.91 0.03 0.0013 Greens and
beans 1.36 0.10 1.16 0.07 0.0747 0.96 0.06 0.0002 1.13 0.12 0.0935 1.18 0.12 0.2801 1.62 0.09 0.0772 1.63 0.08 0.0345 1.09 0.05 0.0128
Total fruit 1.90 0.10 1.96 0.08 0.6105 1.99 0.06 0.4844 1.90 0.08 0.9864 2.24 0.11 0.0281 2.48 0.06 <0.0001 1.95 0.07 0.6589 2.27 0.05 0.0012
Whole fruit 1.72 0.11 1.97 0.07 0.0564 1.84 0.06 0.4080 1.94 0.09 0.1789 2.34 0.11 0.0004 2.39 0.08 <0.0001 1.90 0.08 0.1381 2.21 0.05 0.0001
Whole grains 0.43 0.04 2.26 0.11 <0.0001 1.64 0.07 <0.0001 0.89 0.11 0.0009 3.64 0.18 <0.0001 3.66 0.17 <0.0001 1.82 0.13 <0.0001 2.93 0.09 <0.0001
Dairy 4.78 0.15 5.01 0.12 0.2514 5.16 0.10 0.0582 5.09 0.18 0.2099 6.98 0.17 <0.0001 4.81 0.12 0.8806 4.85 0.12 0.7285 5.36 0.08 0.0009
Total protein
foods 4.10 0.08 3.88 0.06 0.0288 4.39 0.02 0.0008 3.96 0.08 0.1949 3.79 0.08 0.0111 4.31 0.05 0.0216 4.39 0.04 0.0033 4.20 0.03 0.2414 Seafood and
plant protein 1.59 0.11 2.12 0.10 0.0010 1.94 0.06 0.0045 1.70 0.12 0.5214 1.97 0.13 0.0334 2.29 0.08 <0.0001 2.06 0.06 0.0007 2.00 0.06 0.0008 Fatty
acid ratio 4.66 0.21 5.25 0.14 0.0145 4.26 0.07 0.0935 5.04 0.19 0.1516 4.24 0.28 0.1720 5.34 0.11 0.0071 5.39 0.16 0.0065 4.76 0.08 0.6424
Sodium 4.47 0.20 3.75 0.14 0.0101 3.78 0.09 0.0007 5.35 0.14 0.0002 5.04 0.16 0.0226 3.59 0.10 0.0003 3.97 0.08 0.0160 4.24 0.07 0.2665
Refined
grains 7.66 0.17 5.78 0.12 <0.0001 6.24 0.09 <0.0001 7.05 0.17 0.0034 7.32 0.20 0.2037 6.58 0.15 <0.0001 5.00 0.11 <0.0001 6.04 0.08 <0.0001 SoFAAS
calories 10.91 0.37 11.51 0.21 0.1929 11.74 0.20 0.0451 8.08 0.34 <0.0001 12.94 0.36 0.0001 14.18 0.21 <0.0001 11.54 0.21 0.0804 11.51 0.16 0.1391 HEI-2010
total score 46.83 0.86 47.64 0.52 0.4379 46.98 0.40 0.8744 45.09 0.65 0.0835 54.71 1.03 <0.0001 54.37 0.58 <0.0001 47.65 0.53 0.3627 49.51 0.34 0.0020
NHANES 2005-2010, N = 14,384; LSM = least square mean; SE = standard error; P = P value of difference as compared to cluster 0 (no grains); SoFAAS = solid fat, alcohol, added sugars; covariates include age, gender, ethnicity, poverty income ratio, physical activity, current smoking status, and alcohol.
rice” and “mixed grains” clusters for whole fruit, while all grain cluster patterns had significantly higher scores for whole grains as compared to those not consuming grain foods, indicating the contributory value of all grains in helping to reach whole grain recommendations. Additionally, adults consuming “pasta, cooked cereals, and rice” and “mixed grains” had significantly higher scores for total fruit, while all grain clusters except “cereals” and “cakes, cookies and pies”, had greater scores for seafood and plant protein in comparison to adults in the no grains pattern. “Cereals”, and “pasta, cooked cereals, and rice” clusters also had significantly greater scores for empty calories (signifying less calories from solid fats, alcohol and added sugars), while those consuming “cakes, cookies and pies” had a greater amount of calories from solid fats, alcohol and added sugars.
3.3. Physiological Variables
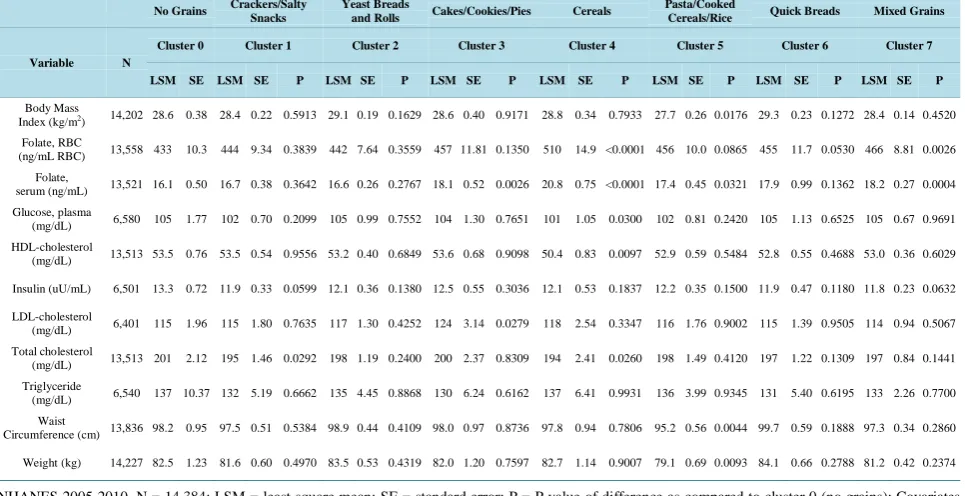
In adults, body weight and waist circumference were significantly lower (3.5 kg and 3.0 cm, respectively) in those in the “pasta, cooked cereals, and rice” cluster pattern relative to adults in the no grain cluster (body weights: 79.1 ± 0.7 vs. 82.5 ± 1.2 kg, P = 0.009; waist circumference: 95.2 ± 0.6 vs. 98.2 ± 1.0 cm; P= 0.004) (Table 4).
Red blood cell folate was higher in those consuming “cereals” (an increase of 76.6 ng/ml RBC) and “mixed grains” (an increase of 32.5 ng/ml RBC) while serum folate was higher in those in the “cakes, cookies, and pies”, “ereals”, and “mixed grains” grain food patterns (range of increase was 2.0 to 4.7 ng/ml) relative to adults in the no grain group. HDL cholesterol was significantly lower (a decrease of 3.1 mg/dL) in the “cereals” cluster as compared to the no grains cluster, while no differences were seen with LDL-cholesterol across clusters versus the no grains group. There were no differences observed for plasma glucose, plasma insulin, total cholesterol and triglycerides for adults in all clusters when compared to the no grains cluster pattern (Table 4).
4. Discussion
Table 4. Adjusted Mean (SE) physiological variables for all grain clusters using NHANES 2005-2010, ≥19 years of age.
No Grains Crackers/Salty Snacks
Yeast Breads
and Rolls Cakes/Cookies/Pies Cereals
Pasta/Cooked
Cereals/Rice Quick Breads Mixed Grains
Variable N
Cluster 0 Cluster 1 Cluster 2 Cluster 3 Cluster 4 Cluster 5 Cluster 6 Cluster 7
LSM SE LSM SE P LSM SE P LSM SE P LSM SE P LSM SE P LSM SE P LSM SE P
Body Mass Index (kg/m2
) 14,202 28.6 0.38 28.4 0.22 0.5913 29.1 0.19 0.1629 28.6 0.40 0.9171 28.8 0.34 0.7933 27.7 0.26 0.0176 29.3 0.23 0.1272 28.4 0.14 0.4520
Folate, RBC
(ng/mL RBC) 13,558 433 10.3 444 9.34 0.3839 442 7.64 0.3559 457 11.81 0.1350 510 14.9 <0.0001 456 10.0 0.0865 455 11.7 0.0530 466 8.81 0.0026
Folate,
serum (ng/mL) 13,521 16.1 0.50 16.7 0.38 0.3642 16.6 0.26 0.2767 18.1 0.52 0.0026 20.8 0.75 <0.0001 17.4 0.45 0.0321 17.9 0.99 0.1362 18.2 0.27 0.0004
Glucose, plasma
(mg/dL) 6,580 105 1.77 102 0.70 0.2099 105 0.99 0.7552 104 1.30 0.7651 101 1.05 0.0300 102 0.81 0.2420 105 1.13 0.6525 105 0.67 0.9691
HDL-cholesterol
(mg/dL) 13,513 53.5 0.76 53.5 0.54 0.9556 53.2 0.40 0.6849 53.6 0.68 0.9098 50.4 0.83 0.0097 52.9 0.59 0.5484 52.8 0.55 0.4688 53.0 0.36 0.6029
Insulin (uU/mL) 6,501 13.3 0.72 11.9 0.33 0.0599 12.1 0.36 0.1380 12.5 0.55 0.3036 12.1 0.53 0.1837 12.2 0.35 0.1500 11.9 0.47 0.1180 11.8 0.23 0.0632
LDL-cholesterol
(mg/dL) 6,401 115 1.96 115 1.80 0.7635 117 1.30 0.4252 124 3.14 0.0279 118 2.54 0.3347 116 1.76 0.9002 115 1.39 0.9505 114 0.94 0.5067
Total cholesterol
(mg/dL) 13,513 201 2.12 195 1.46 0.0292 198 1.19 0.2400 200 2.37 0.8309 194 2.41 0.0260 198 1.49 0.4120 197 1.22 0.1309 197 0.84 0.1441
Triglyceride
(mg/dL) 6,540 137 10.37 132 5.19 0.6662 135 4.45 0.8868 130 6.24 0.6162 137 6.41 0.9931 136 3.99 0.9345 131 5.40 0.6195 133 2.26 0.7700
Waist
Circumference (cm) 13,836 98.2 0.95 97.5 0.51 0.5384 98.9 0.44 0.4109 98.0 0.97 0.8736 97.8 0.94 0.7806 95.2 0.56 0.0044 99.7 0.59 0.1888 97.3 0.34 0.2860
Weight (kg) 14,227 82.5 1.23 81.6 0.60 0.4970 83.5 0.53 0.4319 82.0 1.20 0.7597 82.7 1.14 0.9007 79.1 0.69 0.0093 84.1 0.66 0.2788 81.2 0.42 0.2374
NHANES 2005-2010, N = 14,384; LSM = least square mean; SE = standard error; P = P value of difference as compared to cluster 0 (no grains); Covariates include age, gender, ethnicity, poverty income ratio, physical activity, current smoking status, and for non-weight-related variables, the model also includes body mass index.
grain food pattern consumption, nutrient intakes, diet quality and health outcomes. Specifically, certain grain food patterns are associated with greater nutrient intakes, including higher consumption of shortfall nutrients and nutrients of public health concern as identified by the 2015-2020 Dietary Guidelines. Further, adults in the “ce-reals”, “pasta, cooked cereals and rice” and “mixed grains” clusters had improved diet quality as measured by USDA’s HEI-2010, relative to those not consuming grain food products. The present observational analysis also found that adults consuming certain grain food patterns have favorable obesity-related outcomes, including low-er body weight and a reduced waist circumflow-erence. Ovlow-erall, the present data support sevlow-eral grain food pattlow-erns as part of a healthy dietary food pattern, that takes into consideration authoritative recommendations to reduce total fat, saturated fat and added sugar consumption, while concurrently increasing 2015-2020 Dietary Guide-lines’ shortfall nutrients and/or nutrients of concern, including iron, magnesium, dietary fiber, vitamin D, potas-sium and folate.
Whole grain cereals and breads have been well-documented in the literature for their role in the prevention of chronic diseases. Regular consumption of whole grain cereals and breads have been linked to lower risk for car-diovascular disease, type 2 diabetes mellitus, and with certain cancers, as discussed in a recent review [14]. Sim-ilar to nutrition guidance worldwide, US 2010 dietary recommendations focused on consuming at least half of all grains as whole grains, which is largely a minimum of 3 ounce equivalents per day for most adults, with strong encouragement to increase whole grain consumption by replacing refined grains with whole grains [15], a concept that has been carried forward by the 2015-2020 Dietary Guidelines and the 2015 Dietary Guidelines Advisory Committee (2015 DGAC) [1] [16]. A recent NHANES analysis reported less than 8% of US adults consumed at least 3 whole grain ounce equivalents per day, while about 50% of adults consumed >0 and <3 whole grain ounce equivalents per day, and nearly 42% reported not consuming any whole grains [17]. Likewise, data stemming from What We Eat in America 2007-2010, showed that the estimated percent of the US popula-tion consuming below established whole grain recommendapopula-tions is greater than 95% in all children and adults
and premenopausal females. Similarly, recent work evaluating diet quality based on Denmark’s food-based die-tary guidance, identified that while iron intake increased with a better diet quality, mean iron intake in women of childbearing age across all groups examined were below recommended levels, thus suggesting a diet closely aligned to Danish recommendations may still leave many women at risk for inadequate intakes of iron [18]. In the present analyses, iron was significantly higher in adults in all of the grain food patterns examined, while those consuming six of the seven grain food patterns had significantly greater folate intake, ranging from 46 to 429 µg per day, relative to those not consuming grain foods. Similarly, magnesium intakes were elevated in adults consuming “cereals” and “pasta, cooked cereals and rice” by 39 and 45 mg per day, respectively, in com-parison to adults not consuming grains, representing about 10% of the Daily Value established for magnesium for adults consuming a 2000 kcal diet.
While previous dietary intake research has reported increased intakes of low-fat dairy products, fish, poultry, rye bread, fruit and vegetables to be associated with a better diet quality and consumption of high-fat dairy products, red and processed meat, white bread, soft drinks, sweets and cakes to be associated with lower diet quality scores, the researchers also noted that added sugar intake and fat on bread were greater in the lowest quartile of the diet quality index and contributed to the high intake of total fat and saturated fat. Collectively, this may represent a meaningful contribution for the lower diet quality outcome and warrants further investigation
[18]. Our results are aligned with previous observational findings that considered sources of nutrients in the US diet. When identifying the top food sources of nutrients, including both intrinsic and added to foods via fortifi-cation, results showed that grain foods represented the top five ranking food sources for folate, such that ready- to-eat cereals, yeast breads and rolls, pizza, pasta and crackers, popcorn, pretzels, and chips contributed 56.7% and 54.4% of folate to the diet of children and adolescents, respectively. Similarly, grain foods represented the top five food sources for iron in the diet of US children and adolescents, with ready-to-eat cereals, yeast breads, pizza, cakes, cookies, and pies, and crackers, popcorn, pretzels, and chips cumulatively contributing 52.1% and 48.7% of iron [4].
The 2015 DGAC [16] report further states “of the shortfall nutrients, calcium, vitamin D, fiber, and potassium also are classified as nutrients of public health concern because their under consumption has been linked in the scientific literature to adverse health outcomes”, a principle carried forward from the 2010 Dietary Guidelines for Americans policy document [19]. The 2015 DGAC [16] also reports that “if whole grains were consumed in the amounts recommended in the recommended food patterns, whole grains would provide substantial percen-tages of several key nutrients, such as about 32 percent of dietary fiber, 42% of iron, 35% of folate, 29% of magnesium and 16% of vitamin A”. While these nutrients levels represent significant contributions from whole grains, whole grain consumption alone can still leave a gap between consumption and recommendation levels. The 2005 Dietary Guidelines Advisory Committee reported that refined grains contribute substantial levels of key nutrients to food patterns, naming folate, iron, calcium, dietary fiber, thiamin, riboflavin and niacin [20]. The committee further acknowledged that including only three ounce equivalents of whole grains daily with no refined grains in recommended food patterns would lower intake of many key nutrients and potentially place specific populations at risk for nutrient inadequacy [20]; an argument which led the 2015 DGAC to conclude that consumption of whole grains with no substitutions would result in nutrient shortfalls [16]. The current anal-ysis provides data linking different grain food patterns with nutrient intakes and concurrently we observed the adverse nutrient- and health-related outcomes when grain foods as a whole are eliminated from the diet. In many of the grain patterns examined, a better nutrient intake profile was observed which demonstrates the important dietary contributions made by different grain foods and emphasizes the importance of consuming whole and re-fined grains. Indeed, while some of the grain food clusters contributed nutrients to limit in the diet as identified by the 2015 DGAC report [16], including saturated fat, added sugars, and sodium, several of the grain food pat-terns were associated with lower intakes of these nutrients and improved shortfall nutrient intakes and diet qual-ity. Thus, it is conceivable to rationalize that Americans need more specific dietary guidance about grain con-sumption rather than simply having two broad categories of recommended intakes that revolve around refined and whole grains.
evidence, being observational, cannot establish a causal link between the different grain foods patterns examined and improvements in diet quality, nutrient intakes and other health variables considered. However, a large strength of the current work stems from the use of NHANES, which is a large continuous survey that examines a nationally representative sample of about 5,000 individuals yearly by highly-trained medical personnel [8]. Ad-ditionally we used numerous covariates to adjust data in an attempt to remove potential confounding; however residual confounding may still exist that could explain some of the results reported.
5. Conclusion
In summary, the consumption of certain grain food patterns in US adults is associated with greater nutrient in-takes, including higher consumption shortfall nutrients and nutrients of public health concern as identified by the 2015-2020 Dietary Guidelines [17]. Further, adults in the “pasta, cooked cereals and rice”, “cereals”, and “mixed grains” dietary patterns had improved diet quality as measured by USDA’s HEI-2010, when compared to adults not consuming grain foods. In addition, adults consuming certain grain food patterns have favorable obesity-related health outcomes, including decreased body weights and a reduced risk of having an elevated waist circumference. Overall, while some grain food patterns were associated with elevated sodium and added sugar, the present data also support that several grain food patterns can serve as part of a healthy dietary food pattern that accounts for 2015 Dietary Guidelines recommendations to reduce total fat, saturated fat and added sugar consumption, while concurrently increasing intake of shortfall nutrients and/or nutrients of concern, in-cluding iron, magnesium, dietary fiber, vitamin D, potassium and folate.
Acknowledgements
The current analyses were supported by funding from the Grain Foods Foundation in Washington, DC. YP col-laborated on the conception and interpretation of the research and drafted the manuscript. VLF directed the con-ception and design of the research, conducted the analyses and provided interpretation. Both authors approved the final version of the present manuscript.
References
[1] United States Department of Health and Human Services and United States Department of Agriculture (2015) 2015- 2020 Dietary Guidelines for Americans. 8th Edition, U.S. Government Printing Office, December.
[2] United States Food and Drug Administration (1996) Food Standards: Amendment of Standards of Identity for Enriched Grain Products to Require Addition of Folic Acid. Federal Register, 61.
http://www.gpo.gov/fdsys/pkg/FR-1996-03-05/pdf/96-5014.pdf
[3] Dietrich, M., et al. (2005) The Effect of Folate Fortification of Cereal-Grain Products on Blood Folate Status, Dietary Folate Intake, and Dietary Folate Sources among Adult Non-Supplement Users in the United States. Journal of the American College of Nutrition, 24, 266-274. http://dx.doi.org/10.1080/07315724.2005.10719474
[4] Berner, L.A., et al. (2014) Fortified Foods Are Major Contributors to Nutrient Intakes in Diets of US Children and Adolescents. Journal of the Academy of Nutrition and Dietetics, 114, 1009-1022.
http://dx.doi.org/10.1016/j.jand.2013.10.012
[5] Reedy, J. and Krebs-Smith, S.M. (2010) Dietary Sources of Energy, Solid Fats, and Added Sugars among Children and Adolescents in the United States. Journal of the American Dietetic Association, 110, 1477-1484.
http://dx.doi.org/10.1016/j.jada.2010.07.010
[6] Huth, P.J., et al. (2013) Major Food Sources of Calories, Added Sugars, and Saturated Fat and Their Contribution to Essential Nutrient Intakes in the U.S. Diet: Data from the National Health and Nutrition Examination Survey (2003- 2006). Nutrition Journal, 12. http://dx.doi.org/10.1186/1475-2891-12-116
[7] O’Neil, C.E., et al. (2012) Food Sources of Energy and Nutrients among Adults in the US: NHANES 2003-2006. Nu-trients, 4, 2097-2120. http://dx.doi.org/10.3390/nu4122097
[8] National Health and Nutrition Examination Survey. Analytic and Reporting Guidelines.
http://www.cdc.gov/nchs/data/nhanes/nhanes_03_04/nhanes_analytic_guidelines_dec_2005.pdf
[9] National Health and Nutrition Examination Survey. Analytic Note Regarding 2007-2010 Survey Design Changes and Combining Data across Other Survey Cycles. http://www.cdc.gov/nchs/data/nhanes/analyticnote_2007-2010.pdf [10] United States Department of Agriculture (2008) USDA Food and Nutrient Database for Dietary Studies, 3.0.
[11] United States Department of Agriculture (2010) USDA Food and Nutrient Database for Dietary Studies, 4.1. U.S. De-partment of Agriculture, Agricultural Research Service, Food Surveys Research Group, Beltsville.
[12] Ahuja, J.K.A., et al. (2012) USDA Food and Nutrient Database for Dietary Studies, 5.0. United States Department of Agriculture, Agricultural Research Service, Food Surveys Research Group, Beltsville.
[13] Guenther, P.M., et al. (2013) Update of the Healthy Eating Index: HEI-2010. Journal of the Academy of Nutrition and Dietetics, 113, 569-580. http://dx.doi.org/10.1017/S1368980011002576
[14] Gil, A., et al. (2011) Wholegrain Cereals and Bread: A Duet of the Mediterranean Diet for the Prevention of Chronic Diseases. Public Health Nutrition, 14, 2316-2322. http://dx.doi.org/10.1017/S1368980011002576
[15] The Secretary of Health and Human Services and Secretary of Agriculture. United States Department of Agriculture (2010) Scientific Report of the Dietary Guidelines Advisory Committee on the Dietary Guidelines for Americans, 2010. US Department of Agriculture, Washington DC.
[16] United States Department of Agriculture and United States Department of Health and Human Services (USDA/HHS) (2015) Scientific Report of the 2015 Dietary Guidelines Advisory Committee: Advisory Report to the Secretary of Health and Human Services and Secretary of Agriculture. USDA, Agricultural Research Service, Washington DC.
[17] Reicks, M., et al. (2014) Total Dietary Fiber Intakes in the US Population Are Related to Whole Grain Consumption: Results from the National Health and Nutrition Examination Survey 2009 to 2010. Nutrition Research, 34, 226-234.
http://dx.doi.org/10.1016/j.nutres.2014.01.002
[18] Knudsen, V.K., et al. (2012) Evaluation of Dietary Intake in Danish Adults by Means of an Index Based on Food- Based Dietary Guidelines. Food & Nutrition Research, 56, 17129. http://dx.doi.org/10.3402/fnr.v56i0.17129
[19] United States Department of Agriculture and United States Department of Health and Human Services (2010) Dietary Guidelines for Americans, 2010. 7th Edition, U.S. Government Printing Office, December, Washington DC.
[20] The Secretary of Health and Human Services and Secretary of Agriculture. U.S. Department of Agriculture (2005) Scientific Report of the Dietary Guidelines Advisory Committee on the Dietary Guidelines for Americans, 2005. US Department of Agriculture, Washington DC.
[21] Dwyer, J., et al. (2003) Members of the Steering Committee; National Health and Nutrition Examination Survey. Col-lection of Food and Dietary Supplement Intake Data: What We Eat in America-NHANES. Journal of Nutrition, 133, 590S-600S.
[22] Boeing, H. (2013) Nutritional Epidemiology: New Perspectives for Understanding the Diet-Disease Relationship? Eu-ropean Journal of Clinical Nutrition, 67, 424-429. http://dx.doi.org/10.1038/ejcn.2013.47