© 2017, IRJET | Impact Factor value: 5.181 | ISO 9001:2008 Certified Journal | Page 440
Survey Paper on Clustering Data Streams Based on Shared Density
between Micro-Clusters
Dure Supriya Suresh ; Prof. Wadne Vinod
ME(Student), ICOER ,Wagholi , Pune ,Maharastra,India Assit.Professor, ICOER ,Wagholi , Pune ,Maharastra,India
Abstract—As more and more applications
produce streaming data, clustering data streams has become an important technique for data and knowledge engineering. A typical approach is to summarize the data stream in real-time with an online process into a large number of so called micro-clusters. Micro-clusters represent local density estimates by aggregating the information of many data points in a defined area. On demand, a (modified) conventional clustering algorithm is used in a second offline step to recluster the micro-clusters into larger final clusters. For reclustering, the centers of the micro-clusters are used as pseudo points with the density estimates used as their weights. However, information about density in the area between micro-clusters is not preserved in the online process and reclustering is based on possibly inaccurate assumptions about the distribution of data within and between micro-clusters (e.g., uniform or Gaussian). This paper describes DBSTREAM, the first micro-cluster-based online clustering component that explicitly captures the density between micro-clusters via a shared density graph. The density information in this graph is then exploited for reclustering based on actual density between adjacent micro-clusters.
Index Terms—Data mining, data stream clustering, density-based clustering
1] INTRODUCTION
CLUSTERING data streams has become n important technique for data and knowledge engineering. A data stream is an ordered and potentially unbounded sequence of data points.
Such streams of constantly arriving data are generated for many types of applications and include GPS data from smart phones, web click-stream data, computer network monitoring data, tele-communication connection data, readings from sensor nets Stock quotes, etc.
Data stream clustering is typically done as a two-stage process with an online part which summarizes the data into many micro-clusters or grid cells and then, in an offline pro-cess, these micro-clusters (cells) are reclustered/merged into a smaller number of final clusters. Since the reclustering is an offline process and thus not time critical, it is typically not discussed in detail in papers about new data stream clustering algorithms. Most papers suggest to use an where the micro-clusters are used as pseudo points. Another approach used in DenStream is to use reachability where all micro-clusters which are less than a given distance from each other are linked together to form clusters. Grid-based algorithms typically merge adjacent dense grid cells to form larger clusters.Current reclustering approaches completely ignore the data density in the area between the micro-clusters (grid cells) and thus might join micro-clusters (cells) which are close together but at the same time separated by a small area of low density. To address this problem, Tu and Chen introduced an extension to the grid-based D-Stream algo-rithm based on the concept of attraction between adjacent grids cells and showed its effectiveness.
micro-© 2017, IRJET | Impact Factor value: 5.181 | ISO 9001:2008 Certified Journal | Page 441
cluster-based algorithms. We introduce the concept of a shared density graph which explicitly captures the density of the original data between micro-clusters during clustering and then show how the graph can be used for reclustering micro-clusters. This is a novel approach since instead on relying on assumptions about the distribution of data points assigned to a micro-cluster (MC) (often a Gaussian distribution around a cen-ter), it estimates the density in the shared region between micro-clusters directly from the data. To the best of our knowledge, this paper is the first to propose and investigate using a shared-density-based reclustering approach for data stream clustering
2] RELATED WORK
Density-based clustering is a well-researched area and we can only give a very brief overview here. DBSCAN [10] and several of its improvements can be seen as the prototypical density-based clustering approach. DBSCAN estimates the density around each data point by counting the number of points in a user-specified eps-neighborhood and applies user-specified thresholds to identify core, border and noise points. In a second step, core points are joined into a cluster if they are density-reachable (i.e., there is a chain of core points where one falls inside the eps-neighborhood of the next). Finally, border points are assigned to clusters. Other approaches are based on kernel density estimation (e.g., DENCLUE [11]) or use shared nearest neighbors
However, these algorithms were not developed with data streams in mind. A data stream is an ordered and potentially unbounded sequence of data points X ¼ hx1; x2; x3; . . .i. It is not possible to permanently store all the data in the stream which implies that repeated random access to the data is infeasible. Also, data streams exhibit concept drift over time where the position and/or shape of clusters changes, and new clusters may appear or existing clusters disappear. This makes the application of existing clustering algorithms
diffi-cult. Data stream clustering algorithms limit data access to a single pass over the data and adapt to concept drift. Over the last 10 years many algorithms for clustering data streams have been proposed. Most data stream clustering algorithms use a two-stage online/offline approach.
Fig. 1. Problem with reclustering when dense areas are separated by small areas of low density with (a) micro clusters and (b) grid cells.
[image:2.595.303.558.197.280.2]Reclustering methods based solely on micro-clusters only take closeness of the micro-micro-clusters into account. This makes it likely that two micro-clusters which are close to each other, but separated by an area of low density still will be merged into a cluster. Information about the density between micro-clusters is not available since the information does not get recorded in the online step and the original data points are no longer available. Fig. 1a illustrates the problem where the micro-clusters MC1 and MC2 will be merged as long as their distance d is low. This is even true when density-based clus-tering methods (e.g., DBSCAN) are used in the offline reclus-tering step, since the reclustering is still exclusively based on the micro-cluster centers and weights.
[image:2.595.317.545.572.679.2]© 2017, IRJET | Impact Factor value: 5.181 | ISO 9001:2008 Certified Journal | Page 442
3] PROPOSED SYSTEM
In this paper, we develop and evaluate a new method to address this problem for micro-cluster-based algorithms. We introduce the concept of a shared density graph which explicitly captures the density of the original data between micro-clusters during clustering and then show how the graph can be used for reclustering micro-clusters. This is a novel approach since instead on relying on assumptions about the distribution of data points assigned to a microcluster (often a Gaussian distribution around a center), it estimates the density in the shared region between microclusters directly from the data.
4] THE DBSTREAM ONLINE
COMPONENT
Typical micro-cluster-based data stream clustering algo-rithms retain the density within each micro-cluster as some form of weight (e.g., the number of points assigned to the MC). Some algorithms also capture the dispersion of the points by recording variance. For reclustering, however, only the distances between the MCs and their weights are used. In this setting, MCs which are closer to each other are more likely to end up in the same cluster. This is even true if a density-based algorithm like DBSCAN [10] is used for reclustering since here only the position of the MC centers and their weights are used. The density in the area between MCs is not available since it is not retained during the online stage.
The basic idea of this work is that if we can capture not only the distance between two adjacent MCs but also the connectivity using the density of the original data in the area between the MCs, then the reclustering results may be improved. In the following we develop DBSTREAM which stands for density-based stream clustering.
4.1Leader-Based Clustering
Leader-based clustering was introduced by Hartigan [21] as a conventional clustering algorithm. It is straight-forward to apply the idea to data streams (see, e.g., [20]).
DBSTREAM represents each MC by a leader (a data point defining the MC’s center) and the density in an area of a user-specified radius r (threshold) around the center. This is similar to DBSCAN’s concept of counting the points is an eps-neighborhood, however, here the density is not estimated for each point, but only for each MC which can easily be achieved for streaming data. A new data point is assigned to an existing MC (leader) if it is within a fixed radius of its center. The assigned point increases the density estimate of the chosen cluster and the MC’s center is updated to move towards the new data point. If the data point falls in the assignment area of several MCs then all of them are updated. If a data point cannot be assigned to any existing MC, a new MC (leader) is created for the point. Finding the potential clusters for a new data point is a fixed-radius nearest-neighbor problem [22] which can be efficiently dealt with for data of moderate dimensionality using spatial indexing data structures like a k-d tree [23]. Variations of this simple algorithm were suggested in [24] for outlier detection and in [25] for sequence modeling.
4.2 Competitive Learning
© 2017, IRJET | Impact Factor value: 5.181 | ISO 9001:2008 Certified Journal | Page 443
assigned point. To control the magnitude of the movement, we use a neighborhood function hðÞ similar to self-organiz-ing maps.
4.3 Capturing Shared Density
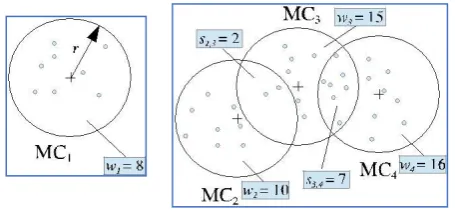
Capturing shared density directly in the online component is a new concept introduced in this paper. The fact, that in dense areas MCs will have an overlapping assignment area, can be used to measure density between MCs by counting the points which are assigned to two or more MCs. The idea is that high density in the intersection area relative to the rest of the MCs’ area means that the two MCs share an area of high density and should be part of the same macro-clus-ter. In the example in Fig. 2 we see that MC2 and MC3 are close to each other and overlap. However, the shared weight s2;3 is small compared to the weight of each of the two involved MCs indicating that the two MCs do not form a single area of high density. On the other hand, MC3 and MC4 are more distant, but their shared weight s3;4 is large indicating that both MCs form an area of high density and thus should form a single macro-cluster.
this approach to work we have to keep a time-stamp with the time when fading was applied last for each value that is subject to fading.
4.5 The Complete Online Algorithm
Algorithm 1 shows our approach and the used clustering data structures and user-specified parameters in detail. Micro-clusters are stored as a set MC. Each micro-cluster is repre-sented by the tuple ðc; w; tÞ representing the cluster center, the cluster weight and the last time it was updated, respectively. The weighted adjacency list S represents the sparse shared density graph which captures the weight of the data points shared by MCs. Since shared density estimates are also subject to fading, we also store a timestamp with each entry. Fading also shared density estimates is important since MCs are allowed to move which over time would lead to estimates of intersection areas the MC is not covering anymore.
5] COMPUTATIONAL COMPLEXITY
Space complexity of the clustering depends on the number of MCs that need to be stored in MC. In the worse case, the maximum number of strong MCs at any time is tgap MCs and is reached when every MC receives exactly a weight of one during each interval of tgap time steps. Given the cleanup strategy in Algorithm 2, where we remove weak MCs every tgap time steps, the algorithm never stores more than k0 ¼ 2tgap MCs.
The space complexity of MC is linear in the maximal number of MCs k0. The worst case size of the adjacency list of the shared density graph S depends on k0 and the dimensionality of the data. In the 2D case each MC can have a maximum of jN j ¼ 6 neighbors (at optimal packing). Therefore, each of the k0 MCs has in the adjacency list S at most six entries resulting in a space complexity of
4.4 Fading and Forgetting Data
© 2017, IRJET | Impact Factor value: 5.181 | ISO 9001:2008 Certified Journal | Page 444
storing MC and S of OðtgapÞ. For higher-dimensional data streams, the maximal num-ber of possible adjacent hyper spheres is given by Newton’s number also referred to as kissing number [29]. Newton’s number defines the maximal number of hyper spheres which can touch a hyper sphere of the same size without intersecting any other hyper sphere. If we double the radius of all hyper spheres in this configuration then we get our scenario with sphere centers touching the surface of the center sphere. We use Kd do denote Newton’s number in d dimensions. Newton’s exact number is known only for some small dimensionality values d, and for many other dimensions only lower and upper bounds are known Note, that Newton’s number grows fast, reaches 196,560 for d ¼ 24 and is unknown for most larger d. This growth would make storing the shared weights for high-dimensional data in a densely packed area very expensive. However, we also know that the maximal neighborhood size jN maxj _ minðk0 _ 1; KdÞ, since we cannot have more neigh-bors than we have MCs. Therefore, the space complexity of maintaining S is bounded by Oðk0jN maxjÞ.To analyze the algorithm’s time complexity, we need to consider all parts of the clustering function. The fixed-radius nearest neighbor search can be done using linear search in Oðdnk0 Þ, where d is the data dimensionality, n is the number of data points clustered and k0 is the number of MCs. The time complexity can be improved to Oðd n logðk0ÞÞ using a special indexing data structure like a k-d tree [23]. Adding or updating a single MC is done in time linear in n.
6] EXPERIMENTS
To perform our experiments and make them reproducible, we have implemented/interfaced all algorithms in a pub-licly available R-extension
called stream [30]. Stream pro-vides an intuitive interface for experimenting with data streams and data stream algorithms. It includes generators for all the synthetic data used in this paper as well as a growing number of data stream mining algorithms including clustering algorithms available in the MOA (Massive Online Analysis) framework [31] and the algorithm discussed in this paper. In this paper we use four synthetic data streams called Cassini, Noisy Mixture of Gaussians, and DS3 and DS41 used to evaluate CHAMELEON [13]. These data sets do not exhibit concept drift. For data with concept drift we use MOA’s Random RBF Generator with Events. In addition we use several real data sets called Sensor,2 Forest Cover Type3 and the KDD CUP’99 data4 which are often used for com-paring data stream clustering algorithms.
© 2017, IRJET | Impact Factor value: 5.181 | ISO 9001:2008 Certified Journal | Page 445
number of clusters and thus makes comparison of clustering’s with a different number of clusters invalid. The within cluster sum of squares favors algorithms which produce spherical clusters (e.g., k-means-type algorithms). A smaller WSS represent tighter clusters and thus a better clustering. However, WSS always will get smaller with an increasing number of clusters. We report these measures here for comparison since they are used in many data stream clustering papers.
7] CONCLUSION
In this paper, we have developed the first data stream clustering algorithm which explicitly records the density in the area shared by micro-clusters and uses this information for reclustering. We have introduced the shared density graph together with the algorithms needed to maintain the graph in the online component of a data stream mining algorithm. Although, we showed that the worst-case memory requirements of the shared density graph grow extremely fast with data dimensionality, complexity analysis and experiments reveal that the procedure can be effectively applied to data sets of moderate dimensionality.
Experiments also show that shared-density reclustering already performs extremely well when the online data stream clustering component is set to produce a small number of large MCs. Other popular reclustering strategies can only slightly improve over the results of shared density reclustering and need significantly more MCs to achieve comparable results. This is an important advantage since it implies that we can tune the online component to produce less micro-clusters for shared-density reclustering. This improves performance and, in many cases, the saved memory more than offset the memory
requirement for the shared density graph.
9] REFERENCES
[1] S. Guha, N. Mishra, R. Motwani, and L. O’Callaghan, “Clustering data streams,” in Proc. ACM Symp. Found. Comput. Sci., 12–14 Nov. 2000, pp. 359–366.
[2] C. Aggarwal, Data Streams: Models and Algorithms, (series Advances in Database Systems). New York, NY, USA: Springer-Verlag, 2007.
[3] J. Gama, Knowledge Discovery from Data Streams, 1st ed. London, U.K.: Chapman & Hall, 2010.
[4] J. A. Silva, E. R. Faria, R. C. Barros, E. R. Hruschka, A. C. P. L. F. d. Carvalho, and J. A. Gama, “Data stream clustering: A survey,” ACM Comput. Surveys, vol. 46, no. 1, pp. 13:1–13:31, Jul. 2013. [5] C. C. Aggarwal, J. Han, J. Wang, and P. S. Yu, “A
framework for clustering evolving data streams,” in Proc. Int. Conf. Very Large Data Bases, 2003, pp. 81–92.
[6] F. Cao, M. Ester, W. Qian, and A. Zhou, “Density-based clustering over an evolving data stream with noise,” in Proc. SIAM Int. Conf. Data Mining, 2006, pp. 328–339.
[7] Y. Chen and L. Tu, “Density-based clustering for real-time stream data,” in Proc. 13th ACM SIGKDD Int. Conf. Knowl. Discovery Data Mining, 2007, pp. 133–142.
[8] L. Wan, W. K. Ng, X. H. Dang, P. S. Yu, and K. Zhang, “Density-based clustering of data streams at multiple reso-lutions,” ACM Trans. Knowl. Discovery from Data, vol. 3, no. 3,
pp. 1–28, 2009.
Dure Supriya Suresh
ME(Student), ICOER ,Wagholi , Pune ,Maharastra,India 1’st