diagnostic test of operational tolerance in liver
transplant recipients
Marc Martínez-Llordella, … , Antoni Rimola, Alberto
Sánchez-Fueyo
J Clin Invest.
2008;
118(8)
:2845-2857.
https://doi.org/10.1172/JCI35342
.
A fraction of liver transplant recipients are able to discontinue all immunosuppressive
therapies without rejecting their grafts and are said to be operationally tolerant to the
transplant. However, accurate identification of these recipients remains a challenge. To
design a clinically applicable molecular test of operational tolerance in liver transplantation,
we studied transcriptional patterns in the peripheral blood of 80 liver transplant recipients
and 16 nontransplanted healthy individuals by employing oligonucleotide microarrays and
quantitative real-time PCR. This resulted in the discovery and validation of several gene
signatures comprising a modest number of genes capable of identifying tolerant and
nontolerant recipients with high accuracy. Multiple peripheral blood lymphocyte subsets
contributed to the tolerance-associated transcriptional patterns, although NK and gdTCR
+T
cells exerted the predominant influence. These data suggest that transcriptional profiling of
peripheral blood can be employed to identify liver transplant recipients who can discontinue
immunosuppressive therapy and that innate immune cells are likely to play a major role in
the maintenance of operational tolerance in liver transplantation.
Research Article
Transplantation
Find the latest version:
Using transcriptional profiling to develop
a diagnostic test of operational tolerance
in liver transplant recipients
Marc Martínez-Llordella,1 Juan José Lozano,1 Isabel Puig-Pey,1 Giuseppe Orlando,2 Giuseppe Tisone,2 Jan Lerut,3 Carlos Benítez,1 Jose Antonio Pons,4 Pascual Parrilla,4
Pablo Ramírez,4 Miquel Bruguera,1 Antoni Rimola,1 and Alberto Sánchez-Fueyo1
1Liver Transplant Unit, Hospital Clinic Barcelona, Institut d’Investigacions Biomèdiques August Pi i Sunyer (IDIBAPS), Centro de Investigación Biomédica en Red de Enfermedades Hepáticas y Digestivas (CIBEREHD), Barcelona, Spain. 2Liver Transplant Unit, Surgical Clinic, University of Rome Tor Vergata, Rome, Italy. 3Abdominal Transplant Unit, Université Catholique de Louvain, Brussels, Belgium.
4Liver Transplant Unit, Virgen de la Arrixaca University Hospital, Murcia, Spain.
A fraction of liver transplant recipients are able to discontinue all immunosuppressive therapies without
rejecting their grafts and are said to be operationally tolerant to the transplant. However, accurate
identifica-tion of these recipients remains a challenge. To design a clinically applicable molecular test of operaidentifica-tional
tolerance in liver transplantation, we studied transcriptional patterns in the peripheral blood of 80 liver
trans-plant recipients and 16 nontranstrans-planted healthy individuals by employing oligonucleotide microarrays and
quantitative real-time PCR. This resulted in the discovery and validation of several gene signatures comprising
a modest number of genes capable of identifying tolerant and nontolerant recipients with high accuracy.
Mul-tiple peripheral blood lymphocyte subsets contributed to the tolerance-associated transcriptional patterns,
although NK and
γδ
TCR
+T cells exerted the predominant influence. These data suggest that transcriptional
profiling of peripheral blood can be employed to identify liver transplant recipients who can discontinue
immunosuppressive therapy and that innate immune cells are likely to play a major role in the maintenance
of operational tolerance in liver transplantation.
Introduction
Maintenance of a normal allograft function despite complete discontinuation of all immunosuppressive drugs is occasionally reported in clinical organ transplantation, particularly following liver transplantation (1–9). Patients spontaneously accepting their grafts are conventionally considered as “operationally” tolerant and provide a proof of concept that immunological tolerance can actually be attained in humans. We and others have documented differences in the phenotype and gene expression of PBMCs obtained from operationally tolerant liver recipients as compared with patients requiring ongoing pharmacological immunosup- pression (10–12). While these observations have provided valu-able information on the cellular and molecular basis of human operational tolerance, the translation of this information into a clinically applicable molecular diagnostic test capable of identify-ing tolerance remains a challenge. In the current study, we have employed gene-expression profiling technologies to construct and validate a series of genomic classifiers of operational toler-ance in liver transplantation. Thus, we have analyzed peripheral blood specimens from 38 adult liver transplant recipients employ-ing oligonucleotide microarrays and quantitative real-time PCR (qPCR) and have identified several predictive models containing
very low numbers of genes whose mRNA levels accurately identify operationally tolerant liver recipients. This genomic footprint of operational tolerance has been compared with gene-expression patterns obtained from healthy individuals, validated in an inde-pendent cohort of 23 additional liver recipients, and employed to estimate the prevalence of tolerance among stable liver transplant recipients receiving maintenance immunosuppressive drugs (STA recipients). In addition, the influence of potentially confounding clinical variables and specific PBMC subsets on tolerance-related gene signatures has been thoroughly assessed. Our data suggest that measurement of the expression of a modest number of genes in peripheral blood could constitute a robust noninvasive diagnos-tic test of operational tolerance in clinical liver transplantation.
Results
Candidate gene discovery and internal validation of microarray data. To assess differential gene expression between tolerant and nontol-erant recipients, oligonucleotide microarray experiments were conducted on PBMCs obtained from 17 tolerant liver transplant (TOL) and 21 nontolerant liver transplant (non-TOL) recipients (Table 1 and Figure 1). An initial comparative statistical analysis employing significant analysis of microarrays (SAM) yielded a total of 2,482 probes (corresponding to 1,932 genes and 147 expressed sequence tags) with a false discovery rate (FDR) of less than 5% (Figure 2). To identify the minimal set of genes capable of predict-ing the tolerant state, predictive analysis of microarrays (PAM) was performed in parallel on the same 2 groups of samples, resulting in the identification of a subset of 26 probes corresponding to 24 genes (all of them present in the SAM list; Figure 3A) capable of correctly classifying tolerant recipients, with an overall error rate
Nonstandard abbreviations used: CONT, control nontransplanted healthy indi-viduals; FDR, false discovery rate; MiPP, misclassified penalized posterior probability algorithm; non-TOL, nontolerant liver transplant (recipient); PAM, predictive analy-sis of microarrays; qPCR, quantitative real-time PCR; SAM, significant analysis of microarrays; STA, stable liver transplant (recipient) under maintenance immunosup-pressive therapy; TOL, tolerant liver transplant (recipient).
Conflict of interest: The authors have declared that no conflict of interest exists.
of 0.026 (sensitivity, 1; specificity, 0.944). Multidimensional scal- ing analysis was then performed to visually represent the proxim- ity between TOL and non-TOL samples according to the expres-sion of the 26 probes. As depicted in Figure 3B, TOL and non-TOL samples appeared as 2 clearly separated groups. Overall, analysis of microarray-derived expression data results in the identification of a genetic classifier that exhibits high accuracy in discriminating TOL from non-TOL samples.
Prediction of tolerance in STA recipients under maintenance immu-nosuppression employing microarray expression data. To estimate the proportion of potentially tolerant individuals among STA recipi-ents and thus externally validate the tolerance-related 26-probe microarray signature, we employed PAM to classify a cohort of 19 STA patients under maintenance immunosuppressive therapy into TOL and non-TOL categories. Tolerance was predicted in 26% of cases. This rate ranged from 21% to 31% when 3 other prediction algorithms, namely supervector machine learning using the ker-nel radial basis function (SVM-rbf) or linear kernel (SVM-lin), and
K -nearest neighbors, were employed (data not shown). This esti-mation is concordant with the rate of successful weaning we have observed in similarly selected STA recipients (5, 8). Furthermore, STA recipients identified as tolerant based on microarray expres-sion patterns exhibited a higher proportion of peripheral blood Vδ1TCR+ T cells and Vδ1/Vδ2 T cell ratios than those identified as nontolerant recipients (Figure 4A), which is in agreement with 2 previous immunophenotyping studies (10, 11). Multidimen-sional scaling was next employed to plot TOL, non-TOL, and STA samples together based on the PAM-derived microarray expression signature. Notably, STA samples were grouped together with TOL or non-TOL samples in concordance with their predicted clinical phenotype (Figure 4B).
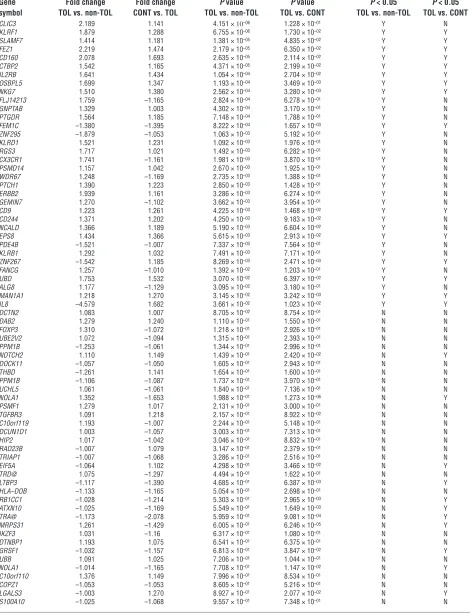
Validation of microarray expression data by qPCR. We employed qPCR to confirm the expression of the target genes identified by microarrays and to compare the expression measurements obtained from liver recipients with those from nontransplanted healthy individuals (CONT). Selected target genes for qPCR experiments included the 24 genes selected by PAM, 44 genes selected among those most highly ranked in the SAM-derived gene list, and 6 genes
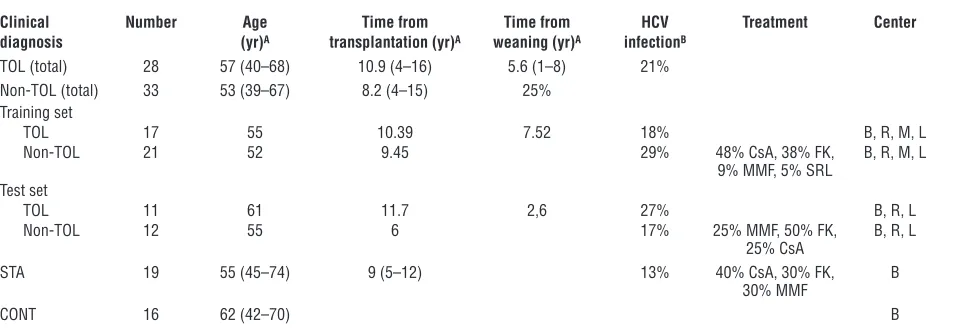
(UBD, HLA-DOB, FOXP3, LTBP3, MAN1A1, LGALS3) previously reported to be associated with allograft tolerance (Table 2). Periph- eral blood samples from 16 TOL, 15 non-TOL, and 16 CONT indi-viduals were employed for these experiments. TOL and non-TOL samples differed in the expression of 34 genes (Table 3 and Fig-ure 5A). Thirty genes were differentially expressed when assessed by microarrays but not by qPCR. Among these, PCR primers and microarrayprobes did not recognize the same transcripts in 11 cases. Hence, qPCR could confirm the differential expression of 64% of the genes selected by microarrays. The reproducibility of qPCR expression values was assessed by computing interpatient and interassay variation. Interpatient variation (median SD of ΔCt = 0.68) greatly exceeded interassay variation (median SD of ΔCt = 0.21). This suggests that the variability of the qPCR is small enough to reliably detect differences in gene expression between TOL and non-TOL recipients. Although target genes had been selected on account of their differential expression between TOL and non-TOL samples, there were 26 genes differentially expressed between TOL and CONT samples as well (Table 3 and Figure 5A). The similarities between TOL, non-TOL, and CONT expression patterns were then assessed in an unsupervised manner through multidimensional scaling analysis. This resulted in CONT samples being clustered in between TOL and non-TOL groups (Figure 5B). Taken together, qPCR expression results confirmed the validity of most genes identified by microarrays and revealed that tolerance-related expression patterns differ from those of both non-TOL recipients and nontransplanted healthy individuals. Expression patterns of TOL recipients, however, appear to be closer to those of healthy individuals than to those of non-TOL recipients.
Prediction of tolerance in an independent validation test employing qPCR-derived gene models. Among the candidate biomarkers identified in qPCR experiments on the basis of their differential expression between TOL and non-TOL samples, we searched for those that would form optimal parsimonious models capable of predicting tolerance status in an independent validation set. This was accom-plished by utilizing a novel classification modeling approach based on the misclassified penalized posterior (MiPP) algorithm and incorporating an independent cohort of 11 TOL and 12 non-Table 1
Demographic characteristics of patient groups
Clinical Number Age Time from Time from HCV Treatment Center
diagnosis (yr)A transplantation (yr)A weaning (yr)A infectionB
TOL (total) 28 57 (40–68) 10.9 (4–16) 5.6 (1–8) 21% Non-TOL (total) 33 53 (39–67) 8.2 (4–15) 25%
Training set
TOL 17 55 10.39 7.52 18% B, R, M, L
Non-TOL 21 52 9.45 29% 48% CsA, 38% FK, B, R, M, L
9% MMF, 5% SRL
Test set
TOL 11 61 11.7 2,6 27% B, R, L
Non-TOL 12 55 6 17% 25% MMF, 50% FK, B, R, L
25% CsA
STA 19 55 (45–74) 9 (5–12) 13% 40% CsA, 30% FK, B
30% MMF
CONT 16 62 (42–70) B
AMean (range). BMean. CsA, cyclosporine A; FK, tacrolimus; MMF, mycophenolate mophetil; SRL, sirolimus; B, Hospital Clinic Barcelona; R, University “Tor
[image:3.585.54.537.111.278.2]TOL recipients not previously employed for data analysis and from whom no microarray data were available. MiPP selected 3 signatures of 2, 6, and 7 genes (altogether comprising 12 different genes), and these signatures were capable of correctly classifying samples included in both the training and validation sets (Table 3). These experiments indicate that qPCR can be employed on periph- eral blood samples to derive robust, reproducible, and highly accu-rate gene models of liver operational tolerance.
Identification of clinical variables implicated in the tolerance-associated gene signature. We performed globaltest to assess the influence of age, sex, type of immunosuppression, time from transplanta- tion, peripheral blood leukocyte counts, and HCV infection sta-tus on peripheral blood microarray gene-expression patterns. No significant correlation was found between the tolerance-related expression profile and patient age, sex, pharmacological immu-nosuppression, and peripheral blood lymphocyte, neutrophil, and monocyte numbers (data not shown). Time from transplan-tation was marginally associated with the PAM-derived 26-probe signature (P value < 0.042) but not with the 2,462-probe set iden-tified by SAM. HCV infection, in contrast, had a major impact
both on global gene-expression patterns and on the tolerance-related expression signatures (P < 0.0003 and P < 0.0033 for the 26- and the 2,462-probe sets, respectively). To further dissect the effects of HCV infection on gene-expression patterns following transplantation, we compared samples from chronically infected patients (HCV-positive) with those of noninfected (HCV-negative) recipients employing SAM. This resulted in the identification of 4,725 differentially expressed probes (FDR < 5%; data not shown). Further, we used SAM to compare TOL and non-TOL samples stratified on the basis of HCV infection status. HCV-negative TOL and non-TOL individuals differed in 117 probes, while 528 probes were differentially expressed between HCV-positive TOL and non-TOL recipients (FDR < 5%; Figure 6A). HCV infection was also found to influence the expression of 12 out of the 26 probes included in the PAM-derived microarray genetic classifier, although correlation was tighter with tolerance than with HCV infection (Figure 6B). This is concordant with our finding that the 26-probe set classifies TOL and non-TOL samples regardless of HCV infection status (Figure 3B). Thus, while HCV infection has a major influence on peripheral blood gene expression follow-Figure 1
[image:4.585.70.501.80.405.2]ing liver transplantation, this does not prevent accurate discrimi-nation between TOL and non-TOL recipients.
PBMC subsets involved in the tolerance-related gene-expression footprint. In a previous report (11), we investigated in detail the differences in PBMC subsets between TOL and non-TOL liver recipients (this report included 32 out of the 38 TOL and non-TOL recipients
[image:5.585.45.417.83.660.2]incorporated in our current microarray study). TOL recipients exhibited an increased number of CD4+CD25+Foxp3+, γδTCR+, and δ1TCR+ T cells. In contrast, no differences were observed in the frequency or absolute numbers of other T cell subsets, B, NK, and NKT cells (11). To determine the contribution of these PBMC subsets to tolerance-associated expression patterns, we employed
Figure 2
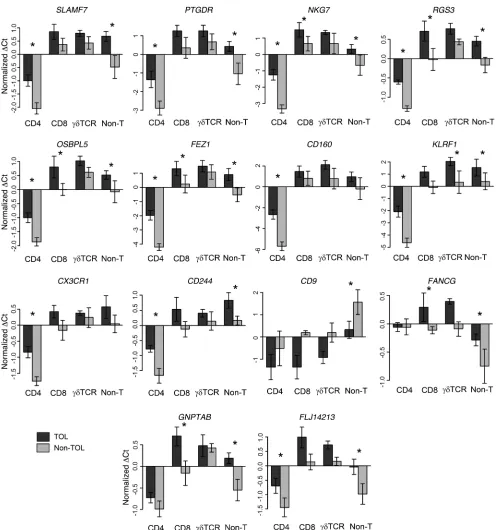
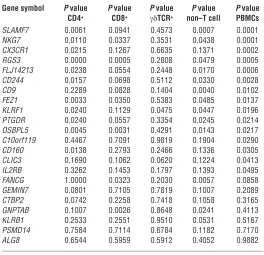
globaltest to correlate cell-subset frequencies with microarray-derived expression levels. All 57 patients from whom microarray data were available (including TOL, non-TOL, and STA recipients) were employed for this study. First, we computed the number of probes from the SAM-derived 2,482-probe list whose expression correlated with the frequency of each specific PBMC subset. NK, Vδ1TCR+, and total γδTCR+ T cells influenced 314, 296, and 438 probes, respectively, although statistical significance was only reached for NK (P < 0.0032) and γδTCR+ T cells (P < 0.0271). For comparison, a similar analysis was then conducted on the 4,725- probe list differentiating HCV-positive from HCV-negative sam-ples. This analysis identified CD8+ T cells as the lymphocyte subset influencing the greatest number of genes, although this did not reach statistical significance (328 probes; P < 0.14). NK, γδTCR+, and Vδ1TCR+ peripheral blood lymphocyte proportions also cor-related with the expression of multiple individual genes included in the PAM-derived 26-probe set (Figure 6C), although only
γδTCR+ T cell frequency was shown to be significantly associ-ated with the 26-probe set as a whole (P < 0.0154). The results of these analyses indicate that both NK and γδTCR+ T cells influence tolerance-associated peripheral blood expression patterns. Considering that TOL and non-TOL recipients dif-fer in the number of peripheral blood γδTCR+ T cells (11), it is clear that tolerance-related differential gene expression can be attributed, at least in part, to an increased number of γδTCR+ T cells in TOL recipients. Regarding NK cells, which are pres-ent in similar numbers in TOL and non-TOL recipients, we hypothesized that the significant correlation observed might be due to changes in their transcriptional program. To test this hypothesis and further assess the contribution of other PBMC subsets, we conducted qPCR experiments to measure the expression of the 22 most significant genes from Table 3 on cell subsets sorted from a selected group of 5 TOL and 5 non-TOL patients. The set of 22 genes was predominantly expressed by CD8+, γδTCR+, and non–T cell mononuclear cells (Figure 7 and Table 4). Comparison of TOL and non-TOL samples revealed significant expression differences in CD4+, CD8+, γδTCR+, and non–T cell subsets (Figure 7 and Table 4). In addition, protein levels of IL-2RB, KLRB1, CD244, CD9, KLRF1, CD160, and SLAMF7 were assessed by flow cytometry on CD4+, CD8+, γδTCR+ T, NK, CD19+, and NKT cells from 6 TOL, 6 non-TOL, and 5 healthy individuals. These proteins were mainly expressed on NK, NKT, and γδTCR+ T cells, with significant differences being noted between TOL, non-TOL, and CONT individuals (Supplemental Figure 1, A and B; supplemental material available online with this article; doi:10.1172/JCI35342DS1). These findings indicate that TOL and non-TOL recipients differ in the expression program of several PBMC subsets, mainly Vδ1TCR+ T cells and NK cells, and that in many cases these expression changes are unique to the tolerant state. Thus, tolerance-associated expression patterns appear to be shaped both by differences in γδTCR+ T cell number and by func-tional changes in a variety of PBMC subsets.
Discussion
[image:6.585.42.300.77.536.2]We have previously reported that gene-expression profiling employ-ing peripheral blood specimens and oligonucleotide microarrays constitutes a high-throughput approach to dissect the biology underlying operational tolerance in human liver transplantation (11). The current study was designed to determine whether this approach could be employed to identify genomic classifiers that would (a) comprise modest numbers of genes, (b) provide high diagnostic accuracy in the identification of tolerant recipients, and (c) yield reproducible results across different transcriptional
Figure 3
platforms. We first analyzed peripheral blood samples obtained from operationally tolerant liver recipients and from nontolerant recipients requiring maintenance immunosuppression employ-ing Affymetrix microarrays. The diagnostic applicability of the resulting 26-probe genetic classifier was tested on an indepen-dent cohort of 19 STA recipients. These patients were selected according to the clinical criteria most commonly used to enroll patients in immunosuppressive weaning trials (1) and are there- fore representative of the diversity of patients to whom a diagnos-tic test based on the identified gene signature would be applied if adopted for broad clinical use. Prediction of tolerance status based on the identified gene signature resulted in the identification of 4 of 19 potentially tolerant recipients (26%), which matches the prevalence of operational tolerance observed in patients selected according to the above clinical criteria (1, 5, 8). The most infor-mative genes selected in the microarray experiments were then validated on a qPCR platform. This resulted in the identification of 3 qPCR-derived composite models incorporating 2–7 genes exhibiting remarkable accuracy at discriminating TOL from non-TOL samples in both training and independent validation sets. qPCR experiments incorporated an additional group of samples collected from healthy nontransplanted individuals (CONT). This allowed comparison of TOL and CONT expression patterns. While tolerance-related expression signatures resembled CONT more than non-TOL patterns, half of the genes differentially expressed
between TOL and non-TOL samples were also significantly differ-ent when comparing TOL and CONT samples. This indicates that a substantial proportion of identified genetic classifiers are very likely to be tolerance specific.
[image:7.585.43.349.81.436.2]The potential impact on tolerance-related gene-expression pat-terns of clinical variables such as age, time from transplantation, type of immunosuppressive therapy, and HCV status was specifi-cally addressed on the microarray dataset. HCV infection had a striking impact on peripheral blood gene-expression patterns, markedly outweighing the effect of tolerance itself in terms of the number of genes influenced. The effect of HCV infection on the set of genes most strongly associated with tolerance was, however, weak, which explains why the 26-probe microarray signature could correctly identify tolerant recipients regardless of HCV-infection status. Time from transplantation was found to be marginally associated with the PAM-derived 26-probe signature. This is con-cordant with the clinical observation that liver recipients with a longer posttransplant follow-up are more likely to become opera- tionally tolerant (1) but clearly does not account for the expres-sion differences between TOL and non-TOL recipients detected in our study population. A significant effect of pharmacological immunosuppression on tolerance-related gene-expression pat- terns was excluded by the negative result of the globaltest asso-ciation analysis and by our finding that STA recipients predicted to be tolerant were grouped together with TOL recipients, which suggests that a common expression signature prevails regardless of the use of immunosuppressive drugs. Hence, we provide here
Figure 4
Estimation of potentially tolerant individuals among STA recipients. (A) STA recipients classified as tol-erant (STA-Affy TOL) exhibit higher levels of Vδ1 TCR+ T cells and Vδ1/Vδ2 T cell ratios than either
Table 2
Results of qPCR gene-expression experiments
Gene Fold change Fold change P value P value P < 0.05 P < 0.05 symbol TOL vs. non-TOL CONT vs. TOL TOL vs. non-TOL TOL vs. CONT TOL vs. non-TOL TOL vs. CONT
CLIC3 2.189 1.141 4.151 × 10–06 1.228 × 10–01 Y N
KLRF1 1.879 1.288 6.755 × 10–06 1.730 × 10–02 Y Y
SLAMF7 1.414 1.181 1.381 × 10–05 4.835 × 10–02 Y Y
FEZ1 2.219 1.474 2.179 × 10–05 6.350 × 10–02 Y Y
CD160 2.078 1.693 2.635 × 10–05 2.114 × 10–02 Y Y
CTBP2 1.542 1.165 4.371 × 10–05 2.199 × 10–02 Y Y
IL2RB 1.641 1.434 1.054 × 10–04 2.704 × 10–02 Y Y
OSBPL5 1.699 1.347 1.193 × 10–04 3.469 × 10–03 Y Y
NKG7 1.510 1.380 2.562 × 10–04 3.280 × 10–03 Y Y
FLJ14213 1.759 –1.165 2.824 × 10–04 6.278 × 10–01 Y N
GNPTAB 1.329 1.003 4.302 × 10–04 3.170 × 10–01 Y N
PTGDR 1.564 1.185 7.148 × 10–04 1.788 × 10–01 Y N
FEM1C –1.380 –1.395 8.222 × 10–04 1.657 × 10–03 Y Y
ZNF295 –1.879 –1.053 1.063 × 10–03 5.192 × 10–01 Y N
KLRD1 1.521 1.231 1.092 × 10–03 1.976 × 10–01 Y N
RGS3 1.717 1.021 1.492 × 10–03 6.282 × 10–01 Y N
CX3CR1 1.741 –1.161 1.981 × 10–03 3.870 × 10–01 Y N
PSMD14 1.157 1.042 2.670 × 10–03 1.925 × 10–01 Y N
WDR67 1.248 –1.169 2.735 × 10–03 1.388 × 10–01 Y N
PTCH1 1.390 1.223 2.850 × 10–03 1.428 × 10–01 Y N
ERBB2 1.939 1.161 3.286 × 10–03 6.274 × 10–01 Y N
GEMIN7 1.270 –1.102 3.662 × 10–03 3.954 × 10–01 Y N
CD9 1.223 1.261 4.225 × 10–03 1.468 × 10–02 Y Y
CD244 1.371 1.202 4.250 × 10–03 9.183 × 10–02 Y N
NCALD 1.366 1.189 5.190 × 10–03 6.604 × 10–02 Y N
EPS8 1.434 1.366 5.615 × 10–03 2.913 × 10–02 Y Y
PDE4B –1.521 –1.007 7.337 × 10–03 7.564 × 10–01 Y N
KLRB1 1.292 1.032 7.491 × 10–03 7.171 × 10–01 Y N
ZNF267 –1.542 1.185 8.269 × 10–03 2.471 × 10–03 Y Y
FANCG 1.257 –1.010 1.392 × 10–02 1.203 × 10–01 Y N
UBD 1.753 1.532 3.070 × 10–02 6.397 × 10–02 Y Y
ALG8 1.177 –1.129 3.095 × 10–02 3.180 × 10–01 Y N
MAN1A1 1.218 1.270 3.145 × 10–02 3.242 × 10–03 Y Y
IL8 –4.579 1.682 3.661 × 10–02 1.023 × 10–02 Y Y
DCTN2 1.083 1.007 8.705 × 10–02 8.754 × 10–01 N N
DAB2 1.279 1.240 1.110 × 10–01 1.550 × 10–01 N N
FOXP3 1.310 –1.072 1.218 × 10–01 2.926 × 10–01 N N
UBE2V2 1.072 –1.094 1.315 × 10–01 2.393 × 10–01 N N
PPM1B –1.253 –1.061 1.344 × 10–01 2.996 × 10–01 N N
NOTCH2 1.110 1.149 1.439 × 10–01 2.420 × 10–02 N Y
DOCK11 –1.057 –1.050 1.605 × 10–01 2.943 × 10–01 N N
THBD –1.261 1.141 1.654 × 10–01 1.600 × 10–01 N N
PPM1B –1.106 –1.087 1.737 × 10–01 3.970 × 10–01 N N
UCHL5 1.061 –1.061 1.840 × 10–01 7.136 × 10–01 N N
NOLA1 1.352 –1.653 1.988 × 10–01 1.273 × 10–06 N Y
PSMF1 1.279 1.017 2.131 × 10–01 3.000 × 10–01 N N
TGFBR3 1.091 1.218 2.157 × 10–01 8.922 × 10–02 N N
C10orf119 1.193 –1.007 2.244 × 10–01 5.148 × 10–01 N N
DCUN1D1 1.003 –1.057 3.003 × 10–01 7.313 × 10–01 N N
HIP2 1.017 –1.042 3.046 × 10–01 8.832 × 10–01 N N
RAD23B –1.007 1.079 3.147 × 10–01 2.379 × 10–01 N N
TRIAP1 –1.007 –1.068 3.286 × 10–01 2.516 × 10–01 N N
EIF5A –1.064 1.102 4.298 × 10–01 3.466 × 10–02 N Y
TRD@ 1.075 –1.297 4.494 × 10–01 1.622 × 10–01 N N
LTBP3 –1.117 –1.390 4.685 × 10–01 6.387 × 10–03 N Y
HLA–DOB –1.133 –1.165 5.054 × 10–01 2.698 × 10–01 N N
RB1CC1 –1.028 –1.214 5.303 × 10–01 2.965 × 10–03 N Y
ATXN10 –1.025 –1.169 5.549 × 10–01 1.649 × 10–03 N Y
TRA@ –1.173 –2.078 5.959 × 10–01 9.081 × 10–04 N Y
MRPS31 1.261 –1.429 6.005 × 10–01 6.246 × 10–05 N Y
IKZF3 1.031 –1.16 6.317 × 10–01 1.080 × 10–01 N N
DTNBP1 1.193 1.075 6.541 × 10–01 6.375 × 10–01 N N
GRSF1 –1.032 –1.157 6.813 × 10–01 3.847 × 10–02 N Y
UBB 1.091 1.025 7.206 × 10–01 1.044 × 10–01 N N
NOLA1 –1.014 –1.165 7.708 × 10–01 1.147 × 10–02 N Y
C10orf110 1.376 1.149 7.996 × 10–01 8.534 × 10–01 N N
COPZ1 –1.053 –1.053 8.605 × 10–01 5.216 × 10–01 N N
LGALS3 –1.003 1.270 8.927 × 10–01 2.077 × 10–02 N Y
S100A10 –1.025 –1.068 9.557 × 10–01 7.348 × 10–01 N N
a series of robust predictive models containing a strikingly small number of features capable of accurately discriminating between operationally tolerant liver recipients and those requiring ongoing pharmacological immunosuppression on the basis of peripheral blood gene-expression patterns.
The underlying biology of operational tolerance in humans is still largely unknown. In the current work we have conducted a
whole genome gene-set analysis to gain unbiased insight into the mechanisms of operational tolerance following liver transplanta-tion (see Supplemental Data). This analysis has revealed that the expression signature associated with operational liver allograft tol-erance is mainly characterized by enrichment in genes encoding for a variety of NK cell–surface receptors expressed by NK, CD8+, and γδTCR+ T cells. The influence of NK and γδTCR+ T cells on toler-Table 3
Most predictive genetic classifiers identified by MiPP in qPCR expression data set and their performance in training and independent test sets
Gene signatures Selection Prediction rule Class Mean ER Mean ER in
method comparison in training set validation set
KLRF1, SLAMF7 MiPP LDA, QDA, SVM-rbf 2 class 0.064 0.13
KLRF1, NKG7, IL2RB, KLRB1, FANCG, GNPTAB MiPP SVM-rbf 2 class 0.032 0.17
SLAMF7, KLRF1, CLIC3, PSMD14, ALG8, CX3CR1, RGS3 MiPP SVM-lin 2 class 0.064 0.13
[image:9.585.56.530.113.173.2]ER, overall error rate; LDA, lineal discriminant analysis; QDA, quadratic discriminant analysis; SVM-lin, supervector machine with lineal function as kernel; SVM-rbf, supervector machine with radial basis function.
Figure 5
[image:9.585.50.541.313.651.2]ance-related expression patterns has been further confirmed by the demonstration of a significant association between the expression levels of the most informative genes and peripheral blood NK and γδTCR+ T cell frequencies and by the finding that, in TOL recipi-ents, both γδTCR+ and NK cells (together with other PBMC sub-sets) exhibit unique expression markers. There are 2 main γδTCR+ T cell subsets in human peripheral blood: Vδ1 and Vδ2. In healthy individuals, Vδ2TCR+ T cells largely predominate in peripheral blood (>80%), while Vδ1TCR+ T cells are the major subtype in tis- sues such as intestine, liver, and spleen (13). In operationally toler-ant liver recipients, in contrast, peripheral blood Vδ1TCR+ T cells expand and typically outnumber Vδ2TCR+ T cells (10, 11). Our
current analysis indicates that Vδ1TCR+ T cells are the only γδTCR+ T cell subset clearly influencing tolerance-related transcriptional signatures. In addition, we provide evidence that peripheral blood Vδ1TCR+ T cells from tolerant liver recipients exhibit unique expression and cell-surface traits that distinguish them from those present in either nontolerant recipients or nontransplanted healthy individuals. Vδ1TCR+ T cells have been reported to exert immunoregulatory functions in a variety of nontransplantation experimental and clinical settings (14–19). In liver transplantation, further studies are needed to dissect the functional properties of Vδ1TCR+ T cells and to determine whether these cells have direct suppressive abilities on alloaggressive lymphocytes or act by pro-Figure 6
[image:10.585.76.516.82.498.2]ducing growth factors and repairing tissue damage, as has been shown for the intestinal mucosa (18, 20–22).
On the basis of gene expression and flow cytometry data pre-sented here, it is clear that tolerant liver recipients are distinct not only from recipients requiring maintenance immunosuppression
[image:11.585.46.542.79.609.2]but also from nontransplanted healthy individuals. This suggests that in liver transplantation, achievement of operational toler-ance is unlikely to be due to a “reinitialization” of the immune system resulting in recognition of the transplanted graft as “self.” On the contrary, tolerant liver recipients appear to have developed Figure 7
Quantitative expression of the 22 most informative genes as assessed by qPCR in sorted peripheral blood lymphocytes. Relative expression of the 22 genes discriminating TOL from non-TOL samples in sorted CD4+, CD8+, γδTCR+ T cells, and non–T mononuclear cells obtained from 5
tolerogenic pathways not readily detectable in peripheral blood of healthy individuals but capable of ensuring the protection of the liver allograft.
Functional profiling of human kidney allograft tolerance employing peripheral blood samples has been previously reported by Brouard et al. (23) utilizing a 2-color cDNA microarray platform (lymphochip) mainly containing immune-related genes (24). While it would be critical to find common features between operationally tolerant kidney and liver recipients, comparison of both studies is problematic. First, the 2 array platforms employed (lymphochip and Affymetrix U133 Plus 2.0 arrays) have only 4,733 probes in common, with just 543 of them being present in the SAM-derived 2,482-gene list discriminating between TOL and non-TOL liver recipients (data obtained employing the MatchMiner tool; ref. 25). This number is very low for detailed evaluation of genome-wide transcriptional similitudes, particularly when comparing 2 distant clinical settings and utilizing 2 different expression platforms. Second, the 2 studies analyze different patient groups (i.e., our study is focused on identifying tolerant individuals among STA recipients while Brouard et al. compare tolerant kidney recipients with chronic rejectors). Despite these limitations, a comparison restricted to functional pathway profiles suggests that the mecha- nisms accounting for operational tolerance in liver transplan-tation are distinct from those active in kidney recipients. Thus, operationally tolerant kidney recipients appear to be character- ized by a state of immune quiescence with marked downregula-tion of genes involved in lymphocyte trafficking and activation and upregulation of genes responsible for cell-cycle control (23). In contrast, in operationally tolerant liver recipients, there is a mani-fest influence on expression patterns of cellular components of the innate immune cells while changes in proinflammatory pathways are barely noticeable except for HCV-positive recipients. Furthermore, a role for B cells in liver allograft toler-ance is not supported by either immunophenotyping or gene expression data, in contrast to what has been reported in kidney transplantation (26, 27). In short, our study reveals that measurement of the expression levels of a small set of genes in peripheral blood could be useful to accurately identify liver recipi-ents who are able to accept their grafts in the absence of pharmacological immunosuppression. Validation of our findings in prospective immunosuppression wean- ing trials would open the door to the possibility of with-drawing immunosuppressive drugs in recipients with high likelihood of being tolerant. Further, functional analysis of expression patterns suggests that molecular pathways involved in the activation and effector func-tion of innate immunity cell types (NK and γδTCR+ T cells) are central to the maintenance of operational tolerance following liver transplantation. Altogether, our work highlights the value of peripheral blood tran-scriptional profiling in the immune monitoring of liver transplant recipients and provides insight into the pathogenesis of human allograft tolerance. Methods Patients. Peripheral blood samples were collected from a cohort of 28 TOL recipients and 33 liver recipients in whom drug weaning was attempted but led to acute rejection, requir-ing reintroduction of immunosuppressive drugs (non-TOL). TOL recipients had been intentionally weaned from immunosuppressive therapy under medical supervision. Criteria employed in selecting patients for immunosuppression weaning in the participating institutions were as follows: (a) more than 3 years after transplantation; (b) single-drug immu-nosuppression; (c) absence of acute rejection episodes in the previous 12 months; (d) absence of signs of acute/chronic rejection in liver histology; and (e) absence of autoimmune liver disease before or after transplantation. In TOL recipients, blood was collected more than 1 year after successful immunosuppressive drug discontinuation, while in non-TOL recipients, specimens were harvested more than 1 year after complete resolution of the acute rejection episode (at the time of blood collection, all non-TOL recipients had normalized liver function tests and were receiving low-dose immunosuppression in monotherapy). Additionally, peripheral blood sam-ples were also obtained from 16 age-matched healthy controls (CONT) and 19 STA recipients that fulfilled the aforementioned clinical criteria for drug weaning. In patients fulfilling these criteria, the prevalence of operational tolerance ranges between 20% and 30% (5, 8). Clinical and demographic characteristics of patients included in the study are summarized in Table 1. The study was accepted by the Institutional Review Boards of all partici-pating institutions, and informed consent was obtained from all patients. A report containing blood-cell immunophenotyping findings together with preliminary microarray gene expression data obtained from a subset of the patients enrolled in the current study has been recently published (11).
[image:12.585.52.316.126.381.2]Microarray experiments. Microarray experiments were conducted on PBMCs obtained from 21 non-TOL, 17 TOL, and 19 STA recipients. PBMCs were isolated employing a Ficoll-Hypaque layer (Amersham Biosciences), total RNA was extracted with TRIzol reagent (Life Technologies), and the derived cRNA samples were hybridized onto AffymetrixHuman Genome U133 Plus 2.0 arrays containing 54,675 probes for 47,000 transcripts (Affymetrix). Sample handling and RNA extraction were performed by the same investi-gator in all cases (M. Martínez-Llordella). Table 4
Statistical significance of the differences in gene expression between TOL and non-TOL recipients in sorted lymphocyte subset.
Gene symbol P value P value P value P value P value CD4+ CD8+ γδTCR+ non–T cell PBMCs
SLAMF7 0.0061 0.0941 0.4573 0.0007 0.0001
NKG7 0.0110 0.0337 0.3531 0.0438 0.0001
CX3CR1 0.0215 0.1267 0.6635 0.1371 0.0002
RGS3 0.0000 0.0005 0.2808 0.0479 0.0005
FLJ14213 0.0238 0.0554 0.2448 0.0170 0.0006
CD244 0.0157 0.0698 0.5112 0.0330 0.0028
CD9 0.2289 0.0828 0.1404 0.0040 0.0102
FEZ1 0.0033 0.0350 0.5383 0.0485 0.0137
KLRF1 0.0240 0.1129 0.0475 0.0447 0.0196
PTGDR 0.0240 0.0557 0.3354 0.0245 0.0214
OSBPL5 0.0045 0.0031 0.4291 0.0143 0.0217
C10orf119 0.4467 0.7091 0.9819 0.1904 0.0290
CD160 0.0138 0.2793 0.2466 0.1336 0.0305
CLIC3 0.1690 0.1062 0.0620 0.1224 0.0413
IL2RB 0.3262 0.1453 0.1797 0.1393 0.0495
FANCG 1.0000 0.0323 0.2030 0.0057 0.0858
GEMIN7 0.0801 0.7105 0.7819 0.1007 0.2089
CTBP2 0.0742 0.2258 0.7418 0.1058 0.3165
GNPTAB 0.1007 0.0026 0.8648 0.0241 0.4113
KLRB1 0.2533 0.2551 0.9510 0.0531 0.5167
PSMD14 0.7584 0.7114 0.6784 0.1182 0.7170
ALG8 0.6544 0.5959 0.5912 0.4052 0.9882
Microarray data normalization . Microarray data from 57 samples (21 non-TOL, 17 TOL, and 19 STA) were normalized using the guanidine-cytosine content-adjusted robust multiarray algorithm, which computes expression values from probe-intensity values incorporating probe-sequence informa-tion (28). Next, we employed a conservative probe-filtering step excluding those probes not reaching a log2 expression value of 5 in at least 1 sample,
which resulted in the selection of a total of 23,782 probes out of the origi-nal 54,675 set. In order to eliminate nonbiological experimental variation or batch effects observed across successive batches of microarray experi-ments, we applied ComBat approach, which uses nonparametric empirical Bayes frameworks for data adjustment (29).
Differential expression assessment and prediction. An outline of the study design is depicted in Figure 1. We first used SAM (30) to identify genes differentially expressed between the TOL and non-TOL groups (17 and 21 samples, respectively) within the filtered 23,782-probe set. SAM uses modified t test statistics for each gene of a dataset and a fudge factor to compute the t value, thereby controlling for unrealistically low standard deviations for each gene. Furthermore, SAM allows control of the FDR by selecting a threshold for the difference between the actual test result and the result obtained from repeated permutations of the tested groups. For the current study, we employed SAM selection using FDR of less than 5% and 1,000 permutations on 3 comparison groups: TOL versusnon-TOL, TOL HCV-positive versusnon-TOL HCV-positive, and TOL HCV-negative versusnon-TOL HCV-negative. Differential gene expression was further explored by using the nearest shrunken centroid classifier implemented in the PAM (31) package to identify within the 23,782-probe set the minimal set of genes capable of predicting the tolerant state with an overall error rate of less than 5%. This method incorporates an internal cross-validation step during feature selection in which the model is fit on 90% of the sam-ples and then the class of the remaining 10% is predicted. This procedure is repeated 10 times to compute the overall error (10-fold cross-validation). The PAM classifier was then used on the 38-sample set to perform mul-tidimensional scaling analysis on the basis of between-sample Euclidean distances as implemented by the isoMDS function in R. This method is capable of visualizing high-dimensional data (such as multiple expression measurements) in a 3D graph in which the distances between samples are kept as unchanged as possible. Finally, the PAM classifier was employed to predict class in the set of 19 samples obtained from STA patients. Detailed information on the microarray expression dataset in available online (http://bioinfo.ciberehd.org/asf/).
Correlation of microarray data with clinical variables and PBMC subsets. The globaltest algorithm (32) from the Bioconductor package (http://bio-conductor.wustl.edu/BioC2.1/bioc/html/globaltest.html) was employed to determine whether potentially confounding clinical variables such as patient age, sex, time from transplantation, HCV status, immunosuppres-sive therapy (tacrolimus, cyclosporine A, or mycophenolate mophetil), and peripheral blood monocyte, lymphocyte, and neutrophil counts could be influencing gene-expression levels. The same strategy was employed to esti- mate the correlation between microarray expression data and the propor-tion of peripheral blood CD4+CD25+, CD4+Foxp3+, CD4+, CD8+, CD19+,
NKT, total γδTCR+, Vδ1TCR+, and Vδ2TCR+ T cells. Globaltest is a method
to determine whether the expression pattern of a prespecified group of genes is related to a clinical variable, which can be either a discrete variable or a continuous measurement. This test is based on an empirical Bayes-ian generalized linear model, where the regression coefficients between gene-expression data and clinical measurements are random variables. A goodness-of-fit test is applied on the basis of this model. The globaltest method computes a statistic Q and a P value to measure the influence of our group of genes on the clinical variable measured. For each probe, the influence (Q) in predicting measured clinical variable is estimated against
the expected value, and ranked among the probes under study. The weight of each probe is also assessed by the z-score considering the standard devia-tion of each probe in all samples used in the analysis.
qPCR experiments. The expression pattern of a group of 68 target genes and 4 housekeeping genes (18S, GUS, HPRT1, and GAPDH) was measured by qPCR employing the ABI 7900 Sequence Detection System and LDA microfluidic PCR cards (PE Applied Biosystems) on peripheral blood sam- ples obtained from 15 non-TOL, 16 TOL, and 16 CONT individuals. Select-ed target genes included the 24 genes identified by PAM, 44 genes selected among those most highly ranked in the SAM-derived gene list, and 6 genes (UBD, HLA-DOB, FOXP3, LTBP3, MAN1A1, LGALS3) selected on the basis of previous reports (11, 23, 26, 33, 34). To quantify the levels of mRNA, we normalized the expression of the target genes to the housekeeping gene
HPRT1 (which was found to be the most stably expressed gene among the 4 housekeeping genes selected) and presented the results as relative expres- sion between cDNA of the target samples and a calibrated sample accord-ing to the ΔCt method. All qPCR experiments were performed in duplicate. Total RNA was treated with DNAse reagent (Ambion; Applied Biosystems), and reverse transcription performed using Multiscribed Reverse Transcrip-tase Enzyme (PE Applied Biosystems). Results were analyzed employing standard 2-class unpaired t test. Reproducibility of gene expression mea-surements was assessed by comparing interpatient and interassay variation in a set of qPCR experiments that included 22 genes and samples from 16 recipients. For these experiments, 2 peripheral blood samples collected at 2 separated time points (mean, 57 days; range, 11–244 days) were employed. Interassay variation was defined as the variation between PCR runs car-ried out employing the 2 different peripheral blood samples from the same patient. To construct classification models containing a minimal set of features (genes) with the lowest possible classification error both in train-ing and independent test sets, we employed MiPP (35) on the 34 target genes differentially expressed between TOL and non-TOL samples (t test;
P < 0.05). MiPP is a recently developed method for assessing the perfor- mance of a prediction model that computes the sum of the posterior classi- fication probabilities penalized by the number of incorrectly classified sam-ples. The MiPP application performs an exhaustive search for gene models by sequentially selecting the most predictive genes and automatically removing the selected genes in subsequent runs. For our analysis, we con-ducted 10 sequential runs and employed all predictive algorithms included in the MiPP application (linear discriminant analysis, quadratic discrimi-nant analysis, support vector machine learning, and logistic regression). Internal computational validation was performed employing both 10-fold cross-validation and random-split validation (number of splits = 100). The composite models obtained were then employed to predict tolerance in the independent test set of 11 TOL and 12 non-TOL samples from which no microarray data were available. The 3 models with a lower classification error rate (in training set and test set) were selected.
Peripheral blood immunophenotyping. Flow cytometry immunophenotyping data from PBMCs obtained from 16 TOL and 16 non-TOL recipients have been reported elsewhere (11). In the current study, we assessed the propor-tion of CD4+CD25+, CD4+Foxp3+, total γδTCR+, δ1 γδTCR+, δ2 γδTCR+,
CD19+, NK, and NKT cell subsets on peripheral blood specimens obtained
from 19 STA recipients and from 1 TOL and 5 non-TOL recipients (from whom no previous data were available). Immunophenotyping results from all 57 recipients were employed to correlate PBMC subset frequencies with microarray expression data. Foxp3 fluorescent monoclonal antibodies were purchased from eBioscience. All remaining antibodies were purchased from BD Biosciences.
Peripheral blood cell sorting experiments. Positive selection of CD4+, CD8+,
and γδTCR+ T cell subsets from Ficoll-isolated PBMCs was performed
instructions. Purity of sorted cell populations was consistently greater than 90%. Total RNA was extracted from CD4+, CD8+, γδTCR+, and
non–T mononuclear cell subsets employing TRIzol reagent, and gene expression quantification was conducted employing qPCR as described. Peripheral blood samples from 5 TOL and 5 non-TOL patients were employed for these experiments. Statistics. Two-tailed Student’s t test was employed to compare qPCR gene expression levels and immunophenotyping data. Statistical signifi-cance was defined as P < 0.05.
Acknowledgments This work was supported by grants from the Ministerio de Edu-cación y Ciencia, Spain (SAF2004-00563 to A. Sánchez-Fueyo), and from the Ministerio de Sanidad/ISCIII, Spain(PI050367 to M. Bruguera). CIBEREHD is funded by the Instituto de Salud Carlos III (Spain). Received for publication February 14, 2008, and accepted in revised form June 11, 2008. Address correspondence to: Alberto Sánchez-Fueyo, Hospital Clín- ic Barcelona, Villarroel 170, Barcelona 08036, Spain. Phone: 34-93-2275499; Fax: 34-93-4515522; E-mail: [email protected]. M. Martínez-Llordella and J.J. Lozano contributed equally to this work and are co–first authors. 1. Lerut, J., and Sanchez-Fueyo, A. 2006. An appraisal of tolerance in liver transplantation. Am. J. Trans-plant. 6:1774–1780.
2. Starzl, T.E., et al. 1993. Cell migration and chime-rism after whole-organ transplantation: the basis of graft acceptance. Hepatology. 17:1127–1152. 3. Devlin, J., et al. 1998. Defining the outcome of
immunosuppression withdrawal after liver trans-plantation. Hepatology. 27:926–933.
4. Mazariegos, G.V., et al. 1997. Weaning of immu-nosuppression in liver transplant recipients. Trans-plantation. 63:243–249.
5. Pons, J.A., et al. 2003. Endothelial cell chimerism does not influence allograft tolerance in liver trans- plant patients after withdrawal of immunosup-pression. Transplantation. 75:1045–1047. 6. Eason, J.D., Cohen, A.J., Nair, S., Alcantera, T., and
Loss, G.E. 2005. Tolerance: is it worth the risk?
Transplantation. 79:1157–1159.
7. Takatsuki, M., et al. 2001. Weaning of immunosup-pression in living donor liver transplant recipients.
Transplantation. 72:449–454.
8. Tisone, G., et al. 2006. Complete weaning off immu-nosuppression in HCV liver transplant recipients is feasible and favourably impacts on the progression of disease recurrence. J. Hepatol. 44:702–709. 9. Tryphonopoulos, P., et al. 2005. The role of donor
bone marrow infusions in withdrawal of immuno-suppression in adult liver allotransplantation. Am. J. Transplant. 5:608–613.
10. Li, Y., et al. 2004. Analyses of peripheral blood mononuclear cells in operational tolerance after pediatric living donor liver transplantation. Am. J. Transplant. 4:2118–2125.
11. Martinez-Llordella, M., et al. 2007. Multi-parame-ter of immune profiling of operational tolerance in liver transplantation. Am. J. Transplant. 7:309–319. 12. Mazariegos, G.V., et al. 2003. Dendritic cell subset
ratio in peripheral blood correlates with successful withdrawal of immunosuppression in liver trans-plant patients. Am. J. Transplant. 3:689–696. 13. O’Brien, R.L., et al. 2007. gammadelta T-cell receptors:
functional correlations. Immunol. Rev. 215:77–88.
14. Kress, E., Hedges, J.F., and Jutila, M.A. 2006. Dis-tinct gene expression in human Vdelta1 and Vdelta2 gammadelta T cells following non-TCR agonist stimulation. Mol. Immunol. 43:2002–2011.
15. Fu, Y.X., et al. 1994. Immune protection and con-trol of inflammatory tissue necrosis by gamma delta T cells. J. Immunol. 153:3101–3115. 16. Girardi, M., et al. 2002. Resident skin-specific
gammadelta T cells provide local, nonredundant regulation of cutaneous inflammation. J. Exp. Med.
195:855–867.
17. Szereday, L., Barakonyi, A., Miko, E., Varga, P., and Szekeres-Bartho, J. 2003. Gamma/deltaT-cell sub-sets, NKG2A expression and apoptosis of Vdelta2+ T cells in pregnant women with or without risk of premature pregnancy termination. Am. J. Reprod. Immunol. 50:490–496.
18. Bhagat, G., et al. 2008. Small intestinal CD8+
TCRγδ+NKG2A+ intraepithelial lymphocytes have
attributes of regulatory cells in patients with celiac disease. J. Clin. Invest. 118:281–293.
19. Okabe, K., et al. 2001. CD45RC gammadelta T-cell infiltration is associated with immunologic unresponsiveness induced by prior donor-specific blood transfusion in rat hepatic allografts. Hepatol-ogy. 33:877–886.
20. Itohara, S., et al. 1990. Homing of a gamma delta thymocyte subset with homogeneous T-cell recep-tors to mucosal epithelia. Nature. 343:754–757.
21. Hayday, A., and Tigelaar, R. 2003. Immunoregula-tion in the tissues by gammadelta T cells. Nat. Rev. Immunol. 3:233–242.
22. Chen, Y., Chou, K., Fuchs, E., Havran, W.L., and Boismenu, R. 2002. Protection of the intestinal mucosa by intraepithelial gamma delta T cells.
Proc. Natl. Acad. Sci. U. S. A. 99:14338–14343.
23. Brouard, S., et al. 2007. Identification of a periph- eral blood transcriptional biomarker panel asso-ciated with operational renal allograft tolerance.
Proc. Natl. Acad. Sci. U. S. A. 104:15448–15453.
24. Alizadeh, A., et al. 1999. The lymphochip: a special- ized cDNA microarray for the genomic-scale analy-sis of gene expression in normal and malignant
lymphocytes. Cold Spring Harb. Symp. Quant. Biol.
64:71–78.
25. Bussey, K.J., et al. 2003. MatchMiner: a tool for batch navigation among gene and gene product identifiers. Genome Biol. 4:R27.
26. Louis, S., et al. 2006. Contrasting CD25hiCD4+T cells/FOXP3 patterns in chronic rejection and operational drug-free tolerance. Transplantation.
81:398–407.
27. Hernandez-Fuentes, M., et al. 2007. Biomarkers of tolerance in kidney transplants [abstract]. Am. J. Transplant. 7:340.
28. Wu, Z., Irizarri, R.A., Gentleman, R., Murillo, F.M., and Spencer, F. 2004. A model-based background adjustment for oligonucleotide expression arrays.
J. Am. Stat. Assoc. 99:909–917.
29. Johnson, W.E., Li, C., and Rabinovic, A. 2007. Adjusting batch effects in microarray expression data using empirical Bayes methods. Biostatistics.
8:118–127.
30. Tusher, V.G., Tibshirani, R., and Chu, G. 2001. Significance analysis of microarrays applied to the ionizing radiation response. Proc. Natl. Acad. Sci. U. S. A. 98:5116–5121.
31. Tibshirani, R., Hastie, T., Narasimhan, B., and Chu, G. 2002. Diagnosis of multiple cancer types by shrunken centroids of gene expression. Proc. Natl. Acad. Sci. U. S. A. 99:6567–6572.
32. Goeman, J.J., van de Geer, S.A., de Kort, F., and van Houwelingen, H.C. 2004. A global test for groups of genes: testing association with a clinical out-come. Bioinformatics. 20:93–99.
33. Sawitzki, B., et al. 2007. Identification of gene mark- ers for the prediction of allograft rejection or per-manent acceptance. Am. J. Transplant. 7:1091–1102. 34. Ocklenburg, F., et al. 2006. UBD, a downstream
element of FOXP3, allows the identification of LGALS3, a new marker of human regulatory T cells.
Lab. Invest. 86:724–737.