Intelligent Computing Method for the Interpretation of
Neuropsychiatric Diseases
Mohit Gangwar
Research Scholar Department of CSEMNNIT, Allahabad
R. B. Mishra
ProfessorDepartment of Computer Engineering IIT-BHU, Varanasi
R. S. Yadav
Professor Department of CSEMNNIT, Allahabad
ABSTRACT
Knowledge- based system (KBS) has been widely used in the detection and interpretation of EEG based neuropsychiatric diseases. Heuristic-based detection methods of EEG (Electroencephalography) parameters for a particular disease have been reported in the literature but little effort has been made by researchers to combine rule-based reasoning (RBR) and probabilistic method i.e Bayesian method. A combined method improves the computational and reasoning efficiency of the problem- solving strategy. We have hierarchically structured the neuropsychiatric diseases in terms of their physio-pyscho (physical, cognitive and psychological) parameters and EEG and FMRI (Functional magnetic resonance imaging) based parameters. RBR model use to create Bayesian network for each disease. The diseases considered are ADHD, Dementia, Mood Disorder, OCD and SI. The basic objective of this work is to develop an intelligent method of RBR and Bayesian model in which RBR is used to hierarchical correlate sign and symptom of the disease and also compute probabilities of diseases. Bayesian method is used for diagnosing the neuropsychiatric diseases and to find the probability of relative importance of sign and symptoms of diseases to other diseases.
Keywords
Neuropsychiatry, Bayesian Network, Probabilistic Model, Prior Probability, Intelligent Computing.
1. INTRODUCTION
Neuropsychiatry may be regarded as the application of the neurological paradigm to psychiatric syndromes[1]. It brings together the descriptive, nosological and therapeutic strengths of psychiatry, the empirical foundations of neurology and the assessment skills of neuropsychology to deal with these disorders[2]. Its sister discipline within neurology is Behavioral Neurology. To reflect our approach to neuropsychiatry in this paper, several general statements can be made about neuropsychiatry as follows: All types of behavioral disturbances that occur in psychiatric disorders can also occur in conjunction with neurological disorders. That psychiatric and neurological disorders are responsible for similar syndromes does not mean that the pathogenetic mechanisms are the same, but it is likely that there is significantly shared pathophysiology. A thorough diagnostic assessment from a general medical viewpoint is an essential part of any psychiatric assessment. Neuropsychiatric syndromes should commonly be suspected in the elderly, patients with brain damage or substance abuse, or if the syndrome is atypical, and family history and a vulnerable personality are lacking. Psychiatric treatments, physical or behavioral-psychotherapeutic, rely on intervention in brain
processes and are applicable to both neuropsychiatric and idiopathic psychiatric disorders.
A neuropsychiatric assessment is no more or less than a good psychiatric assessment and comprises of a psychiatric and medical history, A detailed mental state examination, including a cognitive examination, A physical examination, especially neurological, Neuropsychological assessment, and Laboratory investigations to evaluate general medical disorders and substance abuse, Including electrophysiology (EEG, ERPs) and neuroimaging (CT, MRI, SPECT, PET). This assessment differs from a general psychiatric assessment in its emphasis on the medical-neurological factors. In the history, an account from an informant is often very important. A history of physical symptoms and behavioral change is important, and changes should be documented chronologically. Pointers to brain disease such as seizures, head injury, alcohol and drug use and evidence of cognitive impairment are all mphasized. Personality change with features such as impulsivity, aggressiveness or disinhibition is another important feature. The mental state examination in neuropsychiatry follows the same format as that in general psychiatry except for a more detailed cognitive assessment. Cognitive state examination (CSE): A brief cognitive assessment, which should be done in all cases, is possible at the bedside. For a detailed assessment, a referral to a clinical neurophysiologist is necessary. The CSE must be divided into a number of domains or systems, each of which must be examined. These are: Alertness and arousal, Attention and concentration, Orientation, Memory, Language, Visuospatial and constructive functions, Frontal lobe and Fronto-subcortical functions, Other dominant (left) hemisphere functions: calculation, praxis, R- orientation, finger gnosis, Other non-dominant (right) hemisphere functions: dressing apraxia, neglect phenomena, agnosias, insight and judgment. The assessment of level of consciousness and attentional processes is crucial as disturbance in these domains can influence the performance on other tests. Familiarity with the common bedside tests for each function is important [3]. For most purposes, a screening battery such as Folstein’s Mini-Mental State Examination (MMSE) is a good starting point. It tests orientation, immediate and recent memory, concentration, arithmetic ability, language and praxis. It is easy to administer and takes only 5-10 minutes. It has reasonable sensitivity but low specificity, and may be used for serial evaluations. The score is out of 30, and 27 or less is indicative of impairment. A score less than 25 are definitely abnormal. The MMSE may be normal in the presence of subtle impairment, and if this is suspected, a detailed evaluation is recommended.
specific methods for assessment and diagnosis of various neuropsychiatric diseases depending upon various sign and symptoms. In disease diagnosis Bayesian method is specially considered.
2. PROBLEM DESCRIPTION
We can create problem description table (Table 1) for the neuropsychiatric diseases on the basis of their three important parameters: Psychophysical parameters, EEG signal characteristics and brain image (FMRI) analysis. Psychophysical parameter is further divided into three parts: Psychological parameter consisting of 12 parameters such as: Anger (AN), Abnormal Behavior (AB), Anxiety (AX), Agitation (AG), Delusion (DE), Distraction of Work (DW), Fear (FR), Hallucination (HL), Need of Perfection (NP), Stress (ST), Hyper Activity (HA) and Social Withdrawal (SW); and Cognitive parameter consisting of 8 parameters such as: Confusion in Decision Making (CD), Hearing (HR), Judgment (JG), Learning (LR), Forgetting Memory (FM), Reasoning (RS), Speech (SH) and Vision (VS); and Physical parameter consisting of 8 parameters such as: Climbing (CL), Walking (WL), Hearing (HR), Locomotion (LO), Vision (VS), Speech (SH), Over Sleeping (OS) and Hygiene (HG). The EEG signal characteristics are ACC (AC), CG (CG), Frontal (FL), Perietal (PL), Oclipetal (OL), and Temporal (TL). The Image (FMRI) characteristics are ACC (AC), CG (CG), Frontal (FL), Perietal (PL), Oclipetal (OL), Temporal (TL) and BG (BG). In Table 1 first Coolum contains diseases.
The columns contain symptoms of the diseases. The columns contain “Y” if the respective symptom is present in the disease shown in the respective row. For example, Dementia has Psychological symptoms such as: Anxiety (AX), Distraction of Work (DW), Stress (ST), hyper activity (HA). Therefore, the columns contain “Y” as in Table 1.
The other columns of the Table 1 such as of a particular row contain “Y” or “N” depending upon the characteristics of FMRI of the disease.
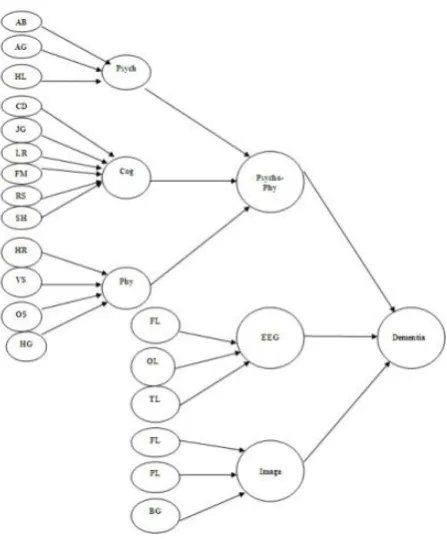
We have organize evidences (symptoms) of 5 neuropsychiatric diseases in graphical representation (Fig. 1 graph for dementia disease) which is composed of basic evidences (symptoms) and nodes. Each node corresponds to a rule in the rule-base. The if (condition) of a rule relates parameters by mean of the logical operators (and). These parameters are the branches that arrive to a node, that is, the evidences and the result of previous nodes. Similarly we can create for other diseases.
3. HIERARCHIAL MODEL FOR SIGN
AND SYMPTONS
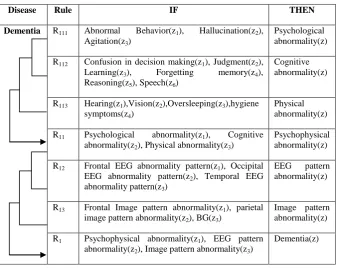
The rule-based model is developed on the basis of the hierarchal tree showing the parameters and their correlation in a particular disease. Fig. 2. shows the rules generated from hierarchical tree of Dementia. It is clear from Table 2 shows
Table 1. Problem Description Table
Disease
Psychophysical EEG Image
Psychological Cognitive Physical
AC AC C CG CG FL Fro n ta l PL Per ieta l O L O cli p eta l TL Te m p o ra l AC AC C CG CG FL Fro n ta l PL Per ieta l O L O cli p eta l TL Te m p o ra l BG BG AN Ang er AB Abn o rm a l Be h a v io r AX Anx iety AG Ag ita ti o n DE De lu sio n DW Distr a ctio n o f wo rk FR Fea r H L H a ll u cin a tio n NP Ne ed o f Per fe ctio n S T S tr ess H A H y p er a ctiv it y S W S o cia l Wi th d ra w a l CD Co n fu sio n in De cisio n Ma k in g H R H ea rin g J G J u d g m en t LR Le a rn in g FM F o rg ettin g Mem o ry RS Re a so n in g S H S p ee ch VS Visio n CL Clim b in g WL Wa lk in g H R H ea rin g LO Lo co m o tio n VS Visio n S H S p ee ch O S O v er S lee p in g H G H y g iene
ADHD N N N N N Y N N N N Y N N Y N Y N N N Y Y N Y N Y N N Y N N Y N N N N N Y Y N Y N
Dementia N Y N Y N N N Y N N N N Y N Y Y Y Y Y N N N Y N Y N Y Y N N Y N Y Y N N Y Y N N Y
Mood Disorder
N N Y N N Y N N N Y Y N Y N N Y N Y N N N N N N Y Y Y N N N Y N N N Y N Y N N Y N
OCD Y N N N N N Y N Y N N N Y N Y N N Y N N N Y N N Y N N N Y Y Y Y Y Y Y Y Y Y N N N
Fig 1: Hierarchical Correlation of Sign and Symptoms (Evidences) of the Dementia Disease
R111: IF there is abnormal behavior (z1) & IF Hallucination (z2) & IF Agitation (z3) THEN Psychological abnormality (z)
R112: IF there is confusion in decision making (z1) & if problem in judgment (z2) & If problem in Learning (z3) & IF problem in for
getting memory (z4) if problem in reasoning (z5) IF problem in speech (z6) THEN cognitive abnormality (z)
R113: IF there is problem in hearing (z1) & IF problem in vision (z2) & IF problem in oversleeping (z3) & if hygiene (z4) THEN
physical abnormality (z)
R11: IF there is problem in Psychological abnormality (z1) & IF cognitive abnormality (z2) & IF physical abnormality (z3) THEN
psychophysical abnormality (z)
R12: IF there is pattern frontal (z1) & IF pattern is parietal (z2) & IF pattern is temporal (z3) THEN EEG pattern abnormality (z)
R13: IF there is images pattern frontal (z1) & IF images pattern is parietal (z2) & IF images pattern is BG (z3) THEN images pattern
abnormality (z)
R1: IF psychophysical abnormality (z1) & IF EEG pattern abnormality (z2) & IF images pattern abnormality (z3) THEN dementia (Z)
Table 2. Rule Base for Rule Base Reasoning (Dementia)
Disease Rule IF THEN
Dementia R111 Abnormal Behavior(z1), Hallucination(z2),
Agitation(z3)
Psychological abnormality(z) R112 Confusion in decision making(z1), Judgment(z2),
Learning(z3), Forgetting memory(z4),
Reasoning(z5), Speech(z6)
Cognitive abnormality(z)
R113 Hearing(z1),Vision(z2),Oversleeping(z3),hygiene
symptoms(z4)
Physical abnormality(z) R11 Psychological abnormality(z1), Cognitive
abnormality(z2), Physical abnormality(z3)
Psychophysical abnormality(z) R12 Frontal EEG abnormality pattern(z1), Occipital
EEG abnormality pattern(z2), Temporal EEG
abnormality pattern(z3)
EEG pattern abnormality(z)
R13 Frontal Image pattern abnormality(z1), parietal
image pattern abnormality(z2), BG(z3)
Image pattern abnormality(z) R1 Psychophysical abnormality(z1), EEG pattern
abnormality(z2), Image pattern abnormality(z3)
Dementia(z)
the rules generated by hierarchal trees of dementia diseases. It is clear from Table 2 that, when rules R111, R112 and R113 are
satisfied then R11 satisfied and when R11, R12 and R13 are
satisfied then R1 is satisfied.
Similarly as Table 2, rules for other diseases of are generated to any lower level to upper level. The hierarchal model will help to compute diseases probability. Rule-based model shows modular representation of the facts. Modules can be hierarchically related as shown in tree structure. Sign and symptoms at the lowest level are correlated to the parameters at the higher level and also the lower level parameters to the higher level parameters. In this way, going from bottom to up i.e. lower to higher level and after travel of certain level we reach to the highest level i.e. root level.
4. COMPUTATION
In this paper computation for neuropsycharicity abnormalities is based on Bayesian model probabilistic prediction. It also includes prior probability table (Table 3) and probability computation tables based on Bayesian network models for all symptoms for related abnormalities. Bayesian model compute and implement the method depending upon prior probabilities of various Psychological, physical, cognitive, EEG and FMRI (Image) parameters then computation of symptoms probabilities followed by probability for a neuropsychiatric abnormality.
4.1 Bayesian Network Model
In order to understand Bayesian Network we start with Bayes theorem [4] [5], expressing the conditional and marginal probabilities of events and, where has a non-vanishing probability:
) (
) ( ) / ( ) / (
p p p
p (4.1)
) (
p is the prior probability (marginal probability) of the event , without any information about the event; p(/) is the conditional probability of the event
, given the event,) / (
p is the conditional probability of the event, given the event , p()is the conditional probability of the event, acting like a normalizing constant.
Bayesian Network (BN) architecture, suited for setting relationship among a large number of nodes / variables, is graphically represented by a directed acyclic graph that efficiently encodes the joint probability distribution (Equation 4.2) for a large set of variables (Equation 4.3).
n
i
i iParentsx x
x p
1
) ( )
( (4.2)
x xn
x 1,... (4.3) p Where: nrepresents the number of nodes included in BN,
xiparents , i1...nirepresents the set of parents of node
i
x .
4.2 Prior Probability
Prior probabilities of the parameters are calculated by the ratio of the total number of cell containing “Y” (in particular parameters) to the total numbers of diseases in Table 1. Example; in case of parameter for physical (total number of cell containing “Y” is 8 and total no of diseases at second level is 8, there for prior probability of physical is 8/8=1). Prior probabilities of different sign and symptoms are calculated in Table 3.
Table 3. Prior Probabilities of Symptoms
4.3 Bayesian Network Model for Dementia
Fig. 3 is representing the dependent network for dementia disease. This network will help to calculate dependent probability.
Fig 3: Tree for Dementia
4.3.1. Calculation of dependent probability of
Psychological Symptoms
Psychological parameter is depends on AB, AG, HL. Since all the symptoms of Psychological participate equally in the diagnosis of Psychological so we have assigned equal weight i.e 0.0909 to all of them. The user select only three
symptoms, therefore, the conditional probability )
, , /
(psycho AB AG HL
p when all The symptoms are one (true) is calculated as 0.0909*1+0.0909*1+0.0909*1=0.2727, and p(psycho/AB,AG,HL)when all the symptoms exceptingHL(which is false) are true is 0.0909*1+0.0909*1+0.0909*0=0.1818. The probability of Psychological p(psycho)is calculated by using formula is given below (calculated in Table 5):
HL) AG)P( AB)P( HL)p( AG, AB, p( psycho/
AG)P( HL) AB)P(
AG,HL)p( AB,
p( psycho/
HL) AB)P( AG)P( HL)p(
AB,AG, p( psycho/
HL) AB)P( AG)P( (
AB,AG,HL)p p( psycho/
HL) AG)P( HL)p( AB)P( AG,
B, p( psycho/A
AG)P( HL) )P(
AG,HL)p( AB B,
p( psycho/A
HL) AG)P( HL)p( AB)P( B,AG,
p( psycho/A
HL) AB)P( AG)P( B,AG,HL)p(
p( psycho/A p( psycho)
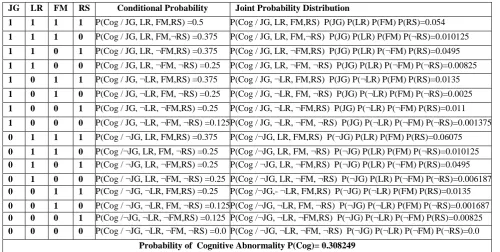
4.3.2. Dependent Probability Calculation for
Cognitive Symptoms
Cognitive parameter is depends on JG, LR, FM, RS. Since all the symptoms of Cognitive participate equally in the diagnosis of Cognitive so we have assigned equal weight i.e0.125 to all of them. The user select only four symptoms, therefore, the conditional probability p(cog/JG,LR,FM,RS)when all the symptoms are one (true) is calculated as 0.125*1+0.125*1+0.125*1+0.125*1=0.5 and
) , , , / )
(cog JG LR FM RS
p when all the symptoms
exceptingRS(which is false) are true is 0.125*1+0.125*1+0.125*1+0.125*0=0.375. The probability of Cognitive p(cog)is calculated by using formula same as applied in section 4.3.1 (calculated in Table 6).
Parameter Probability (T)+ve
Probability (F)-ve
Parameter Probability (T)+ve
Probability (F)-ve
P(AN) .28 .72 P(FM) .45 .55
P(AB) .43 .57 P(RS) .80 .20
P(AX) .19 .81 P(SH) .45 .55
P(AG) .27 .73 P(VS) .95 .05
P(DE) .21 .79 P(CL) .25 .75
P(DW) .49 .51 P(WL) .20 .80
P(FR) .25 .75 P(LO) .25 .75
P(HL) .51 .49 P(OS) .70 .30
P(NP) .18 .82 P(HG) .35 .65
P(ST) .17 .83 P(AC) .55 .45
P(HA) .53 .47 P(CG) .30 .70
P(SW) .31 .69 P(FL) .99 .01
P(CD) .70 .30 P(PL) .85 .15
P(HR) .25 .75 P(OL) .75 .25
P(JG) .40 .60 P(TL) .80 .20
[image:5.595.58.282.399.669.2]1.3.3
Dependent Probability Calculation for
Physical Symptoms
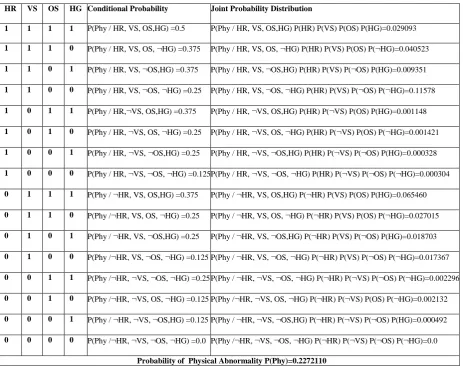
Physical parameter is depends on HR, VS, OS, HG. Since all the symptoms of physical participate equally in the diagnosis of physical so we have assigned equal weight i.e 0.125 to all of them. The user select only four symptoms, therefore, the conditional probability p(phy/HR,VS,OS,HG)when all the symptoms are one (true) is calculated as 0.125*1+0.125*1+0.125*1+0.125*1=0.50 and
) , , , /
(phy HRVS OS HG
p when all the symptoms
exceptingHG(which is false) are true is .125*1+.125*1+.125*1+.125*0=.375. The probability of physical p(phy) is calculated by using formula same as applied in section 4.3.1 (calculated in Table 7).
4.3.4
Dependent Probability Calculation for
Psychophysical Symptoms
Psychophysical parameter is depends on psycho, cog, phy. Since all the symptoms of psychophysical participate equally in the diagnosis of Psychophysical so we have assigned equal weight i.e 0.33 to all of them. The user select only three symptoms, therefore, the conditional probability
) , , /
(phycho phy psychocog psy
p when all The symptoms
are one (true) is calculated as 0.33*1+0.33*1+0.33*1=1.0 and )
, , /
(phycho phy psychocog psy
p when all the symptoms
exceptingpsy(which is false) are true is 0.33*1+0.33*1+0.33*0=0.67. The probability of Psychophysical p(phychophy)is calculated by using formula same as applied in section 4.3.1 (calculated in Table 8).
4.3.5 Dependent Probability Calculation for
EEG Symptoms
EEG parameter is depends on FL, OL, TL. Since all the symptoms of EEG participate equally in the diagnosis of EEG so we have assigned equal weight i.e.167 to of them. The user select three symptoms, therefore, the conditional probability
) , , /
(EEG FLOLTL
p when all the symptoms are one (true) is calculated as 0.167*1+0.167*1+0.167*1=0.5 and
) , , /
(EEG FLOL TL
p when the symptoms excepting TL (which is false) 0.167*1+0.167*1+0.167*0=0.33. The probability of EEG p(EEG)is calculated by using formula same as applied in section 4.3.1 (Calculated in Table 9).
4.3.6
Calculation of dependent probability of
Image Symptoms
Image parameter is depends on FL, PL, BG. Since all the symptoms of Images participate equally in the diagnosis of Images so we have assigned equal weight i.e 0.1429 to all of them. The user select only three symptoms, therefore, the
conditional probability p(Images/FL,PL,BG)when all the symptoms are one (true) is calculated as 0.1429*1+0.1429*1+0.1429*1=0.14286. And
) , , /
(Images FLPL BG
p when all the symptoms excepting BG
(which is false) are true is 0.1429*1+0.1429*1+0.1429*0=0.2857. The probability of Imagesp(Images)is calculated by using formula same as applied in section 4.3.1 (calculated in Table 10).
4.3.7
Calculation of dependent probability of
Dementia
Dementia parameter is depends on Psycho-phy, EEG, Images. Since all the symptoms of DEMENTIA participate equally in the diagnosis of DEMENTIA so we have assigned equal weight i.e 0.33 to all of them. The user select only three symptoms, therefore, the conditional probability
) Im , , /
(DEM Psycho phyEEG ages
p when all The
symptoms are one (true) is calculated as
0.33*1+0.33*1+0.33*1=1.0. And
) Im , , /
(DEM Psycho phyEEG ages
p when all the
symptoms excepting Images(which is false) are of them true is 0.33*1+0.33*1+0.33*0=0.67. The probability of DEMENTIAp(DEM)is calculated by using formula same as applied in section 4.3.1 (calculated in Table 11).
5
RESULT AND CONCLUSION
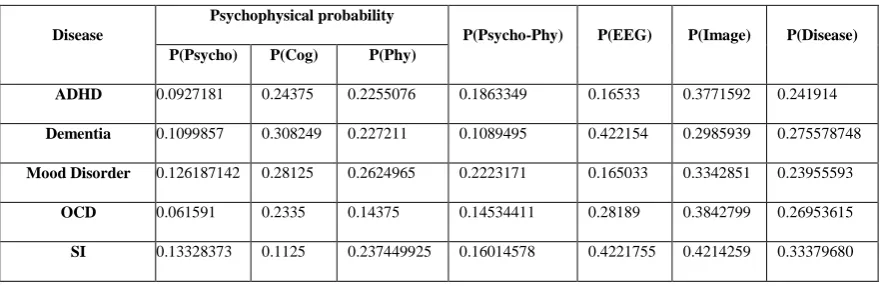
Calculated probabilities of various indicators (Sign and Symptom) of disease correspond to Bayesian model. (as shown in Table 4).
Hierarchical and RBR model used to create Bayesian network for different diseases. Probabilities of different diseases correspond to different sign and symptom probabilities as shown in Table 4. These probabilities values are based on the common sign and symptoms.
The RBR approach shows a hierarchical correlation of sign and symptom with the diseases. A combined structure, depicting the sign and symptom displayed in the physical, Psychological, Cognitive, EEG, Images (FMRI). Parameters have rarely been developed for diagnosis of neuropsychiatry diseases and also Bayesian network model have also rarely been used for diagnosis of neuropsychiatry diseases.
[image:6.595.78.519.647.790.2]The sign and symptom of neuropsychiatry diseases have been taken from literature, consultation with physician and researchers in the domain area of neuropsychiatry diseases of neuropsychiatry diseases.
Table 4. Calculated Probability of Different Diseases
Disease
Psychophysical probability
P(Psycho-Phy) P(EEG) P(Image) P(Disease) P(Psycho) P(Cog) P(Phy)
ADHD 0.0927181 0.24375 0.2255076 0.1863349 0.16533 0.3771592 0.241914
Dementia 0.1099857 0.308249 0.227211 0.1089495 0.422154 0.2985939 0.275578748
Mood Disorder 0.126187142 0.28125 0.2624965 0.2223171 0.165033 0.3342851 0.23955593
OCD 0.061591 0.2335 0.14375 0.14534411 0.28189 0.3842799 0.26953615
6
REFERENCES
[1] Patel V. et al. (1997), British Journal of Psychiatry (1997). Volume 171, 60-64.
[2] Thom R.S.M, Zwi R.M and Reinach S.G. (1993), The Prevalence of Psychiatric disorders at a Primary Care Clinic – Soweto, Johannesburg South Africa. Medicine Journal 1993, 83, 653-655.
[3] Fogel BS, Schiffer, RB, Rao, SM (1996) (eds.), Neuropsychiatry. Baltimore: Williams and Wilkins, 1996.
[4] James J. Heckman & James M. Snyder, Jr., 1996. "Linear Probability Models of the Demand for Attributes with an Empirical Application to Estimating the Preferences of Legislators," NBER Working Papers 5785, National Bureau of Economic Research, Inc. [5] Stephenson, T. A. (2000). An Introduction To Bayesian
[image:7.595.50.551.498.750.2]Network Theory And Usage , Institut Dalle Molle d'Intelligence Artificielle Perceptive, Technical Report IDIAP-RR00-03,2000.
Table 5. Dependent Probability for Psychological Symptom
Table 6. Dependent Probability for Cognitive Symptom
JG LR FM RS Conditional Probability Joint Probability Distribution
1 1 1 1 P(Cog / JG, LR, FM,RS) =0.5 P(Cog / JG, LR, FM,RS) P(JG) P(LR) P(FM) P(RS)=0.054
1 1 1 0 P(Cog / JG, LR, FM,¬RS) =0.375 P(Cog / JG, LR, FM,¬RS) P(JG) P(LR) P(FM) P(¬RS)=0.010125
1 1 0 1 P(Cog / JG, LR, ¬FM,RS) =0.375 P(Cog / JG, LR, ¬FM,RS) P(JG) P(LR) P(¬FM) P(RS)=0.0495
1 1 0 0 P(Cog / JG, LR, ¬FM, ¬RS) =0.25 P(Cog / JG, LR, ¬FM, ¬RS) P(JG) P(LR) P(¬FM) P(¬RS)=0.00825
1 0 1 1 P(Cog / JG, ¬LR, FM,RS) =0.375 P(Cog / JG, ¬LR, FM,RS) P(JG) P(¬LR) P(FM) P(RS)=0.0135
1 0 1 0 P(Cog / JG, ¬LR, FM, ¬RS) =0.25 P(Cog / JG, ¬LR, FM, ¬RS) P(JG) P(¬LR) P(FM) P(¬RS)=0.0025
1 0 0 1 P(Cog / JG, ¬LR, ¬FM,RS) =0.25 P(Cog / JG, ¬LR, ¬FM,RS) P(JG) P(¬LR) P(¬FM) P(RS)=0.011
1 0 0 0 P(Cog / JG, ¬LR, ¬FM, ¬RS) =0.125 P(Cog / JG, ¬LR, ¬FM, ¬RS) P(JG) P(¬LR) P(¬FM) P(¬RS)=0.001375
0 1 1 1 P(Cog / ¬JG, LR, FM,RS) =0.375 P(Cog /¬JG, LR, FM,RS) P(¬JG) P(LR) P(FM) P(RS)=0.06075
0 1 1 0 P(Cog /¬JG, LR, FM, ¬RS) =0.25 P(Cog /¬JG, LR, FM, ¬RS) P(¬JG) P(LR) P(FM) P(¬RS)=0.010125
0 1 0 1 P(Cog / ¬JG, LR, ¬FM,RS) =0.25 P(Cog / ¬JG, LR, ¬FM,RS) P(¬JG) P(LR) P(¬FM) P(RS)=0.0495
0 1 0 0 P(Cog / ¬JG, LR, ¬FM, ¬RS) =0.25 P(Cog / ¬JG, LR, ¬FM, ¬RS) P(¬JG) P(LR) P(¬FM) P(¬RS)=0.006187
0 0 1 1 P(Cog / ¬JG, ¬LR, FM,RS) =0.25 P(Cog /¬JG,- ¬LR, FM,RS) P(¬JG) P(¬LR) P(FM) P(RS)=0.0135
0 0 1 0 P(Cog / ¬JG, ¬LR, FM, ¬RS) =0.125 P(Cog /¬JG, ¬LR, FM, ¬RS) P(¬JG) P(¬LR) P(FM) P(¬RS)=0.001687
0 0 0 1 P(Cog /¬JG, ¬LR, ¬FM,RS) =0.125 P(Cog /¬JG, ¬LR, ¬FM,RS) P(¬JG) P(¬LR) P(¬FM) P(RS)=0.00825
0 0 0 0 P(Cog / ¬JG, ¬LR, ¬FM, ¬RS) =0.0 P(Cog / ¬JG, ¬LR, ¬FM, ¬RS) P(¬JG) P(¬LR) P(¬FM) P(¬RS)=0.0
Probability of Cognitive Abnormality P(Cog)= 0.308249
AB AG HL Conditional Probability Joint Probability Distribution
1 1 1 P(Psycho/AB,AG,HL)=0.2727 P(Psycho/AB,AG,HL) P(AB) P(AG) P(HL) =0.016146 1 1 0 P(Psycho/AB,AG,¬HL)=0.1818 P(Psycho/AB,AG,¬HL) P(AB) P(AG) P(¬HL) =0.10342 1 0 1 P(Psycho/AB,¬AG,HL)=0.1818 P(Psycho/AB,¬AG,HL) P(AB) P(¬AG) P(HL) =0.029104 1 0 0 P(Psycho/AB,¬AG,¬HL)=0.0909 P(Psycho/AB,¬AG,¬HL) P(AB) P(¬AG) P(¬HL) =0.013984 0 1 1 P(Psycho/¬AB,AG,HL)=0.1818 P(Psycho/¬AB,AG,HL) P(¬AB) P(AG) P(HL) =0.0142693 0 1 0 P(Psycho/¬AB,AG,¬HL)=0.0909 P(Psycho/¬AB,AG,¬HL) P(¬AB) P(AG) P(¬HL) =0.006854 0 0 1 P(Psycho/¬AB,¬AG,HL)=0.0909 P(Psycho/¬AB,¬AG,HL) P(¬AB) P(¬AG) P(HL) =0.019289 0 0 0 P(Psycho/¬AB,¬AG,¬HL)=0.0 P(Psycho/¬AB,¬AG,¬HL) P(¬AB) P(¬AG) P(¬HL) =0.0
Table 7. Dependent Probability for Physical Symptom
HR VS OS HG Conditional Probability Joint Probability Distribution
1 1 1 1 P(Phy / HR, VS, OS,HG) =0.5 P(Phy / HR, VS, OS,HG) P(HR) P(VS) P(OS) P(HG)=0.029093
1 1 1 0 P(Phy / HR, VS, OS, ¬HG) =0.375 P(Phy / HR, VS, OS, ¬HG) P(HR) P(VS) P(OS) P(¬HG)=0.040523
1 1 0 1 P(Phy / HR, VS, ¬OS,HG) =0.375 P(Phy / HR, VS, ¬OS,HG) P(HR) P(VS) P(¬OS) P(HG)=0.009351
1 1 0 0 P(Phy / HR, VS, ¬OS, ¬HG) =0.25 P(Phy / HR, VS, ¬OS, ¬HG) P(HR) P(VS) P(¬OS) P(¬HG)=0.11578
1 0 1 1 P(Phy / HR,¬VS, OS,HG) =0.375 P(Phy / HR, ¬VS, OS,HG) P(HR) P(¬VS) P(OS) P(HG)=0.001148
1 0 1 0 P(Phy / HR, ¬VS, OS, ¬HG) =0.25 P(Phy / HR, ¬VS, OS, ¬HG) P(HR) P(¬VS) P(OS) P(¬HG)=0.001421
1 0 0 1 P(Phy / HR, ¬VS, ¬OS,HG) =0.25 P(Phy / HR, ¬VS, ¬OS,HG) P(HR) P(¬VS) P(¬OS) P(HG)=0.000328
1 0 0 0 P(Phy / HR, ¬VS, ¬OS, ¬HG) =0.125 P(Phy / HR, ¬VS, ¬OS, ¬HG) P(HR) P(¬VS) P(¬OS) P(¬HG)=0.000304
0 1 1 1 P(Phy / ¬HR, VS, OS,HG) =0.375 P(Phy / ¬HR, VS, OS,HG) P(¬HR) P(VS) P(OS) P(HG)=0.065460
0 1 1 0 P(Phy /¬HR, VS, OS, ¬HG) =0.25 P(Phy / ¬HR, VS, OS, ¬HG) P(¬HR) P(VS) P(OS) P(¬HG)=0.027015
0 1 0 1 P(Phy / ¬HR, VS, ¬OS,HG) =0.25 P(Phy / ¬HR, VS, ¬OS,HG) P(¬HR) P(VS) P(¬OS) P(HG)=0.018703
0 1 0 0 P(Phy /¬HR, VS, ¬OS, ¬HG) =0.125 P(Phy / ¬HR, VS, ¬OS, ¬HG) P(¬HR) P(VS) P(¬OS) P(¬HG)=0.017367
0 0 1 1 P(Phy /¬HR, ¬VS, ¬OS, ¬HG) =0.25 P(Phy / ¬HR, ¬VS, ¬OS, ¬HG) P(¬HR) P(¬VS) P(¬OS) P(¬HG)=0.002296
0 0 1 0 P(Phy /¬HR, ¬VS, OS, ¬HG) =0.125 P(Phy /¬HR, ¬VS, OS, ¬HG) P(¬HR) P(¬VS) P(OS) P(¬HG)=0.002132
0 0 0 1 P(Phy / ¬HR, ¬VS, ¬OS,HG) =0.125 P(Phy / ¬HR, ¬VS, ¬OS,HG) P(¬HR) P(¬VS) P(¬OS) P(HG)=0.000492
0 0 0 0 P(Phy /¬HR, ¬VS, ¬OS, ¬HG) =0.0 P(Phy /¬HR, ¬VS, ¬OS, ¬HG) P(¬HR) P(¬VS) P(¬OS) P(¬HG)=0.0
Probability of Physical Abnormality P(Phy)=0.2272110
Table 8. Dependent Probability for Psychophysical
Psycho Cog Phy Conditional Probability Joint Probability Distribution
1 1 1 P(Psycho-Phy / Psycho, Cog, Phy) =1.0 P(Psycho-Phy / Psycho, Cog, Phy) P(Psycho) P(Cog) P(Phy) =0.0077031
1 1 0 P(Psycho-Phy / Psycho, Cog, ¬Phy) =0.67 P(Psycho-Phy / Psycho, Cog, ¬Phy) P(Psycho) P(Cog) P(¬Phy) =0.0175539
1 0 1 P(Psycho-Phy / Psycho, ¬Cog, Phy) =0.67 P(Psycho-Phy / Psycho, ¬Cog, Phy) P(Psycho) P(¬Cog) P(Phy) =0.0115821
1 0 0 P(Psycho-Phy / Psycho, ¬Cog, ¬Phy) =0.33 P(Psycho-Phy / Psycho, ¬Cog, ¬Phy) P(Psycho) P(¬Cog) P(¬Phy) =0,0194026
0 1 1 P(Psycho-Phy / ¬Psycho, Cog, Phy) =0.67 P(Psycho-Phy / ¬Psycho, Cog, Phy) P(¬Psycho) P(Cog) P(Phy) =0.04176407
0 1 0 P(Psycho-Phy / ¬Psycho, Cog, ¬Phy) =0.33 P(Psycho-Phy / ¬Psycho, Cog, ¬Phy) P(¬Psycho) P(Cog) P(¬Phy) =0.0069996
0 0 1 P(Psycho-Phy /¬Psycho,- Cog, Phy) =0.33 P(Psycho-Phy / ¬Psycho, ¬Cog, Phy) P(¬Psycho) P(¬Cog) P(Phy) =0.00461625
0 0 0 P(Psycho-Phy /¬Psycho, ¬Cog, ¬Phy) =0.0 P(Psycho-Phy / ¬Psycho, ¬Cog, ¬Phy) P(¬Psycho) P(¬Cog) P(¬Phy) =0.0
[image:8.595.67.533.482.692.2]Table 9. Dependent Probability for EEG Symptom
FL OL TL Conditional Probability Joint Probability Distribution
1 1 1 P(EEG/ FL, OL, TL)=0.5 P(EEG/ FL, OL, TL)P( FL)P( OL)P( TL) =0.297
1 1 0 P(EEG/ FL, OL, ¬TL)=0.33 P(EEG/ FL, OL, ¬TL)P( FL)P( OL)P(¬TL) =0.0490
1 0 1 P(EEG/ FL, ¬OL, TL)=0.33 P(EEG/ FL, ¬OL, TL)P( FL)P(¬OL)P( TL) =0.06534
1 0 0 P(EEG/ FL, ¬OL, ¬TL)=0.1667 P(EEG/ FL, ¬OL, ¬TL)P( FL)P(¬OL)P(¬TL) =0.008251
0 1 1 P(EEG/¬FL, OL, TL)=0.33 P(EEG/¬FL, OL, TL)P(¬FL)P( OL)P( TL) =0.00198
0 1 0 P(EEG/¬FL, OL, ¬TL)=0.1667 P(EEG/¬FL, OL, ¬TL)P(¬FL)P( OL)P(¬TL) =0.000250
0 0 1 P(EEG/¬FL, ¬OL, TL)=0.1667 P(EEG/¬FL, ¬OL, TL)P(¬FL)P(¬OL)P( TL) =0.000333
0 0 0 P(EEG/¬FL, ¬OL, ¬TL)=0.0 P(EEG/¬FL, ¬OL, ¬TL)P(¬FL)P(¬OL)P(¬TL) =0.0
Probability of EEG Abnormality P(EEG)=0.422154
[image:9.595.103.495.92.281.2]Table 10. Dependent Probability for Images Symptom
Table 11. Dependent Probability for Dementia
Psycho-Phy EEG Image Conditional Probability Joint Probability Distribution
1 1 1 P(DEM / Psycho-Phy, EEG, Image) =1-0 P(DEM / Psycho-Phy, EEG, Image) P(Psycho-Phy) P(EEG) P(Image) =0.013733368
1 1 0 P(DEM / Psycho-Phy, EEG, ¬Image) =0.67 P(DEM / Psycho-Phy, EEG, ¬Image) P(Psycho-Phy) P(EEG) P(¬Image) =0.02161457
1 0 1 P(DEM / Psycho-Phy, ¬EEG, Image) =0.67 P(DEM / Psycho-Phy, ¬EEG, Image) P(Psycho-Phy) P(¬EEG) P(Image) =0.01259485
1 0 0 P(DEM / Psycho-Phy, ¬EEG, ¬Image) =0.33 P(DEM / Psycho-Phy, ¬EEG, ¬Image) P(Psycho-Phy) P(¬EEG) P(¬Image) =0.01457226
0 1 1 P(DEM / ¬Psycho-Phy, EEG, Image) =0.67 P(DEM / ¬Psycho-Phy, EEG, Image) P(¬Psycho-Phy) P(EEG) P(Image) =0.07525389
0 1 0 P(DEM / ¬Psycho-Phy, EEG, ¬Image) =0.33 P(DEM / ¬Psycho-Phy, EEG, ¬Image) P(¬Psycho-Phy) P(EEG) P(¬Image) =0.08706762
0 0 1 P(DEM / ¬Psycho-Phy, ¬ EEG, Image)
=0.33
P(DEM / ¬Psycho-Phy, ¬EEG, Image) P(¬Psycho-Phy) P(¬EEG) P(Image) =0.05073519
0 0 0 P(DEM / ¬Psycho-Phy, ¬EEG, ¬Image)
=0.0
P(DEM / ¬Psycho-Phy, ¬EEG, ¬Image) P(¬Psycho-Phy) P(¬EEG) P(¬Image) =0.0
The Probability of DEMENTIA P(DEM)=0.275571748
FL PL BG Conditional Probability Joint Probability Distribution
1 1 1 P(Image / FL, PL, BG) =0.42857 P(Image / FL, PL, BG) P( FL) P( PL) P( BG) =0.090160
1 1 0 P(Image / FL, PL,¬BG) =0.2857 P(Image / FL, PL,¬BG) P( FL) P( PL) P(¬BG) =0.180312
1 0 1 P(Image / FL,¬PL, BG) =0.2857 P(Image / FL,¬PL, BG) P( FL) P(¬PL) P( BG) =0.010606
1 0 0 P(Image / FL,¬PL,¬BG) =0.14285 P(Image / FL,¬PL,¬BG) P( FL) P(¬PL) P(¬BG) =0.0159099
0 1 1 P(Image / FL, PL, BG) =0.2857 P(Image / FL, PL, BG) P( FL) P( PL) P( BG) =0.000607
0 1 0 P(Image / ¬FL, PL,¬BG) =0.14285 P(Image / ¬FL, PL, ¬BG) P( ¬FL) P( PL) P( ¬BG) =0.00000946
0 0 1 P(Image / ¬FL, ¬PL, BG) =0.14285 P(Image / ¬FL, ¬PL, BG) P(¬FL) P(¬PL) P( BG) =0.000053
0 0 0 P(Image / ¬FL, ¬PL, ¬BG) =0.0 P(Image / ¬FL, ¬PL, ¬BG) P( ¬FL) P(¬PL) P(¬BG) =0.0