Optimal Versus Required Defence
Spending
ANDREOU, ANDREAS and PARSOPOULOS,
KONSTANTINE and VRACHATIS, MICHAEL and
Zombanakis, George A.
Cyprus University of Technology, The University of Patras, The
University of Patras, The American College of Greece
14 July 2003
Online at
https://mpra.ub.uni-muenchen.de/78663/
67
“Si vis pacem para bellum”
(if you desire peace prepare for war) Roman saying
It seems, therefore, that the Romans were right when they claimed that those who desire peace must prepare for war. This was, obviously, a strictly empirical finding attained centuries earlier before the world knew anything about defence economics, Richardson models, game theory or Nash equilibrium which are nowadays used simply to reach this very straightforward conclusion.
The coincidence of theory and practice in this case leads to the following two very important considerations: The first one suggests that defence economics is by no means
what some people refer to as “the painful elaboration of the obvious”. On the contrary,
theoretical structures like the ones mentioned in the previous paragraph provide the means to firmly support the Roman views on the trade-off between war and peace. They, moreover, contribute to proving that those who lament over a wasted peace dividend do not know or, what is even worse, do not want to know the value of military security as an investment for peace1.
The second one is much more specific, as it refers strictly to the way in which Turkey seems to convert theory into practice, being a devoted follower of the Roman views on the subject. This focus of the Turks to the Roman dogma is not unreasonable.
1
There are numerous sources on the issue of the peace dividend, both theoretical and applied in the case of various countries. A useful source in this case would be the book by Gleditsch et al. (eds.) “The Peace
In fact, it seems that Turkey feels threatened in more ways than one, as it has been involved in a number of crises, to a large or a lesser extent, especially during the past decade: The Gulf War during the beginning of the nineties and its current version in 2003 have both underlined the threat of a Kurdish State, especially during a period in which the U.S. realizes that it can not count on Turkey for its long-term strategies, at least to the extent that it used to do before the JDP (Justice and Development Party)won the November 2002 elections. The instability in Georgia and Armenia in the north- east border and the tension occasionally prevailing between Turkey and Syria over territorial disputes can only contribute to this feeling of insecurity. Finally, the relations of Turkey with Greece offer a wide variety of occasions for friction between the two countries in a number of issues like the Turkish territorial ambitions in the broader Aegean Sea theatre and the Cyprus issue. It is only natural therefore, that Turkey should aim at interfering in all these cases in a manner that not only would appease its fears concerning its territorial status quo, but would also favor its strategic ambitions. To do so it has always been pursuing a very consistent defence procurement policy, even during financially rough times. This consistency has been repeatedly underlined by the long-term procurement programmes of the Turkish armed forces, to which the domestic defence industry contributes a substantial share2. And even in cases in which unforeseen difficulties might arise, like the major earthquake in 1999 and the recent economic and political crisis, the projects involved in these programmes are never cancelled. They are simply postponed for a number of years.
As a result, Turkey has paid its focus on security matters rather dearly given the disappointing performance of its economy, especially during the recent past3. In fact, the
2
The current long-term defence procurement programme of the Turkish armed forces has a 30-year time horizon. It expires in 2025 and involves purchases of the order of 150 billion U.S. dollars. For details on this issue the authorized reader may consult Pavlopoulos ( 2000 ).
3
Inflation rate in terms of consumer prices is of the order of 50% for the last few years while the Turkish lira market rate depreciates versus the U.S. dollar at rates ranging between 50% and 100%. The associated
“persistently high real levels of interest rates”, states the latest OECD Economic Outlook, “are making the
debt sustainability criterion difficult to meet, given the very large amount of short-term debt that either has to be rolled over, or has been issued on a floating-rate basis. The high proportion of the debt that is now denominated in or linked to foreign currencies also leaves the debt burden susceptible to exchange-rate
changes”. The same OECD source points out in addition that “the currently high country risk premium
Interim 2 69
steady growth of its huge external debt has been sustained thanks to the scandalous generosity of the IMF, which grants Turkey one loan after another just upon request4.
Yet, the SIPRI figures point out that the average growth rate of the country’s economy
for the last thirty years or so, although not negligible, is lower than the corresponding defence expenditure figure5. These choices of Ankara are even more impressive if one considers that they reflect the top importance, which it attaches to its defence procurement programmes in times during which almost all NATO allies reduce their defence budgets.
The Greek views on this issue seem to be radically different. The time horizon of the procurement programmes, to which the domestic industry has been contributing a negligible percentage – at least before the privatization of the shipyard industry – does not usually exceed five years while they are always revised downwards on the grounds of hardly convincing excuses. In fact the most recent procurement programme of the Greek armed forces had been curtailed to reach about half its original budget, only two years after earning the approval of the parliament. The government claimed that it thus hoped to reallocate some of these funds to support its social policy and to finance some of the infrastructure projects of the 2004 Olympic games6. We feel that this is a rather weak argument considering the policy followed at least for about a decade now. In fact,
deterioration in the labor market, with adverse effects on income distribution, remains a major threat to
consumption dynamics”.
4
The debt repayments due this year, which amount to 93 billion U.S. dollars, do not seem to be an impediment to the unobstructed flow of IMF loans to Turkey. The country, however, seems to have sacrificed the 6 billion dollar aid package, following its refusal to allow U.S. troops to use its territory in order to create a northern front during their recent invasion against Iraq.
5
The defence expenditure figures published in SIPRI do not include the generous contribution of the Defence Industry Support Fund (DISF).
6
On March 29, 2001 the government used these excuses not only to reduce the defence budget for the period 2002–2004 by one trillion drachmas, but in addition, to postpone the Greek participation to the
Kyriazis and Somakos7 point out that back in 1996 the government opted for spending 1,350 billion drachmas in order to subsidize public enterprises, the managers of which seem to care more about employing the ruling party voters rather than pursuing strict business criteria. These subsidies, which were needed to finance the impact of the resulting diminishing returns and diseconomies of scale in these enterprises, exceeded
the country’s annual defence expenditure by about 70%. Needless to point out that this
money was enough to buy 193 F-16s or 96 F – 15s, much more than what the Hellenic Air Force would ever dream of purchasing! It seems that the dividing line between politics and demagogy is sometimes too thin for certain people to see. Except, if they
pretend not to see …8
We have strong reasons to believe that the second is more likely than the first. Those who preach the reduction of the Greek defence expenditure on the grounds that the economy has reached its capacity limits are engaged in first class sophistry, using arguments based on an apparent inverse relationship between defence expenditure and GDP rate of growth. We are sorry to point out, however, that a similar line of reasoning would support practically any form of correlation. Thus, for example, we have already mentioned the case of the Church subsidies in the north of Greece, which has resulted to an increase in the number of births in the area. We also know that following a set of environmental measures taken in the same area, the number of storks has increased spectacularly. The direct relationship, therefore, between the birth rate and the number of storks in the area indicates that storks bring babies!
The scientific translation of this argument is the following: The GDP growth is not the only independent variable that influences the demand for defence expenditure and in
7Kyriazis and Somakos (1999) “Greece and Turkey, Defence and Economy’’ (in Greek) p.p. 32
-33.
8
Interim 2 71
most of the cases in the literature, the relationship between the two is a direct one9. There are, however, other independent variables used in the literature, like those representing the benefits of an alliance membership or the threat faced which sometimes count much more. Thus, the substantial reduction of the GDP share of defence expenditure to an average of about 4.5% for the nineties compared to almost 6.5% of the previous decade, did not lead to a rise of the GDP growth rates. In fact, the average GDP growth rate for the nineties witnessed a decline to 2.1% down from 2.4%, which was the corresponding figure in the eighties.
But even in the case in which we accept that decision-makers in Greece do not see the logic of increased defence expenditure, we feel that they should, at least, consult the public opinion on the subject as it appears in the daily press. Indeed, they will be surprised to see the latest results of an opinion poll conducted on a quarterly basis throughout the country, which are quite impressive. Thus, according to the March 2003 results of this poll, more than 70% of the Greeks interviewed feel that an increase of the funds devoted to defence spending is necessary in order to face external threats. We feel, therefore, that these results eliminate every argument in favor of curtailing defence expenditure in Greece, even that of vote maximizing!
It is only straightforward, therefore, that, at least in the Greek case, the responsibility concerning the final decisions on defence expenditure, both quantitative
and qualitative, lies on the politicians’ shoulders, with economists and soldiers just
proposing solutions. Prior experience suggests that politicians are usually in favor of defence expenditure cuts for obvious reasons while most economists tend to agree on this, leaving soldiers to press for defence spending increases. The easy way out to settle this dichognomy would be to go along with the majority by agreeing on defence spending reduction. Before doing so, however, it is imperative to consult the public opinion, especially in our days when polls seem to affect almost every political decision. It is, thus, interesting to see that according to the latest (March 2003) results of an opinion poll conducted regularly throughout Greece on a quarterly basis more than 70% of the answers are in favor of increased defence spending given the external threat. We
9
believe that this admittedly striking result is enough to eliminate all arguments brought forward by the advocates of defence expenditure reduction and especially that of vote maximizing!
In view of this considerable discrepancy of views we have thought that deciding on such a crucial matter demands resorting to our favorite line of argument, which makes extensive use of techniques of analysis. In fact, under the circumstances, the crucial question to answer concerns the so-called “optimal defence expenditure”, namely the desired level of defence spending compatible with the capacity of the economy. This compatibility is secured by the introduction of a constraints structure represented by a typical econometric model emphasizing on defence expenditure. Calculating the optimal defence expenditure, however, may cause considerable confusion with reference to the nature of the constraints imposed, something which has become more than obvious during conferences in which we have presented earlier versions of the paper that
follows. We must point out beyond any doubt, therefore, that the term “optimal” is used
in the text to define the maximum GDP share of defence expenditure allowed by the
capacity of the country’s economy. It must, consequently, be interpreted as a strictly
economic optimization which does not take any geopolitical or strategic matters into consideration, which is, admittedly, a very interesting task for further research. Given, however, that such matters should, and do, in fact, influence such decisions taking into account the increased volatility of the international geopolitical and strategic environment, the derived economic optimization results must be interpreted very carefully. More specifically, the optimal figures derived by our algorithm must be interpreted as representing defence expenditure figures that can be attained without any sacrifice in the form of a peace dividend, since they have been calculated under the constraints imposed by the economic system. Peace dividend considerations can be justified only to the extent that the defence spending figures exceed those suggested by our algorithm as financially optimal for reasons related to geopolitical and strategic considerations.
Interim 2 73
imposed by the economic system. We have performed such a constrained optimization exercise for both Greece and Cyprus with the structure of the economies of the two allies provided by a system of equations placing particular emphasis on defence expenditure. The latter has been built along the lines of a typical defence demand equation, which however, includes as a special feature the relative security coefficient introduced in chapter 2. We are confident that the reader will acknowledge the vital role of such a technique in this case in which there is ample room for subjective evaluations concerning the ideal level of defence spending.
REFERENCES
Pavlopoulos J. (2000), “The Defence Procurement Programme of Turkey and its
Repercussions on the Hellenic Navy”, Degree Thesis, Naval War College, Athens.
75
Optimal Versus Required Defence Expenditure
The Case of the Greek
–
Turkish Arms Race
*By
Andreas S. Andreou, Konstantine E. Parsopoulos, Michael N. Vrahatis
and George A. Zombanakis
3.1 INTRODUCTION
The recent rescheduling of the Turkish long-term defence procurement programmes following the economic crisis in the country and the reaction of the Greek authorities to reduce their own by about 25% has become the subject of extensive discussions. The issues involved in such discussions concern the possibility of a causal relationship between the developments in the two countries and the extent to which the two sides entangled, for ages now, in an expensive arms race, can afford a reduction of their defence expenditure. This leads to the next question, which involves the calculation of
an “optimal” defence burden providing for maximum security in the face of an outside
threat bounded by the constraints imposed by the economy.
The optimization will take into account the spillover effects enjoyed by Greece and Cyprus, especially after the implementation of the Integrated Defence Doctrine between these two allies. Finally, we shall consider the extent to which pursuing such an optimum leads to a substantial peace dividend. The answers will be provided in the context of an optimal control solution, using an Interior Penalty Function Method, with
*First published in “Defence and Peace Economics”, vol. 13, 4, 2002, pp. 329
Steepest Descent and Armijo Line Search, after a brief literature overview has been provided in section 2. The third part of this paper includes the description of the econometric model used by the algorithm as a constraints structure under which the penalty function is minimized. Section 4 includes various policy considerations based on the results derived by the algorithm, while the conclusions derived are stated in the last part of the paper.
3.2 LITERATURE OVERVIEW
The existence of an arms race between Greece and Turkey is a well-established fact (Kollias and Makrydakis 1997), determined, to a large extent, by demographic factors describing the Turkish rather than the Greek economic and demographic environment (Andreou and Zombanakis 2000). The extent to which mutual reduction of defence expenditure would lead to a substantial peace dividend has been extensively analyzed for both the Greek-Turkish case (Balfoussias and Stavrinos 1996, Ozmucur 1996, Kollias 1997), as well in a more general context referring to the cost in terms of growth (Deger 1986, Ward et al. 1991, Buck et. al.1993, Looney 1994 and several authors in Hartley and Sandler 1990). In fact, the cost of an arms race, especially on the foreign
sector of what is commonly termed a “small, open economy” is rather expensive since
military expenditure, is highly import-demanding, leading to foreign borrowing which exerts an adverse impact on both the domestic and the foreign sector (Stavrinos and Zombanakis 1998). Especially after the full implementation of the Integrated Defence Doctrine between Greece and Cyprus, the GDP shares of military expenditure by the two allies have exceeded 6% in certain cases, while the military debtin current U.S. dollars has doubled during the 1990s to reach more than 5 billion at the end of 2000, representing about 16% of the total General Government external debt of the country, according to provisional Bank of Greece data. Kollias (1994, 1995 and 1996) and Antonakis (1996 and 1997) have investigated the economic effects of defence expenditure upon the Greek economy.
Optimal vs. Required Defence Expenditure 77
tackle such issues is using a constrained optimization analysis, which requires minimizing the deviations of the endogenous variables of an economic system from their respective target values subject to the constraints imposed by the economy (e.g. Chow 1975, Levy 1992). The method thus leads to determining the ideal or optimal values for those variables, to the extent, of course, that these are attainable. It is important to stress that the derived values for defence expenditure shall be characterized as optimal in the strict economics sense without involving any constraints of strategic or tactical nature, an issue beyond the scope of this paper. The optimal control analysis, therefore, will specify the defence expenditure that the two allies are able to afford in the context of the theory of alliances in its simplest form (Hartley and Sandler 1995).
3.3 THE MODEL
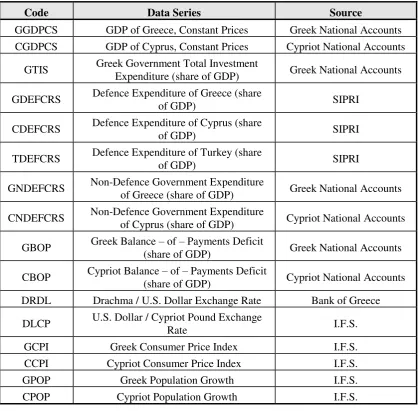
The constraint structure we use for the optimization procedure is a small, highly aggregated model of seven equations representing the economies of Greeceand Cyprus. The model is based on previous research (Stavrinos and Zombanakis 1998), placing emphasis on the defence expenditure side, while variables expressing the Turkish side are taken as exogenous. The majority of the variables are expressed in terms of GDP percentages aiming at concentrating on the growth effects of the priorities assigned to defence policy. Such effects became more pronounced in cases like the Turkish invasion of Cyprus in 1974 and the Greek-Turkish crises in 1982 and 1987. As a first step, all the variables in the stochastic equations have been expressed in natural logs and tested for integration. The data series used are listed in Table 1.
3.3.1 The Demand for Defence Expenditure and the Security Function.
The demand for defence expenditure for each of the two allies, namely Greece and Cyprus, is represented as follows:
GDEFCRS = f (GGDPCS, GNDEFCRS, GBOP, DRDL, RSCG, TDEFCRS) (1)
where GDEFCRS and CDEFCRS are the corresponding GDP shares of defence expenditure for the two allies.
Table 1: Variables and data sources
Code Data Series Source
GGDPCS GDP of Greece, Constant Prices Greek National Accounts
CGDPCS GDP of Cyprus, Constant Prices Cypriot National Accounts
GTIS Greek Government Total Investment
Expenditure (share of GDP) Greek National Accounts
GDEFCRS Defence Expenditure of Greece (share
of GDP) SIPRI
CDEFCRS Defence Expenditure of Cyprus (share
of GDP) SIPRI
TDEFCRS Defence Expenditure of Turkey (share
of GDP) SIPRI
GNDEFCRS Non-Defence Government Expenditure
of Greece (share of GDP) Greek National Accounts
CNDEFCRS Non-Defence Government Expenditure
of Cyprus (share of GDP) Cypriot National Accounts
GBOP Greek Balance – of – Payments Deficit
(share of GDP) Greek National Accounts
CBOP Cypriot Balance – of – Payments Deficit
(share of GDP) Cypriot National Accounts
DRDL Drachma / U.S. Dollar Exchange Rate Bank of Greece
DLCP U.S. Dollar / Cypriot Pound Exchange
Rate I.F.S.
GCPI Greek Consumer Price Index I.F.S.
CCPI Cypriot Consumer Price Index I.F.S.
GPOP Greek Population Growth I.F.S.
CPOP Cypriot Population Growth I.F.S.
Optimal vs. Required Defence Expenditure 79
burden or resource costs10. Its calculation does not depend on the choice of a specific price index, since it is the ratio of two measures in current domestic currency. It is a pure number that can be compared over time and across countries and it is by now extensively used in empirical investigations. There is, however, caution expressed in the literature since measuring the military spending and the other variables in the model as shares or proportions of GDP can be misleading and may introduce biases in the measurement of certain coefficients (Chan 1985). Assuming inflation rates roughly equal for defence and non-defence activities, omitting the price variable does not introduce any biasing results11. GGDPCS and CGDPCS is the Greek and Cypriot GDP at constant prices respectively, GNDEFCRS and CNDEFCRS represent the share of non-defence expenditure in the GDP of the two countries, GBOP and CBOP represent the Greek and Cypriot balance-of-payments deficits as a share in their respective GDP, while DRDL and DLCP stand for the two countries respective currency rates against the US dollar. Notice that the price variable is not included in these functions, due to the lack of import substitution in the two countries, a problem which renders the demand for defence equipment almost completely price inelastic. The threat variable in both cases is TDEFCRS, which represents the share of defence expenditure in the Turkish GDP. Finally, special attention should be drawn to the spillover variable: One might be tempted to argue that a suitable spillover variable would be the military burden of the NATO countries except Greece and Turkey. We feel, however, that since our aim is to concentrate on the Greek-Cypriot alliance as this is expressed through the Integrated Defence Doctrine, what is required is an alternative measure tailored to fit this particular case. We have chosen, therefore to use a measure of relative security as a result of the
two countries’ alliance. This is applicable to cases in which the role of the substantial
difference in human resources endowments between the two sides involved in an arms
10
See Goertz and Diehl (1986), and Herrera (1994), for the comparison of different approaches in measuring military allocations.
11
race is decisive (Andreou and Zombanakis 2001). The measure of this relative security coefficient is given by12:
RSCG = exp[x] (3)
where x stands for the ratio of the difference between the Greek and Cypriot population rates of change over the corresponding Turkish figure, as follows:
where x
pG-pC
/ pT (4)On the basis of (3) and (4) one may be tempted to argue that the ideal alliance target for a balance between the two sides concerning security would be a value of RSCG =
2.718, once x assumes the value of unity. Under the circumstances, however, this is a prohibitive restriction, meaning that the applied side of the matter calls for a more realistic constraint. It must be borne in mind, however, that this relative security coefficient composed of the population characteristics of the two sides involved in an arms race includes more than meets the eye: In fact, the role of the population rates of increase in the RSCG is not only associated with the possibilities to increase manpower
in the armed forces, something which does not necessarily agree with the recipes of modern warfare tactics. It is also linked with the continuous and pressing demands of Turkey for increase of its vital space justified by the population explosion in the country. We feel, therefore, that, given the particularity of the Greek-Turkish arms race, which is affected to a large extent by population developments in the countries involved, the RSCG identity can serve as a security function entering the allies’ utility function13.
3.3.2 The Output Equation.
The GDP in the two countries is determined on the basis of a behavioral equation rather than an identity, given that the optimization procedure requires that emphasis is
12
The RSCG is a relative security measure particularly tailored to fit cases like the Greece / Cyprus
conflict against Turkey. In cases like this the population rates of increase in the two sides play a leading role and this index is designed to emphasize on this specific point, as it is explained in the text. The target set for the RSCG in this optimization procedure is that population developments on the Greek / Cypriot
alliance side counterbalance the Turkish generous population rates of increase, a rather demanding target one must admit. If this is the case, then the numerator must equal the denominator of x yielding a value of unity, the log of which is 2.718. For a detailed explanation on this relative security measure see Andreou and Zombanakis 2001.
13
Optimal vs. Required Defence Expenditure 81
placed on the shares of the various GDP components in it. Equations (5) and (6) describe growth in the two allied countries in terms of its main ingredients: accumulation of physical capital as investment in Greece and Cyprus, GTI and CTI respectively, non-defence expenditure, net imports of goods and services as an indication of the external constraint imposed on the growth rate of the economy. Finally, the local currency exchange rate is included given that it has been a very popular policy instrument for the period under study. Thus the GDP in both countries is taken as determined as follows:
GGDPCS = f (GNDEFCRS, GTI, GBOP, DRDL) (5) CGDPCS = f (CNDEFCRS, CTI, GBOP, DLCP) (6) where GTI and CTI stand for the GDP shares of total investment expenditure in Greece and Cyprus. It must be borne in mind that given the trade-off between non-defence and non-defence expenditure (Benoit 1978), the latter can be thought of as implicitly introduced in these functions to account for the direct effects of military spending on growth in the form of spin-offs, either favorable or adverse (Hartley and Sandler 1995)14. Thus, equations (9) and (12) presented in Table 2 simply underline the importance of the various output components in the GDP of each country, as well as the leading role of the international exchange rate, a policy instrument traditionally used by the economies of the two allies.
3.3.3 The Population Equation
Since we have already underlined the importance of human resources in the Greek - Turkish conflict (Andreou and Zombanakis 2000 and 2001), we have chosen to devote a behavioral equation to describe population developments in each of the two allies15. Thus, the Greek and Cypriot populations are taken to behave as follows:
GPOP = f ( GGDPCS, GDEFCRS, GNDEFCRS, GCPI ) (7) CPOP = f ( CGDPCS, CDEFCRS, CNDEFCRS, CCPI ) (8)
14
General surveys of the effects of military expenditure on growth and development are given in Renner (1991), Isard and Anderton (1992), Pivetti (1992), Mintz and Stevenson (1995), and Ward et al. (1995), among others. For comprehensive bibliographies in English see Klein et al (1995), and Hartley and Hooper (1990).
15
where GCPI and CCPI are the Greek and Cypriot consumer price indices. The estimated equations (11) and (14) for the two allies described in Table 3 draw attention to the role of both non-defence expenditure and the consumer price index in determining population growth (Ehrlich and Lui 1997). The consumer price index is included in the function in order to introduce the budget constraint imposed on low - income families that cannot afford to contribute to the population growth.
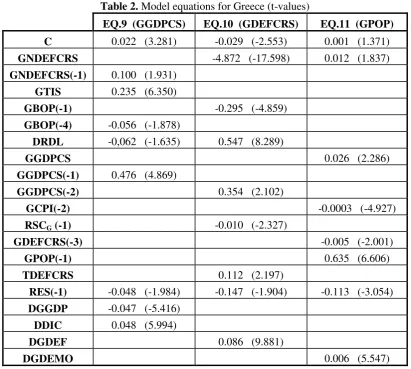
Table 2. Model equations for Greece (t-values)
EQ.9 (GGDPCS) EQ.10 (GDEFCRS) EQ.11 (GPOP)
C 0.022 (3.281) -0.029 (-2.553) 0.001 (1.371)
GNDEFCRS -4.872 (-17.598) 0.012 (1.837)
GNDEFCRS(-1) 0.100 (1.931)
GTIS 0.235 (6.350)
GBOP(-1) -0.295 (-4.859)
GBOP(-4) -0.056 (-1.878)
DRDL -0,062 (-1.635) 0.547 (8.289)
GGDPCS 0.026 (2.286)
GGDPCS(-1) 0.476 (4.869)
GGDPCS(-2) 0.354 (2.102)
GCPI(-2) -0.0003 (-4.927)
RSCG (-1) -0.010 (-2.327)
GDEFCRS(-3) -0.005 (-2.001)
GPOP(-1) 0.635 (6.606)
TDEFCRS 0.112 (2.197)
RES(-1) -0.048 (-1.984) -0.147 (-1.904) -0.113 (-3.054)
DGGDP -0.047 (-5.416)
DDIC 0.048 (5.994)
DGDEF 0.086 (9.881)
DGDEMO 0.006 (5.547)
3.3.4 Comments on the Equation Estimates
Optimal vs. Required Defence Expenditure 83
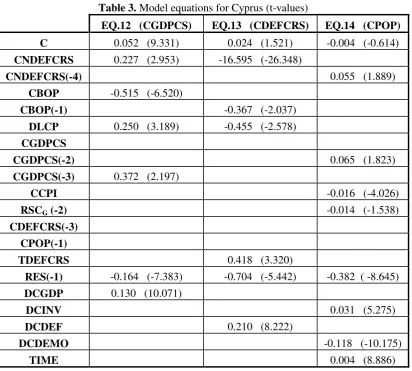
Table 3. Model equations for Cyprus (t-values)
EQ.12 (CGDPCS) EQ.13 (CDEFCRS) EQ.14 (CPOP)
C 0.052 (9.331) 0.024 (1.521) -0.004 (-0.614)
CNDEFCRS 0.227 (2.953) -16.595 (-26.348)
CNDEFCRS(-4) 0.055 (1.889)
CBOP -0.515 (-6.520)
CBOP(-1) -0.367 (-2.037)
DLCP 0.250 (3.189) -0.455 (-2.578)
CGDPCS
CGDPCS(-2) 0.065 (1.823)
CGDPCS(-3) 0.372 (2.197)
CCPI -0.016 (-4.026)
RSCG (-2) -0.014 (-1.538)
CDEFCRS(-3)
CPOP(-1)
TDEFCRS 0.418 (3.320)
RES(-1) -0.164 (-7.383) -0.704 (-5.442) -0.382 ( -8.645)
DCGDP 0.130 (10.071)
DCINV 0.031 (5.275)
DCDEF 0.210 (8.222)
DCDEMO -0.118 (-10.175)
TIME 0.004 (8.886)
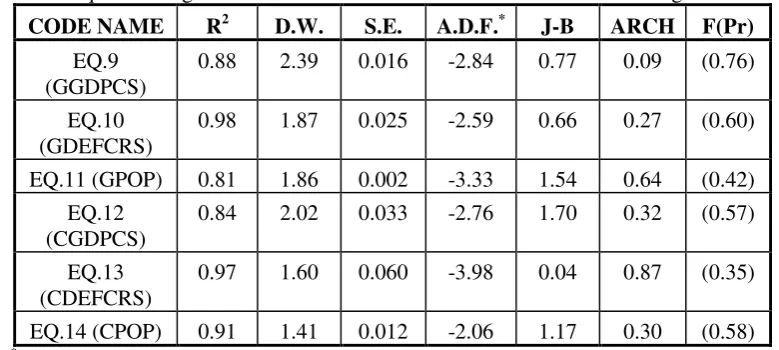
Table 4: Equation diagnostics and A.D.F. values for the residuals of their long-run versions
CODE NAME R2 D.W. S.E. A.D.F.* J-B ARCH F(Pr)
EQ.9 (GGDPCS)
0.88 2.39 0.016 -2.84 0.77 0.09 (0.76)
EQ.10 (GDEFCRS)
0.98 1.87 0.025 -2.59 0.66 0.27 (0.60)
EQ.11 (GPOP) 0.81 1.86 0.002 -3.33 1.54 0.64 (0.42)
EQ.12 (CGDPCS)
0.84 2.02 0.033 -2.76 1.70 0.32 (0.57)
EQ.13 (CDEFCRS)
0.97 1.60 0.060 -3.98 0.04 0.87 (0.35)
EQ.14 (CPOP) 0.91 1.41 0.012 -2.06 1.17 0.30 (0.58)
*
All A.D.F. tests indicate that the series are I(0) at a 1% level except equation 14 which describes the behaviour of the Cypriot population in the case of which is I(0) at a 5% level. The J-B (Jarque-Bera statistic) shows that the errors are normally distributed while the ARCH figures for autoregressive conditional heteroskedasticity are not significant.
Finally, given the length of the estimation period, the dummies used in the equations tackle the effects of crises between Greece and Turkey or the influence of exogenous disturbances of political or social nature that introduce structural changes in the economies of the two allies16. Thus, DCDEMO is used to capture the dramatic change in the Cypriot population after the 1974 invasion while DGDEMO includes the exogenous disturbance of the Greek population after the massive inflow of refugees from Turkey during the mid-sixties and the substantial increase in the number of illegal immigrant workers mainly from Albania and Bulgaria during the beginning of the nineties. DGDEF and DCDEF are used to capture revisions in the long-run defence programmes of Greece and Cyprus or lump sum purchases, which are settled through bilateral agreements and are not reflected in the external accounts of the two countries. The procurement of the Type-209 submarines from HDW by the Greek Navy during the beginning of the seventies, the so-called purchase of the century involving the procurement of a large number of Mirage fighters during the mid-eighties, its revision after the change of the Greek government at the beginning of the nineties and the procurement of the S-300 antiaircraft missiles by Cyprus during the end of the nineties
16
Optimal vs. Required Defence Expenditure 85
are typical examples. DGGDP and DCGDP represent the effects of certain exogenous disturbances on the economies of the two allies like the three devaluations of the drachma in 1983, 1985 and 1996 and the pressure upon the Cypriot economy after the 1974 shock. Finally, DDIC and DCINV capture the prolonged social and political instability in Greece and Cyprus caused by the dictatorial regime between 1967 and 1974.
All variables are expressed in terms of first differences with the RES terms indicating the residual item of the corresponding long-run version of each equation. The A.D.F. tests for these terms along with selected diagnostics are also included in Table 4.
3.3.4.1 The Demand for Defence Expenditure
3.3.4.2 The Output Equation
Equations (9) and (12) represent the Greek and Cypriot output growth respectively in terms of their main components and the domestic currency exchange rate against the U.S. All estimates bear the expected sign and are statistically significant with a marginal exception in the case of the exchange rate in (9). This point, together with the low elasticity derived in both equations are related to the controversy associated with the effects of a domestic currency devaluation on the rate of growth (Zombanakis 1998) while attention, once more, is drawn to the difference in the sign of the exchange - rate coefficient between (9) and (12). The considerable time-lag in the case of the external constraint in the Greek case is related to the lengthy time period involved between an external trade transaction and its settlement with the conversion of the foreign exchange proceeds or payments to domestic currency, given that foreign exchange restrictions apply for a major part of the estimation period.
3.3.4.3 The Population Equation
The estimation of the two population equations (11) and (14) has faced a number of difficulties mainly due to the poor data quality, especially in the case of Cyprus, in which the 1974 invasion has introduced a major disturbance in the population pattern of growth. All coefficients, however, are statistically significant and bear the expected sign. The constraint imposed on population growth due to the standard of living is approximated by the consumer price index the reaction to which turns out to be quite significant, however highly inelastic in both cases. Finally, devoting funds to non-defence activities seems to contribute to the population increase while this is not the case for defence expenditure, at least in the case of the equation for Greece. Introducing defence spending in the Cypriot version of the equation did not produce any meaningful results and was, consequently excluded.
3.3.4.4 The Constrained Optimization
Optimal vs. Required Defence Expenditure 87
“welfare function” the arguments of which are the squared deviations of the endogenous
variables from their respective targets. These targets are set in the context of a number of scenarios while the policy instruments used are the GDP shares of defence expenditure in the two allied countries. Given that the importance assigned to each of these endogenous variables may differ depending on each policy-maker’s hierarchy ordering and priorities, we have decided to perform the constrained optimization introducing these priorities in the welfare function in two different ways: The first is to assign equal weights to all endogenous variables introducing a cardinal hierarchy ordering in terms of determining a target value for each endogenous variable which reflects the emphasis placed on either property or human resources. The second is to allow this emphasis to be reflected in the weights rather than the target values of the endogenous variables, an approach which focuses on the ordinal aspect of the hierarchy ordering. While the equations above have been estimated for the period between 1960 and 2000, the optimization exercise concentrates on the last eleven years, namely 1990 to 2000, in order to avoid the adverse repercussions of a large number of structural reforms, mostly of political nature, affecting Greece and Cyprus during the previous three decades.
The technique we employ for solving the Optimal Control problem is an Interior Penalty Function Method, with Steepest Descent and Armijo Line Search. This has been used for the minimization phase as follows:
m
j j
k k
x g r x f r x
1 ( )
1 )
( ) ,
( , (15)
where f(x) is the sum of squared differences between the variables and their corresponding target values (i.e. the original objective function), gj(x), j=1,...,m, are the
constraints of the proposed model, and rk is the penalty parameter. The repeated
application of an unconstrained minimization technique to the function Φ(x), for a decremented sequence of values of the penalty parameter rk, leads to convergence of the
corresponding solutions to the solution of the original (constrained) problem, with feasibility standing for each one of the intermediate solutions.
the solution an accuracy of 10-3, while the maximum number of iterations was set to 500 for all the loops of the algorithm. This maximum number of iterations proved to be enough for obtaining the solution in almost all experiments. In certain cases, however, in which the solution could not be detected after these iterations, re-initialization to a different feasible staring point was considered as an alternative. The validity of the results obtained has been double-checked using a modification of the Particle Swarm Optimization (PSO) method for locating all the global minima of an objective function (Parsopoulos and Vrahatis 2001). This involves setting a threshold, beyond which particles of the population bearing lower function values are isolated. Following that, stretching (Parsopoulos et al. 2001) or deflation is performed at this point in order to repel the rest of the swarm (population) from moving toward it. Finally, a local search is performed in its neighborhood, thus detecting a local minimum. Applied to the function
Φ(x), the modified PSO resulted in several local minima of the objective function as well as the global one which, has been compared to the one obtained by the Steepest Descent algorithm. The main aspects of this algorithm are shown in the pseudo-code listings of the following two subsections.
3.3.4.4.1 Pseudo-Code 1: Interior Penalty Function Method With Steepest Descent
and Armijo Line Search
Step 1
Set initial values:
r0= 10 (Penalty term’s initial value)
stop_crit1, stop_crit2 = 0 (stopping criteria) iter1, iter2 = 0 (iteration counters)
MaxIt = 500 (maximum iterations)
x0 (initial feasible, randomly taken, approximation of the solution)
xlast = x0 (auxiliary parameter)
xold = x0 (auxiliary parameter)
r = r0 (penalty term variable)
acc = 10-3 (desired accuracy)
Optimal vs. Required Defence Expenditure 89
Step 2
WHILE (stop_crit1 = 0) AND (iter1 < MaxIt) DO Step 2.1
Set iter1 = iter1+1, iter2 = 0. Step 2.2
(* Starting Gradient Descent phase of the algorithm *) WHILE (stop_crit2 = 0) AND (iter2 < MaxIt) DO
Step 2.2.1
Set h = h0 , iter2 = iter2 +1 and xnew = xold–h Φ(xold, r).
Step 2.2.2
(* Perform Armijo Line Search to find the optimal step size *) WHILE ( Φ(xnew, r) - Φ(xold, r) > -0.5 h ||Φ(xold, r)||2 ) DO
Set h = 0.5 h.
Re-calculate xnew = xold–h Φ(xold, r).
END WHILE (* End of Armijo Line Search *) Step 2.2.3
IF ||Φ(xnew, r)||≤ acc THEN
stop_crit2 = 1 ELSE
xold = xnew
END IF
END WHILE (* End of Gradient Descent phase *) Step 2.3
IF ||xnew–xlast||≤ acc THEN
stop_crit1 = 1 ELSE
r = 0.1 r xlast = xnew
xold = xnew
END IF
END WHILE
Step 3
Print the final solution xnew and the rest statistics (total iterations, Armijo iterations etc.).
3.3.4.4.2 Pseudo-Code 2: Particle Swarm Optimization Method
Step 1
Set a threshold ε > 0 and a number of desired minima, N. Step 2
Initialize randomly the population, velocities and the parameters of PSO. Set the set of
found minima, L = . Step 3
Set the maximum number of iterations, MaxIt, and the counter iter = 0. Step 4
WHILE card(L) N AND iter < MaxIt DO Step 4.1
Set iter = iter +1 and update PSO’s inertia weight. Step 4.2
Find the best particle, xbest, of the swarm and check its value Φ(xbest).
Step 4.3
IF Φ(xbest)≤ ε THEN
Isolate xbestand perform local search around it and add the corresponding
solution to L.
Add a new particle, randomly chosen, into the swarm.
Apply Deflation at xbestby substituting the function Φ(x) with
|| || ) ( best x x x
or apply Stretching by substituting Φ(x) with
( ) ( )
tanh 1 ) ( ) ( sign 2 γ G(x) H(x) 2 best best x G x G x x , where
sign( ( ) ( )) 1
|| || 2 ) ( )
( 1
best
best x x
x x x
x
Optimal vs. Required Defence Expenditure 91
γ2 = 1, μ = 10-10.
END IF END WHILE Step 5
Print all elements of L and other desired parameters.
Thus, the solutions were verified and then used for conclusions extraction.
3.3.4.4.3 Fixed versus variable weighting scheme
Multiplying a term of the quadratic penalty function with a weight w>1, steepens the function at the direction of the corresponding variables, without, however, changing the nonlinear constraints implied by the model. This may result in optimal values that lie closer to the target values, for these variables. The same effect may be achieved, if the target values are properly increased.
Let xi be the variable under consideration. Then, the first partial derivative of the
penalty function Φ(x, rk) in xi is defined as
m j j k g r f 1 i i i 1 x xx , (16)
where 2
1 ) ( ) ( j m j j t x x f
is the sum of the squared differences of the variables and
their corresponding target values. Thus, after the multiplication with w,
) ( 2
xi w xi ti
f (17)
If, instead of multiplying by w, an offset a is added to the target value of xi, then
x t a
f
i
i
2
xi (18)
These two forms of the first partial derivative of f, are equal if
1 w a t
xi i (19)
3.4 POLICY CONSIDERATIONS
The analysis that follows is based on prior work on the conflict between Greece and Turkey, pointing out the importance of human resources in the arms race between the two sides (Andreou and Zombanakis 2000). This means that there are three possible strategies that may be followed concerning the emphasis placed on resources. Two strategies emphasise human or property resources alone and a third one, using both property and human resources simultaneously. Emphasis on human resources is described by setting the Greek population rate to increase by about 1.5% to 2%, and the corresponding Cypriot figure to remain close to zero. This difference in the population growth rates of the two allies will thus be equal to the Turkish population growth rate, keeping the two conflicting sides in a balance according to the relative security criterion RSCG, a very ambitious target indeed! Emphasis on property resources, capital
equipment in particular, is expressed by setting the GDP growth rates of the two allies to
5%. All three strategies must then be compared to a neutral, “reference” strategy in the
sense that it does not stress the importance of either property or human resources. Each of these strategies, in its turn, involves four possible scenarios as it is usually the case in
a typical arms race examined via game theory, or in the context of the “prisoner’s dilemma” (Majeski 1984). We assign, therefore, increasing or decreasing future values to the GDP shares of defence expenditure of Greece and Cyprus on one hand and Turkey on another17, thus referring to the following four scenarios, with the terms
“reduction” and “escalation” suggesting a respective decrease or increase of the GDP
share of defence expenditure of the country or countries involved: 1 - Both sides escalate, 2 - Greece and Cyprus escalate and Turkey reduces, 3 - Turkey escalates and Greece and Cyprus reduce and 4 - Both sides reduce18.
17
The choice of the defence expenditure as a share of the GDP rather than the level of the military expenditure itself is widely used in the literature and aims at introducing, to a certain extent at least, the question of sustainability of the defence burden by relating it to the total output of an economy.
18
Optimal vs. Required Defence Expenditure 93
3.4.1 Arms Race: Both Sides Escalate (Scenario 1)
In case that both conflicting sides, i.e. Greece and Cyprus on one hand and Turkey on another, pursue escalation tactics the average optimal Greek and Cypriot GDP share of defence expenditure stands at about 3.5% for the decade under consideration. This is a very reasonable figure to a large extent, although slightly higher, compared to the corresponding figures of most EU and NATO members. The fact remains, however, that this figure for the two allies reaches as high as 6.0% to 6.5% in certain cases, depending on the time profile of their armament programmes. It is interesting to point out, however, that the optimal defence expenditure figure, as a percentage of GDP, is remarkably stable on the average at about 3.4% to 3.6% for both allies, irrespective of strategies chosen. However, the average alliance relative security, as this is measured by RSCG, for the period under consideration obtains its highest optimal value when
preponderance of human resources alone is assumed. This means that maximising the GDP share of defence expenditure alone, by itself, is not the only recipe for security maximisation, especially in the case of the Greek-Turkish arms race, in which the role of human resources is leading.
The deviations of the optimal values derived by the algorithm from their respective actual observations are a further interesting point to observe. It is important to stress at
this point that the values derived are “optimal” only from the economics point of view
that is compatible to the constraints imposed by the model. Such values, therefore, are expected to differ compared to the corresponding actual values which can be considered
as “de facto optimal” since their choice involves, in addition, geopolitical and strategic
placed on property resources. This is to a large extent, expected since it reflects the high cost of transforming the defence mechanism from a manpower-intensive complex to a defence mechanism focusing on small-numbered efficient forces armed with very expensive modern equipment, given the constraint imposed by the Greek economy. On the contrary, average defence overspending is slightly higher than 10% in the case of Cyprus, for all strategies involved, indicating that the Cypriot GDP share of defence spending is close to its optimal level. The extent to which this is a policy option or, instead, a result of a supply constraint remains to be seen as a matter of further research. It is important to concentrate, finally, on the security level as this is measured by RSCG
Optimal vs. Required Defence Expenditure 95
3.4.2 Offensive Alliance Tactics: Greece and Cyprus Escalate while Turkey
Reduces (Scenario 2)
This scenario assumes offensive tactics on the part of the alliance, this driving the relative security factor RSCG to considerably higher levels compared to the arms race
scenario previously analysed, particularly if emphasis is placed on property resources, while the average optimal GDP share of defence expenditure barely exceeds 3.5% for both allies. It is most interesting to observe with reference to the policy considerations,
as these are derived on the basis of the “reference” strategy, that the optimal values
derived for both the relative security factor and the GDP shares of defence expenditure for the two allies are identical to those derived according to the fourth scenario of mutual disarmament by both the allies and Turkey which we shall consider below. This means that the reduction of defence expenditure by the Turkish side is the decisive element that affects the decision of the allied side concerning its military spending and, consequently, the performanceof the model in terms of optimal values. On the contrary, the extent to which the Allies will move to disarmament policies or not plays no role whatsoever.
3.4.3 Defensive Alliance Tactics: Greece and Cyprus Reduce while Turkey
Escalates (Scenario 3)
As expected, the relative security factor is lower in this case compared to the scenario previously analysed, as a result of the defence expenditure reduction from the part of the alliance in parallel to the offensive Turkish tactics. The average GDP shares of defence expenditure, which are suggested as optimal, however, are remarkably fixed at about 3.5% for both allies, with maximum figures not exceeding 6.5% for Greece and about 6.0% for Cyprus. This simply means that as long as Turkey follows offensive defence policies, the two allies do not have any room for defence expenditures reduction. It seems, indeed, that the mobilisation of both categories of resources still does not seem to contribute to better defence performance, meaning that the economies are already close to their optimal defence expenditure levels.
The outstanding role of Turkey in its arms race against Greece and Cyprus is indicated very clearly in the context of this scenario, as it has been the case in scenario
2. To show this, one needs to resort once more to the “reference” strategy that reflects
reality clearer than any of the others, since it is relieved of any form of emphasis on either resource category. We can thus observe that the optimal values suggested for the GDP shares of defence expenditure of both allies, as well as for the relative security factor RSCG are identical to those derived in the case of the first scenario, according to
which both sides escalate. It is evident, therefore, once again that the role of Turkey in the arms race against Greece and Cyprus is to dictate the intensity of this race, leaving the opposite side no room to mitigate this influence.
Optimal vs. Required Defence Expenditure 97
superiority of the use ofproperty resources is obvious in this case as well, in which the optimal value attained falls short with respect to the actual RSCG by only 23% against
40% to 50% of the remaining strategies tested.
3.4.4 Mutual Disarmament Agreement: Both Sides Reduce (Scenario 4)
No matter how unrealistic this scenario appears, one must consider it for the sake of a complete analysis. It seems natural that diverting resources away from defence expenditure to alternative, non-defence activities reduces the optimal values suggested by the algorithm for certain observations, even if the average optimal GDP shares of defence expenditure remain close to 3.5% for both allies. In fact, this is the only scenario examined thus far in which placing emphasis on both property and human resources allows the Greek economy to restrict the maximum annual defence burdento 5.5% instead of 6.5% which has been the case thus far. This should be regarded as a blessing given the absence of a Turkish threat, since it suggests that the economy is allowed to pursue its defence programme, with fewer resources devoted to it, asis stated by assumption. This, of course, allows for a considerable peace dividend for the Greek economy. Unfortunately, this does not seem to be the case for Cyprus which, even in this case,is compelled to devote to defence spending shares as high as 6.0% of its GDP19. It is finally comforting to observe that, in an environment of mutual disarmament policies on the part of Greece and Cyprus on one hand and Turkey on the other, the relative security factor between the two allies can reach rather high values on certain occasions, particularly if property resources are mobilised.
From the point of view of deviations between actual and optimal values, the mutual reduction scenario appears to be the least costly, for the Greek side at least, when emphasis is placed on human resources, in the case of which the optimal value of the GDP share of defence expenditure is some 22% lower than the corresponding actual. This being the least demanding scenario, since it involves mutual disarmament policies from both the allies and Turkey, does not require expensive, property-resource tactics to
19
face an arms race. It is considered, therefore, reasonable that it points towards human resources as the least costly solution. Cyprus, on the other hand, seems to be indifferent in this case, between shifting to property or human resources, with the corresponding average deviations being of the order of about 11%. Despite this “preference” towards human resources in the context of a mutual disarmament scenario, it appears that the relative security is best attained when emphasis is given to property resources, an expensive but efficient and competitive strategy.
3.4.5 A Variable-Weight Scheme
The optimal control algorithm we have used allows for the option of expressing the emphasis placed on certain variables not only by means of a specific target value selection but, in addition, by increasing the weight assigned to the deviation of the variable requiring emphasis from its target value. We have thus decided to try this alternative by assigning a double weight to the variables representing the Greek and Cypriot population in order to indicate our emphasis on human resources. Preponderance of property resources, on the other hand, is demonstrated by a double weight on the GDP variable of the two allies.
It is interesting to see that the optimal values for the GDP share of the Greek and Cypriot defence expenditure are somewhat higher compared to those obtained by expressing emphasis via target selection, without, however, reaching the actual defence expenditure figures attained on certain occasions in the past. It is important to point out, therefore, that the picture concerning optimal defence expenditure remains broadly the same in this experiment as well, despite the fact that the optimal values obtained on the basis of the variable-weighting scheme are less restrictive compared to those under the fixed-weighting scheme. One may thus simply argue that according to the variable-weighting scheme the peace dividend approximated by the differences between the optimal and the actual defence expenditure figures for the two allies appears to be somewhat less costly. It is much more important to point out that in both the fixed and the variable weighting schemes the major problem for the two allies, as this is revealed
Optimal vs. Required Defence Expenditure 99
role is always underlined since the intentions of Turkey to escalate or reduce its defence expenditure seem to dictate the corresponding moves to Greece and Cyprus in all cases.
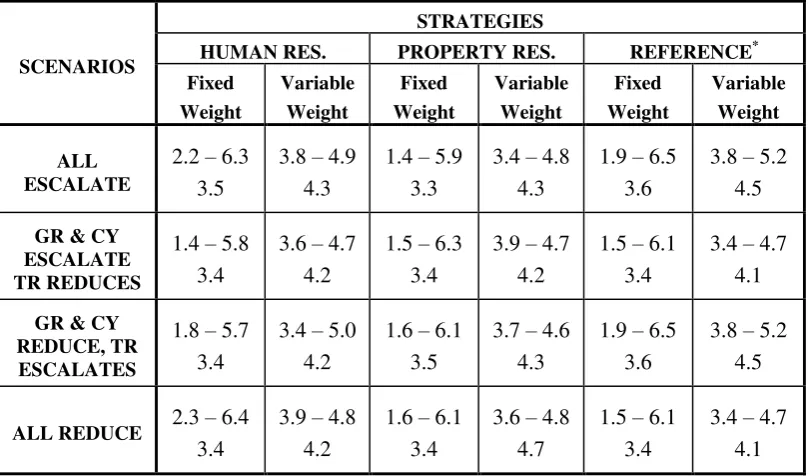
[image:34.595.111.516.253.491.2]The results of the constrained optimization procedure for the fixed and the variable-weighting schemes are listed in Table 5 for Greece and Table 6 for Cyprus.
Table 5: Constrained optimization results: optimal defence expenditure / GDP for Greece (extreme values and mean)
SCENARIOS
STRATEGIES
HUMAN RES. PROPERTY RES. REFERENCE*
Fixed Weight Variable Weight Fixed Weight Variable Weight Fixed Weight Variable Weight ALL ESCALATE
2.2 – 6.3 3.5
3.8 – 4.9 4.3
1.4 – 5.9 3.3
3.4 – 4.8 4.3
1.9 – 6.5 3.6
3.8 – 5.2 4.5
GR & CY ESCALATE TR REDUCES
1.4 – 5.8 3.4
3.6 – 4.7 4.2
1.5 – 6.3 3.4
3.9 – 4.7 4.2
1.5 – 6.1 3.4
3.4 – 4.7 4.1
GR & CY REDUCE, TR ESCALATES
1.8 – 5.7 3.4
3.4 – 5.0 4.2
1.6 – 6.1 3.5
3.7 – 4.6 4.3
1.9 – 6.5 3.6
3.8 – 5.2 4.5
ALL REDUCE 2.3 – 6.4
3.4
3.9 – 4.8 4.2
1.6 – 6.1 3.4
3.6 – 4.8 4.7
1.5 – 6.1 3.4
3.4 – 4.7 4.1
* The Reference strategy is characterized by complete absence of any form of emphasis on either of the two resource categories.
3.5 CONCLUSIONS
The analysis presented above leads to the following interesting conclusions:
defence expenditure figures, therefore, can be considered as reflecting their preferred positions taking into consideration, in addition to the budget constraint, geopolitical and strategic ones that do not enter our constraints structure. One may, thus, argue that this excessive expenditure measures the costs suffered by the alliance members due to the Greek - Turkish arms race and can be taken to approximate the peace dividend involved. An immediate consequence of excessive defence expenditure is that the relative security coefficient describing the alliance security status versus Turkey is much higher compared to its optimal values.
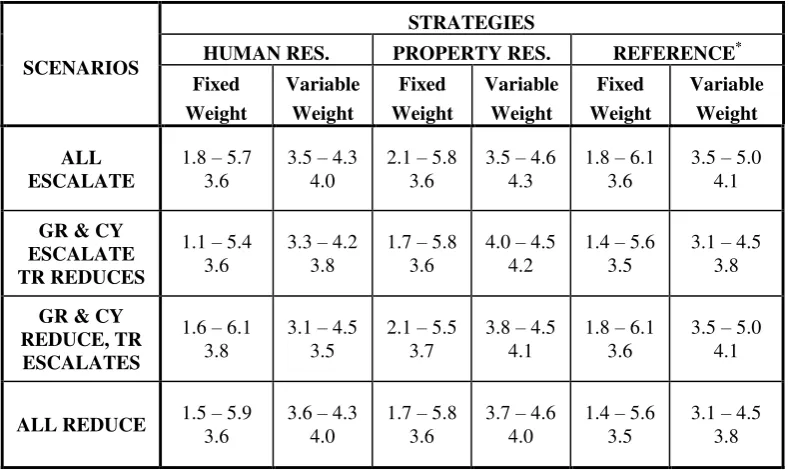
Table 6: Constrained optimization results: Optimal defence expenditure / GDP for Cyprus (extreme values and mean)
SCENARIOS
STRATEGIES
HUMAN RES. PROPERTY RES. REFERENCE* Fixed Weight Variable Weight Fixed Weight Variable Weight Fixed Weight Variable Weight ALL ESCALATE
1.8 – 5.7 3.6
3.5 – 4.3 4.0
2.1 – 5.8 3.6
3.5 – 4.6 4.3
1.8 – 6.1 3.6
3.5 – 5.0 4.1
GR & CY ESCALATE TR REDUCES
1.1 – 5.4 3.6
3.3 – 4.2 3.8
1.7 – 5.8 3.6
4.0 – 4.5 4.2
1.4 – 5.6 3.5
3.1 – 4.5 3.8
GR & CY REDUCE, TR ESCALATES
1.6 – 6.1 3.8
3.1 – 4.5 3.5
2.1 – 5.5 3.7
3.8 – 4.5 4.1
1.8 – 6.1 3.6
3.5 – 5.0 4.1
ALL REDUCE 1.5 – 5.9
3.6
3.6 – 4.3 4.0
1.7 – 5.8 3.6
3.7 – 4.6 4.0
1.4 – 5.6 3.5
3.1 – 4.5 3.8
* The Reference strategy is characterized by complete absence of any form of emphasis on either of the two resource categories.
Optimal vs. Required Defence Expenditure 101
Turkey possesses a weapon of momentous importance in its conflict against Greece and Cyprus, namely that of financial warfare which may lead the economies of its adversaries to their limits.
iii. Placing emphasis on capital resources seems to yield optimal values, which are closer to the actual ones. This finding leads to the conclusion that preponderance of property resources over human resources, a feature of modern warfare philosophy, may be justified given that it yields optimal values which are, in most cases, closer to those actually attained, indicating an expensive, however desirable policy, to the extent that the high actual GDP shares of defence expenditure are considered necessary.
3.6 REFERENCES
Andreou, A.S. and Zombanakis, G.A. (2000) Financial Versus Human Resources in the Greek-Turkish Arms Race. A Forecasting Investigation Using Artificial Neural
Networks. Defence and Peace Economics11(4), 403 - 426.
Andreou, A.S. and Zombanakis, G.A. (2001) A Neural Network Measurement of Relative Military Security: The Case of Greece and Cyprus. Defence and Peace Economics, (Forthcoming).
Antonakis, N. (1996) Military Expenditure and Economic Growth in Less Developed Countries. Economia Internazionale 49(3), 329-346.
Antonakis, N. (1997) Military Expenditure and Economic Growth in Greece. Journal of Peace Research 34(1), 89-100.
Balfousias, A. and Stavrinos, V.G. (1996) The Greek Military Sector and Macroeconomic Effects of Military Spending in Greece. In The Peace Dividend, Edited by N.P. Gleditsch, O. Bjerkholt, A. Cappelen, R.P. Smith and J.P. Dunne. North Holland.
Benoit, E. (1978), ‘Growth and Defence in Developing Countries’, Economic Development and Cultural Change, v. 26, no. 2, pp. 271-280.
Relationships. Defence Economics1(3), 179-195.
Buck, D., Hartley, K. and Hooper, N. (1993) Defence Research and Development, Crowding Out and the Peace Dividend. Defence Economics 4, 161-178.
Chan, S. (1985) The Impact of Defense Spending on Economic Performance: A Survey of Evidence and Problems. Orbis29(2), 403-434.
Chaw G.C. (1975) Analysis and Control of Dynamic Economic Systems, Wiley.
Deger, S. (1986) Military Expenditure in Third World Countries. The Economic Effects. London: Routledge.
Ehrlich, I. and Lui, F. (1997) The Problem of Population and Growth: A Review of the Literature from Malthus to Contemporary Models of Endogenous Population and Endogenous Growth. Journal of Economic Dynamics and Control 21(1), 205 – 242. Goertz, G. and Diehl, P.F. (1986) Measuring Military Allocations: A Comparison of
Different Approaches. Journal of Conflict Resolution, 30, 553-581. Greek Ministry of Defence (2000) The White Book. Athens.
Hartley, K. and Hooper, N. (1990) The Economics of Defence, Disarmament, and Peace: An Annotated Bibliography. Aldershot & Brookfield, VT: Elgar.
Hartley, K. and Sandler, T. (1995) The Economics of Defence. U.K.: Cambridge University Press.
Hartley, K. and Sandler. T. (eds.) (1990) The Economics of Defence Spending: An International Survey. London: Routledge.
Herrera, R. (1994) Statistics on Military Expenditure in Developing Countries: Concepts, Methodological Problems and Sources. Paris: OECD.
Isard, W. and Anderton, C.H. (1992) Survey of the Peace Economics Literature. In the Economics of Arms Reduction and the Peace Process: Contributions from Peace
Economics and Peace Science, edited by W. Isard and C.H. Anderton. Amsterdam:
Elsevier/North Holland, 1-55.
Klein, L.R., Fu-chen Lo and McKibbin, W. (eds). (1995) Arms Reduction: Economic Implications in the Post-Cold War Era. Tokyo: United Nations University Press. Kollias, C. (1994) The Economic Effects of Defence Spending in Greece 1963-1990.