IoT enabled Video Surveillance System using Raspberry Pi
Hrishikesh Santosh Uttekar
1Rucha H. Patil
2Maya V. Maskar
3Mr. C.R Patil
41,2,3,4
Department of Information Technology
1,2,3,4
JSPM’s Jaywantrao Sawant Polytechnic Hadapsar, Pune, Maharashtra, India
Abstract— Due to increase of Technology in Medical science there is a significant growth is seeing in organ transplantation. Most of the times receiver’s life span can be predict based on his /her health conditions. But this may not be true in case of Liver transplantation; this is mainly due to complicated working structure of liver and its unexplainable importance in functioning of human body. More often the predicted life span of the liver transplant receiver end quite early. So, to predict the life span of reciever data mining can be a advantage. So, propose model uses hidden markov model as a learning process which is powered with Dempster–Shafer reasoning.
Key words: Motion Detection, OpenCV, AWS, Raspberry Pi, Video Surveillance, Internet of Things, Google Drive
I. INTRODUCTION
The Internet of things (IoT) is the connection of physical gadgets, for example, vehicles, home apparatuses, and different things inserted with hardware, programming, sensors, and system availability which empower these things to associate and trade information. Everything is separately recognizable through its installed processing framework yet can between work inside the current Internet structure. The idea of IoT is as of now being utilized in a few fields, for example, rural industry, car industry, restorative industry and obviously, in security and reconnaissance. IoT expects utilization of minimal effort incontrollable and low power devouring gadgets with controlled antagonistic impacts on nature.
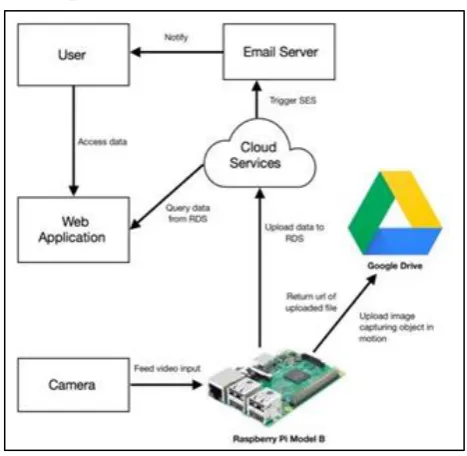
[image:1.595.311.545.122.350.2]Video Surveillance systems have been an extremely essential part of security systems installed in all types of offices, schools, hotels, businesses and even people‟s homes. The traditional methods of having around-the-clock surveillance using CCTV systems bore great burdens in the form of costs and maintenance to the consumer. They also lacked communication with other devices and were restricted to the sphere in which the system existed. The need of a connected surveillance system is higher than ever today, as there is a constant need by users to monitor people and entities that are dear to them and not everybody is capable of meeting the high prices and costs of these systems. Therefore, with the introduction of small and smart standalone computers such as the Raspberry Pi, any user can develop their own surveillance systems that are not just isolated systems, but ones that also interact with various other devices and infrastructures. Businesses can also provide such products at much lower costs now, very much in contrast to the systems provided in the past which were both costly and also required a lot of manual monitoring.
Fig. 1. Surveillance System Architecture
Applications such as Video Surveillance have become palpably better by their incorporation in the Internet of Things system, which is merely just connecting several devices and transferring relevant data from one to another, preferably in real-time.
In this paper, is further elaborated, a cost-effective surveillance system that has been developed using the popular background subtraction method to detect motion. The system also incorporates various other features using services provided by Amazon Web Services, such as SES for notifying the user via e-mail and AWS RDS for storing relevant data. Google drive has been used to store images on cloud to make it easily accessible to the user. A client-side GUI for users has also been developed, to view data in a user-friendly, interactive format and also to gain relevant insights from them. Hence, an IoT based system has been successfully implemented using the Raspberry Pi, AWS as well as Google Drive.
II. RELATED WORK
following the detection. The method proposed in [4] uses a combination of temporal frame differences and background subtraction which can successfully detect slow moving targets as well. To improve the accuracy, a cross-correlation method is adopted for better results regarding slow and stationary objects and background updating is employed. A three-tier based approach was proposed in [5], one for efficiently determining the background (BM Module) using rapid matching followed by accurate matching, second being a novel block based entropy evaluation method for identification of block candidates of moving targets, and third being the object extraction (OE Module) which examined every block to identify a moving object.
The system proposed in this paper focus primarily on the intercommunication of devices and services to build a successful working surveillance system. It is highly capable and will work with any of the latest motion detection algorithms that have been proposed up till today.
III. MOTIVATION
Existing systems that are commonly in use monitor areas, leaving their footage to be reviewed at a later stage. Alternatively, there exist many common security systems that serve as alert systems upon the intrusion of an infiltrator via one or many entry points, mostly to serve as a security system for residents residing within an apartment or building at the time. However, existing systems are not always area or room specific, and do not alert the user about an infiltration, irrespective of the user‟s location. In addition, none are implemented using systems akin to the Raspberry Pi.
IV. IMPLEMENTATION
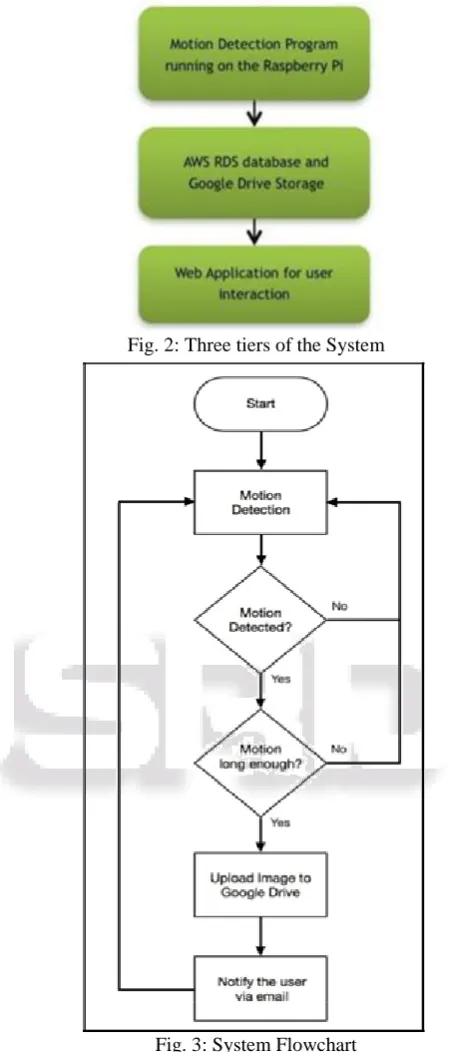
The system uses three-tier architecture, where the first tier is the background subtraction algorithm running to detect motion that keeps constantly running in a loop triggering certain functions when deemed necessary. The second tier is the database and cloud storage which stores important data in cloud servers. It also includes the e-mail servers that aid in notifying the user in real -time. The third and final tier is the part of the system that experiences user interaction. This includes a web application that has been developed so that the user can observe information related to their system. The system is essentially divided into various steps or processes as listed below:
1) Video feed is continuously transferred from USB Camera to Raspberry Pi.
2) Motion detection script constantly running the background uses these input frames to make a decision based on certain parameters.
3) If motion is detected, and is long enough to be regarded as a significant motion, the frame in which motion is detected is immediately uploaded to the drive in cloud. 4) User is notified with relevant information such as motion
start time along with an image URL that links to the image uploaded to the drive in previous step.
5) Motion time is uploaded into the RDS in cloud for future analysis and visualization.
User can log into a web application using given credentials to view important information regarding their systems and also visualize the data uploaded to database.
[image:2.595.300.529.67.594.2]Fig. 2: Three tiers of the System
Fig. 3: System Flowchart
A. Motion Detection using Background Subtraction
The primary function of the system is to detect motion that occurs in a video stream, which is being captured and fed as input continuously. The method used must be able to make the decision in real-time and must therefore be quick and accurate. Motion detection using background subtraction is essentially performed by just comparing successive frames, and if significant change is noticed then motion is said to be occurred.
The system also provides a provision where in motions that occur with minimal time gap be considered as one single motion. The time elapsed between successive motions is calculated for every motion detected and is considered different from the preceding detected motion only if the actual time elapsed is greater than or equal to some minimum time gap as specified by either the user or developer. This time gap can vary according to what type of environment the surveillance system is used for.
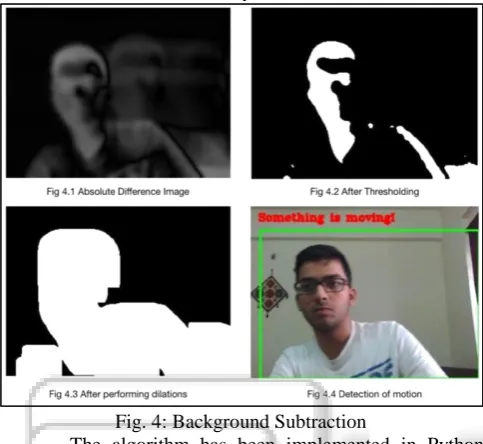
Fig. 4: Background Subtraction
The algorithm has been implemented in Python using the OpenCV module. The methods used on successive frames to detect motion are as described below:
First each frame is captured by the camera and transferred to the Raspberry Pi. If the frame is valid, then it is used for upcoming operations.
The frame is resized to half the size to reduce computations and is then converted to a single channel image. This makes finding the absolute difference between frames easy and less expensive.
The image is blurred using Gaussian Blur to de-noise the image and is then fed to the accumulate Weighted function to model the background dynamically.
The absolute difference is calculated between the current frame and the dynamic background to obtain Fig. 4.1 in which motion can be observed.
This image is then applied to a threshold so that only significant changes are considered, and is dilated to form proper solid entities that depict entity that caused the motion.
Finally contours are found in this dilated image, and only if contours are larger than a certain pre-defined threshold then a motion is said to be detected.
Finally a bounding rectangle is drawn over the entity that caused the motion by obtaining the coordinates of the contour and passing them as parameters to draw the rectangle.
This algorithm will tend to give inaccurate results in low light conditions. It detects changes in lighting as motion and does not perform to its optimum when there are shadows in the video. It also detects non-threatening motion such as displacement of household objects, which are nothing but false results.
B. Storing image and relevant data on Cloud server In the Internet of Things era there is a need for this type of surveillance system to have the obtained data to be accessible and available to other authorized systems and applications, and not just be stored locally in the Raspberry Pi. The system satisfies this need by using a popular AWS service called RDS (Relational Database System) which is hosted on a virtual instance in the cloud. This remote storage makes it readily accessible to other applications that can give really good deductions from the data. It also helps the user to view information obtained from their systems in real- time from any authorized device that has access to the network.
[image:3.595.307.552.308.461.2]The system uses the PyMySql library to establish connection to the MySQL server in the cloud and enables execution of SQL queries to insert or update data in the table. To store images of the instances when motions are detected, popular cloud storage service „Google Drive‟ is used. This is done using the PyDrive API provided by Google to authenticate the user, upload image to drive and to extract a shareable link to the image uploaded directly from our main program.
Fig. 5: Motion time and image URL entries in AWS RDS
C. Notifying the User
Simple Email Service is a free service provided by Amazon Web Service. This is part of our second tier which alerts the user if any motion were to occur. AWS has provided a Python module called boto3 which enables any AWS account holder to access all the services directly from their Python scripts.
On a Linux System, boto3 can be installed by using the pip package in Python: sudo pip install boto3 and the credentials can be setup by specifying certain parameters such as the access key id, secret access key and the region in which the instance is hosted.
This feature is used to access the cloud services such as Amazon SES that notifies the user via e-mail, where the email contains important information such as the time motion was detected. It also contains a link to the image uploaded into the Google drive for that corresponding motion.
D. Data visualization and User interaction
credentials, and can subsequently view all the stored data regarding foreign movements detected in the form of various interactive graphs. The user could even choose to view the stored data in raw text form.
Python‟s Flask module was used to develop the web portal, along with HTML and CSS for the UI, while another couple of Python libraries, Bokeh and Pandas are used to plot and render the interactive graphs from which the user can infer a lot of information such as rate of occurrences of motion, average duration of motions, etc.
V. EXPERIMENT RESULTS & ANALYSIS
[image:4.595.121.528.157.448.2]The system is developed to detect motion in real-time and respond to significant motions appropriately by notifying the user immediately about this anomaly and logging important information such as start and end of detected motion times. It also uploads and stores the image frame in which motion was detected.
Fig. 6: Motion with single entity
Results of earlier experiments with movement caused by a single entity are as shown in the collection of figures in Fig. 6 which depicts the entry of an entity from the bottom of the frame and gradually moving upwards. The region of detection of the motion has been highlighted by a bounded green rectangle.
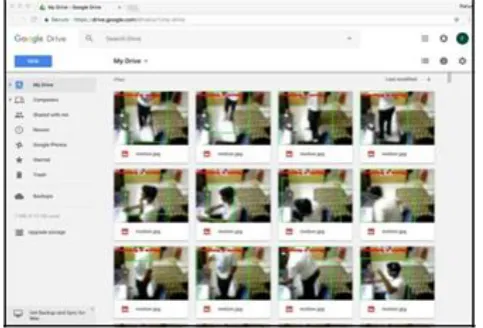
[image:4.595.299.523.159.417.2]On detection of the motion, the image is immediately uploaded to Google Drive. After successful upload of the file, the image URL or link to the image corresponding to the motion is extracted.
Fig. 7: Google drive with uploaded images
The URL of the image in the drive for the current motion is extracted and is sent along with start time of the motion in the body of the e-mail. The user receives an email notification on any device which has the user‟s email account as a connected account.
[image:4.595.312.546.500.638.2] [image:4.595.47.289.590.754.2]The e-mail received by the user contains time of start of motion as well as image captured by camera as shown in Fig. 8.
Fig. 8: E-mail Notification received by User At the end of the motion, the end time of the motion is also logged into the RDS as it helps in identifying various important factors in the future.
To make the system wholesome, it was essential to have further interaction between the user and the system. For the same, a web application was developed that allows authorized users to view information limited to just their surveillance system.
Fig. 9: Application home page
Fig. 10: Time Duration graph – 1
[image:5.595.314.537.67.243.2]On clicking any of the “See Graph” buttons, the application will render different html pages which contain different types of graphs. It comes with several interactive operations such as pan, zoom, save, etc. Which can be triggered by choosing one of the many options listed as icons on the edges of the plot.
Fig. 11: Time Duration graph – 2
On choosing which graph the user want to see, Flask renders the html template on which Bokeh produces the output file as a graph. These graphs are interactive and aid the user in visualizing and analyzing the data.
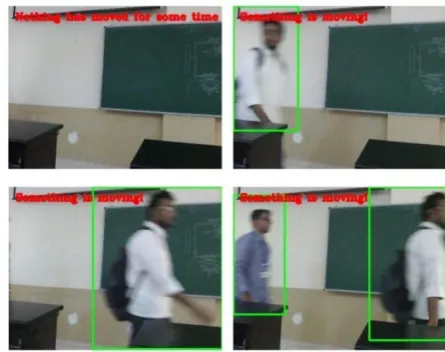
The system was later tested in a different environment where multiple entities were causing motion simultaneously. The system continued to perform accurately by detecting the motion as well as the causes and responding to this change of state, instantly and accurately as shown in Fig. 12 below.
Fig. 12: System Detects Multiple Motions and entities Internet of Things expects the processes within such systems to occur in real time. Hence, the system was tested on nearly 5 hours of surveillance video directly from the USB camera. 500 entries of times taken for various sub-processes were logged into a CSV file as the script was running. The durations for execution of each of these processes were averaged to give us an understanding of latency between various processes that can be expected in such a system.
VI. SUB-PROCESS DURATION ANALYSIS
Write Image on
R Pi
Upload image to
Drive
Upload time to RDS
Trigger sending email Average
Duration (sec)
0.0123 4.0641 0.5177 1.7907
Standard Deviation
(sec)
[image:5.595.49.291.319.497.2]0.0023 1.6671 0.0561 0.3986
Table 1: Values are rounded off to 4 decimal places
VII. SYSTEM LATENCY ANALYSIS Time it takes for user to get notified of detected
motion
Total Process
Average Duration (sec)
5.8731 6.8818
Standard Deviation
(sec)
[image:5.595.297.551.359.482.2]1.6672 1.5193
Table 2: Values are rounded off to 4 decimal places The Total process is the duration to execute all the tasks, namely writing the image to memory, uploading image to Google Drive, uploading information such as entry time and image URL to RDS, triggering sending of e-mail and finally uploading end time of the motion into RDS.
[image:5.595.307.552.508.644.2]user should receive the notification for a certain motion in a single e-mail rather than sending multiple notifications, which would be impractical. This decision was made because a near 4.1 second delay would not induce any severe consequences for a video surveillance application, plus the user gets to view the captured image by clicking the image URL added in the e-mail.
Standard deviation of durations of each of these tasks has been calculated as it is a reliable way to measure how the response times and latencies of the system vary.
VIII. CONCLUSION
Any room or section of one‟s home can easily be put under effective surveillance using the developed system. Upon the detection of foreign motion, the user is instantly notified along with the required visuals he/she requires to ascertain whether the motion is that of an infiltrator or harmless, leaving the due course of action to the user‟s discretion. By virtue of the Internet of Things concepts implemented while developing the system, the user can receive minimal-latency updates in any location as long as there exists an Internet connection. Similarly, the user is also able to access the stored data from any remote location on a computer or mobile device, provided the correct login credentials are entered.
IX. FUTURE WORK
Wide applications of Motion Detection Systems have surfaced itself in the last few years from tracking to object classification. A system that uses a deep learning model to classify the objects into simple things like “person”, “car”, and “door” has been successfully tested on our computers that possess much better performance specifications than a Raspberry Pi. This method had consumed a lot of processing time leading to a lot of delay, mainly because of lower RAM and CPU processing capability of the Raspberry Pi (1GB).
In future, the endeavor is to write a more optimized and less memory hungry algorithm for a smarter detection and could also possibly waver off some training datasets that compromises little on performance.
REFERENCES
[1] Aamir Nizam Ansari \ Mohamed Sedkyl, Neelam Sharma, Anurag Tyagil, „An Internet of Things Approach for Motion Detection using Raspberry Pi‟ in 2015 International Conference on Intelligent Computing and Internet of Things, pp. 131-134
[2] Huu-Quoc Nguyen, Ton Thi Kim Loan, Bui Dinh Mao and Eui-Nam Huh, „Low Cost Real-Time System Monitoring Using Raspberry Pi‟ in ICUFN 2015, pp. 857-859
[3] Virginia Menezes, Vamsikrishna Patchava, M. Surya Deekshith Gupta, „Surveillance and Monitoring System Using Raspberry Pi and SimpleCV‟ during 2015 International Conference on Green Computing and Internet of Things, pp. 1276-1278
[4] M. Chen, X.L. Xu, „An Improved Method for Motion Detection by Image Difference‟ in Information Science and Control Engineering 2012, 7-9 Dec