0095-1137/08/$08.00⫹0 doi:10.1128/JCM.00887-07
Copyright © 2008, American Society for Microbiology. All Rights Reserved.
Overlapping Population Structures of Nasal Isolates of
Staphylococcus aureus
from Healthy Dutch and American Individuals
䌤
Damian C. Melles,
1* Fred C. Tenover,
2Matthew J. Kuehnert,
2Hanneke Witsenboer,
3Justine K. Peeters,
4Henri A. Verbrugh,
1and Alex van Belkum
1Erasmus MC, University Medical Center Rotterdam, Department of Medical Microbiology & Infectious Diseases,
s-Gravendijkwal 230, 3015 CE Rotterdam, The Netherlands1; Division of Healthcare Quality Promotion,
Centers for Disease Control and Prevention, 1600 Clifton Road NE (G-08), Atlanta, Georgia 303332;
Department of Microbial Genomics, Keygene N.V., Agro Business Park 90, 6708 PW Wageningen,
The Netherlands3; and Erasmus MC, University Medical Center Rotterdam, Department of
Bioinformatics, Dr. Molewaterplein 50, 3015 GE Rotterdam, The Netherlands4
Received 27 April 2007/Returned for modification 26 July 2007/Accepted 23 October 2007
To understandStaphylococcus aureusnasal carriage and its relationship with subsequent disease, insight into the natural (nonclinical) bacterial population structure is essential. This study investigated whether the distributions of S. aureus genotypes that cause colonization differ by geographic locales. High-throughput amplified fragment length polymorphism (AFLP) analysis was performed on nasal isolates ofS. aureusfrom healthy American (nⴝ391) and Dutch (nⴝ829) volunteers. In total, 164,970 binary outcomes, covering 135 different markers per isolate, were scored. Methicillin resistance was defined for all strains; pulsed-field gel electrophoresis typing was performed for the American isolates. The overall population structures of the American and DutchS. aureusisolates were comparable. The same four major AFLP clusters (I to IV) and subclusters were identified for both collections. However, the Dutch methicillin-susceptibleS. aureus(MSSA) isolates were overrepresented in AFLP cluster III (Pⴝ0.0016). Furthermore, the majority of the American methicillin-resistant S. aureus isolates (90.5%) were located in AFLP cluster I (P < 0.0001). This result identifies differences in the local prevalence of certainS. aureusgenotypes. AFLP clusters II and III, which represent multilocus sequence typing clonal complexes 30 and 45, respectively, account for 46.4% of all MSSA isolates in the study, suggesting that these two lineages have evolved as extremely successful pandemic colonizers of humans. In conclusion, the overall population structures of American and Dutch nasal carriage isolates ofS. aureusare surprisingly similar, despite subtle geographic differences in the prevalence of certain
S. aureusgenotypes.
Since many Staphylococcus aureusinfections occur in per-sons with prior bacterial colonization of the anterior nares, knowledge of the human nasal colonization state is of clinical importance (12). In addition, since some strains ofS. aureus
appear to have a higher potential to cause disease than others, it is essential that studies of nasal carriage include bacterial strain typing information (6, 12). Studies ofS. aureus nasal carriage have been performed in various geographic regions, including the United States (3) and The Netherlands (14), and some of these studies included epidemiological typing of the bacterial isolates obtained (3, 6). However, whether the distri-butions ofS. aureusgenotypes from various geographical lo-cales differ significantly or are rather similar remains unclear. We here describe the first high-throughput genotyping effort for large numbers of nonclinical isolates of S. aureus from healthy volunteers living in the United States and The Neth-erlands.
MATERIALS AND METHODS
Bacterial strains.The bacterial strains from the United States that were included in this study were collected from civilian, noninstitutionalized U.S. citizens during the National Health and Nutrition Examination Survey in 2001 to
2002. In total, nasal samples from 9,622 persons (ⱖ1 year old) were obtained as
previously described (3).S. aureuswas isolated from 2,964 individuals over the
2-year period. Every 10th methicillin-susceptibleS. aureus(MSSA) isolate (n⫽
307) and all methicillin-resistantS. aureus(MRSA) isolates (n⫽84) were
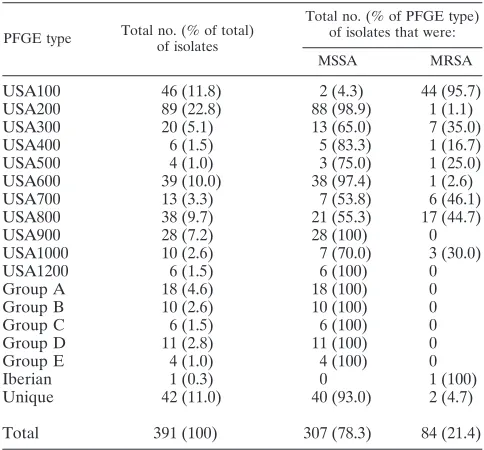
included in the study. Nine additional MRSA isolates that were excluded from the study by Kuehnert et al. (3) were included in the present study (these isolates were excluded earlier because they were obtained from persons outside the target cohort). Strain characteristics of the American isolates are presented in Table 1. Forty-two isolates demonstrated pulsed-field gel electrophoresis (PFGE) patterns that did not fit within established U.S. lineages (5).
The Dutch strains (n⫽829) were collected during two different carriage
surveys among children and the elderly. In total, 3,198 children (aged 1 to 19 years) from the city of Rotterdam that participated in a national meningococcal
vaccination campaign (in 2002) were enrolled.S. aureuswas isolated from 1,116
of these children (1). All isolates were stored at⫺80°C in broth containing
glycerol. A random sample of 400S. aureuscarriage isolates was drawn for this
cohort (6). The second collection originated from a community-based prospec-tive study of the elderly in Rotterdam (2). Nasal swabs were obtained from 3,851
persons over 55 years of age, between 1 April 1997 and 31 December 1999.S.
aureuswas isolated from 1,043 elderly persons (9). All isolates were stored at
⫺80°C in glycerol containing broth. A random sample of 429 carriage isolates
was drawn (6). The genotyping data and demographic characteristics for the 829 Dutch strains have been described previously (6). All Dutch isolates were MSSA;
the absence ofmecAwas confirmed by PCR assay (7). TwoS. aureusreference
strains, N315 and Mu50, both of which have been completely sequenced, were
included (4). In total, 1,222S. aureusstrains were typed by amplified fragment
length polymorphism (AFLP).
* Corresponding author. Mailing address: Erasmus MC, University Medical Center Rotterdam, Room L-313, Department of Medical Mi-crobiology & Infectious Diseases, s-Gravendijkwal 230, 3015 CE Rotter-dam, The Netherlands. Phone: 31.10.463.3510. Fax: 31.10.463.3875. E-mail: [email protected].
䌤Published ahead of print on 31 October 2007.
235
on May 16, 2020 by guest
http://jcm.asm.org/
AFLP.AFLP analysis was performed on purified DNA (MagNA Pure LC
instrument; Roche Diagnostics, Almere, The Netherlands) from all 1,222S.
aureusstrains as described by Melles et al. (6). We used the predictive software package Recomb (10) to select optimal enzyme and primer combi-nations (Keygene N.V., U.S. patent application WO 00/44937). DNA was digested with MboI and Csp6I, and the linker oligonucleotide pairs for MboI
(5⬘-CTCGTAGACTGCGTACC-3⬘and 5⬘-GATCGGTACGCAGTCTAC-3⬘)
and Csp6I (5⬘-GACGATGAGTCCTGAC-3⬘and 5⬘
-TAGTCAGGACTCAT-3⬘) were ligated. Subsequently, nonselective preamplification was performed.
In the final amplification, a labeled MboI primer containing a single selective nucleotide (either C or G) and a Csp6I primer containing two selective nucleotides (TA) were used. Amplified material was analyzed using poly-acrylamide slab gels and autoradiography. Marker fragments were scored and a binary table of fragment absence (indicated by “0”) or presence (indicated by “1”) was constructed. AFLP technology is covered by patent applications owned by Keygene N.V. (2a, 2b).
AFLP data analysis.Analysis of the AFLP data was performed as described previously (6). The method used for two-dimensional clustering of the data was agglomerative (successive) hierarchical. This clustering was performed using the unweighted-pair group method with arithmetic mean, and the similarity metric was Tanimoto. This defines similarity for binary data (0 and 1) based on the number of positive attributes that two records have in common. The resulting dendrogram (Fig. 1) was ordered by average value.
Principle-component analysis (PCA) is a standard multivariate method to reduce the multidimensional space of the data to its principle component (PC). The PC computation is displayed as a three-dimensional scatter plot in which the position along the axes shows the PCA score of the strain. PCA was used to identify subgroups of AFLP clusters as hidden by a two-dimensional representation of hierarchical clustering. The distribution of the strains in four branches was defined on the basis of PCA. Both hierarchical cluster analysis and PCA were performed using Spotfire DecisionSite 7.2 software. To compare the distributions of strain categories in different phylogenetic
lineages, Fisher’s exact test was used. A two-sidedPvalue of less than 0.05
was considered significant.
Other laboratory methods. The 391 American S. aureus isolates were screened for oxacillin resistance by using the Clinical and Laboratory Stan-dards Institute disk diffusion method as previously described (8). PFGE was
performed for the 391 AmericanS. aureusisolates by using SmaI. The PFGE
patterns were analyzed using BioNumerics (Applied Maths), and isolates were grouped into PFGE clonal types by using Dice coefficients and a value
of⬎80% relatedness (3, 5).
RESULTS
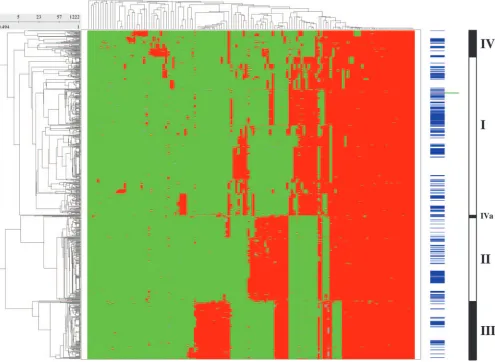
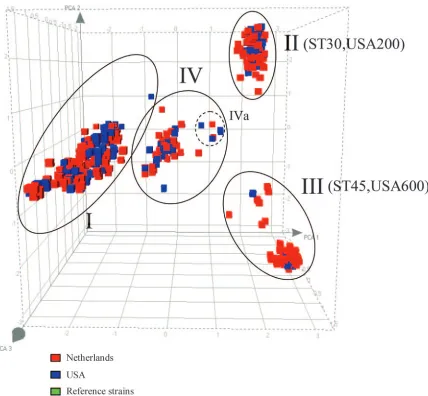
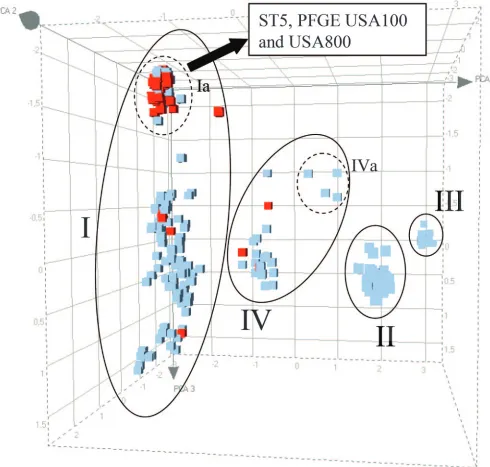
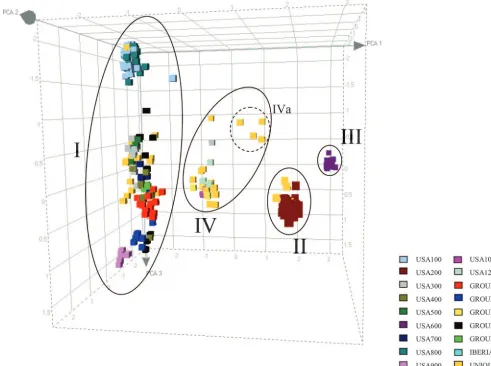
Using the set of 1,222S. aureusisolates, a total of 164,970 binary outcomes were generated, covering 135 scorable AFLP marker fragments per isolate. The AFLP data for the 829 Dutch isolates, the 391 American isolates, and the two refer-ence strains (Mu50 and N315) were subjected to two-dimen-sional hierarchical cluster analysis of which the graphical out-put is shown in Fig. 1. This figure indicates the presence of the American isolates and clearly shows that the overall popula-tion structures of the American and Dutch isolates are rather comparable: the grouping of the strains into four major AFLP clusters as defined before for the Dutch isolates remains valid (Fig. 2) (6). The American isolates do not segregate from the Dutch isolates, and no additional majorS. aureusclones were identified. Most importantly, strains of homogeneous clusters II (clonal complex 30 [CC30] by multilocus sequence typing) and III (CC45) seem to be important “S. aureuscarriage lin-eages” in both The Netherlands and the United States. How-ever, there are some differences in the distribution of the Dutch and American isolates across the major AFLP clusters (Table 2). A greater proportion of isolates of the Dutch col-lection than of the U.S. colcol-lection of strains belonged to AFLP cluster III (P ⫽ 0.0016). Additionally, all 829 Dutch strains were methicillin susceptible, whereas in the original U.S. col-lection, 75 of 2,964 (2.5%) isolates were resistant to methicillin (P⬍0.0001), with a weighted prevalence of MRSA coloniza-tion among the U.S. populacoloniza-tion of 0.8% (75 of 9,622) MRSA isolates in the U.S. cohort (3). Table 2 shows that the majority of the (American) MRSA isolates (90.5%) are located in AFLP cluster I, which is a genetically heterogeneous cluster (overrepresentation of MRSA isolates in cluster I compared to the other AFLP clusters; P ⬍ 0.0001). Furthermore, Fig. 3 shows that most MRSA strains in AFLP genetic lineage I are clustered separately in a small subcluster named Ia (embracing two PFGE lineages, USA100 and USA800, as shown in Fig. 4). Subcluster Ia embraces 24 American MSSA isolates (7.8% of all American MSSA strains included in this study), while it embraces 60 American MRSA isolates (71.4% of all American MRSA strains included in this study;P⬍0.0001).
[image:2.585.42.284.89.314.2]Figure 4 shows the comparison of AFLP and PFGE typing of the AmericanS. aureuscarriage isolates. PFGE typing con-firms the genetic homogeneity in AFLP clusters II and III as well as the relatively high genetic heterogeneity in AFLP clus-ters I and IV. The different PFGE clonal types (e.g., USA700, USA900, group A, and group B,) in AFLP cluster I are clus-tered separately, indicating the similarity between the two typ-ing methods. Furthermore, as shown in Fig. 4, AFLP analysis still identifies genetic heterogeneity among several clonal PFGE types, indicating its high discriminatory power. As de-scribed earlier, multilocus sequence typing (MLST) analyses of strains assigned to AFLP clusters I and IV also identified different clonal lineages (including CC5, CC8, CC15, CC20, and CC25 in AFLP cluster I and CC22 and CC121 in cluster IV) (6). In contrast, AFLP clusters II and III are genetically homogeneous lineages that have previously been corroborated by MLST and now are confirmed by PFGE analysis. Strains in AFLP cluster II all belong to CC30 (and PFGE type USA200), and strains in AFLP cluster III all belong to CC45 (and PFGE type USA600).
TABLE 1. Microbiological characteristics of the 391 American
S. aureusisolates
PFGE type Total no. (% of total)
of isolates
Total no. (% of PFGE type) of isolates that were:
MSSA MRSA
USA100 46 (11.8) 2 (4.3) 44 (95.7)
USA200 89 (22.8) 88 (98.9) 1 (1.1)
USA300 20 (5.1) 13 (65.0) 7 (35.0)
USA400 6 (1.5) 5 (83.3) 1 (16.7)
USA500 4 (1.0) 3 (75.0) 1 (25.0)
USA600 39 (10.0) 38 (97.4) 1 (2.6)
USA700 13 (3.3) 7 (53.8) 6 (46.1)
USA800 38 (9.7) 21 (55.3) 17 (44.7)
USA900 28 (7.2) 28 (100) 0
USA1000 10 (2.6) 7 (70.0) 3 (30.0)
USA1200 6 (1.5) 6 (100) 0
Group A 18 (4.6) 18 (100) 0
Group B 10 (2.6) 10 (100) 0
Group C 6 (1.5) 6 (100) 0
Group D 11 (2.8) 11 (100) 0
Group E 4 (1.0) 4 (100) 0
Iberian 1 (0.3) 0 1 (100)
Unique 42 (11.0) 40 (93.0) 2 (4.7)
Total 391 (100) 307 (78.3) 84 (21.4)
236 MELLES ET AL. J. CLIN. MICROBIOL.
on May 16, 2020 by guest
http://jcm.asm.org/
DISCUSSION
In the United States, the overall nasalS. aureuscolonization rate among humans was 32.4% (2001 to 2002) (3). This rate is significantly higher than the prevalence for patients admitted to Dutch hospitals (24.4%; P ⬍ 0.0001) (13). Whether this higher rate is due to the differences between the groups of volunteers from whom the strains were isolated or to different sampling methods is unknown. However, despite these differ-ences in colonization rate and origin of the strains, the popu-lation structures of American and Dutch isolates are surpris-ingly similar.
The same major AFLP clusters (I, II, III, and IV) are identified in both Dutch (n ⫽829) and American (n⫽391) community-based nasal isolates ofS. aureus. Genetically het-erogeneous AFLP cluster I was the largest cluster found, com-prising nearly half of all MSSA isolates and the majority of the MRSA isolates. However, this cluster could be subdivided in
[image:3.585.46.541.70.432.2]several subclusters corresponding with different MLST clonal complexes. Notably, genetically homogeneous AFLP clusters II and III, which represent MLST clonal complexes 30 and 45, respectively, account for 46.4% of all carriage MSSA isolates in the current study population (47.3% of the Dutch carriage isolates and 44.0% of the American MSSA carriage isolates), suggesting that these two clonal complexes have evolved to be extremely successful in colonizing humans (6). It has been shown before that these two clonal types (CC30 and CC45), as found in The Netherlands, have a seemingly different potential to cause invasive infection (11). It would be worthwhile to seek confirmation of this observation in the American setting. This confirmation would contribute to our understanding of staph-ylococcal virulence traits in relation to their clonal back-grounds. Understanding this relationship may lead to opti-mized prophylactic and treatment options for the increasing burden of staphylococcal infections.
FIG. 1. Two-dimensional hierarchical clustering of the 1,222S. aureusstrains. The green/red figure represents 164,970 binary outcomes generated by high-throughput AFLP with 135 marker fragments per strain. Marker absence corresponds with green, and marker presence corresponds with red (gray represents ambiguous positions [i.e., weak bands] that are scored as marker absence in the mathematical analyses). The dendrogram on theyaxis represents the phylogenetic clustering of the 1,222 strains. The dendrogram on thexaxis shows the clustering of the 135 AFLP markers, many of which segregate in specific groups. The colored, striped bars on the right represent the distribution of the U.S. strains (blue) and the reference strains Mu50 and N-315 (light green). The Dutch carriage strains (n⫽829) are not pointed out separately. In conjunction with PCA, four major branches (I, II, III, and IV) were identified; these are represented by the black and white bar on the right of the figure. AFLP cluster IVa has been annotated separately (between AFLP cluster I and II), because theseS. aureusstrains were assigned (arbitrarily) to cluster IV, based on PCA (Fig. 2 to 4).
on May 16, 2020 by guest
http://jcm.asm.org/
Despite the strong similarity between bothS. aureus popu-lation structures, there are also some differences. Dutch cluster III strains are overrepresented compared to their American counterparts (P ⫽ 0.0016). Furthermore, none of the Dutch nasal isolates included in the current study carried themecA
gene. In contrast, the MRSA prevalence in the American col-lection was approximately 2.5% (P⬍0.0001) (3). However, it should be emphasized that methicillin resistance for the Amer-ican isolates was tested for the total original collection, com-prising approximately 3,000S. aureusisolates. Methicillin re-sistance in the Dutch isolates was tested only for the 829 isolates included in the current study bymecA PCR, as de-scribed earlier (6). All MRSA strains isolated from the Amer-ican cohort were included in the current study, in contrast to the American MSSA isolates, which were selected at random for the current study (by 1 out of 10). Therefore, we have compared the Dutch S. aureus isolates with the American MSSA and MRSA isolates separately. The American MRSA isolates were clearly overrepresented in major AFLP
[image:4.585.79.507.65.461.2]phy-FIG. 2. PCA of the AFLP data for all 1,222S. aureusisolates. The different cubes (plotted in three-dimensional space), colored according to the source, represent every strain in the study. Each axis represents the score calculated for that strain on each PC. The four circles indicate the different phylogenetic AFLP clusters. The two reference strains (N315 and Mu50) are not visible, as they are hidden by other strains.
TABLE 2. Distribution ofS. aureusstrains (n⫽1220) in the four phylogenetic branches
AFLP cluster (clonal complex)
No. of strains (%) per AFLP cluster
Netherlandsa United States
(MSSA)
United States
(MRSA) Total
I 367 (44.3) 140 (45.6) 76 (90.5)b 583 (47.8)
II (CC30) 216 (26.1) 95 (30.9) 2 (2.4)c
313 (25.7)
III (CC45) 176 (21.2)d
40 (13.0)d
1 (1.2)e
217 (17.8)
IV 70 (8.4) 32 (10.4) 5 (6.0) 107 (8.8)
Total 829 (100) 307 (100) 84 (100) 1,220 (100)
aAll Dutch strains were MSSA.
bProportionally, more of the MRSA strains in the U.S. cohort than of all the
strains in the Dutch cohort (Fisher’s exact test;P⬍0.0001) or of the MSSA strains
in the U.S. cohort (Fisher’s exact test;P⬍0.0001) were distributed into cluster I.
cProportionally, fewer of the MRSA strains in the U.S. cohort than of all the
strains in the Dutch cohort (Fisher’s exact test;P⬍0.0001) or of the MSSA strains
in the U.S. cohort (Fisher’s exact test;P⬍0.0001) were distributed into cluster II.
dProportionally, more of the carriage strains in the Dutch cohort than of the
MSSA strains in the U.S. cohort (Fisher’s exact test;P⫽0.0016) were distributed
into cluster III.
eProportionally, fewer of the MRSA strains in the U.S. cohort than of all the
strains in the Dutch cohort (Fisher’s exact test;P⬍0.0001) or of the MSSA strains
in the U.S. cohort (Fisher’s exact test;P⫽0.0005) were distributed into cluster III.
238 MELLES ET AL. J. CLIN. MICROBIOL.
on May 16, 2020 by guest
http://jcm.asm.org/
[image:4.585.43.284.527.620.2]logenetic lineage I, and additionally, most of them clustered separately in a subcluster, named Ia. Our data clearly show that the American MRSA isolates (obtained from the open population) show significantly less genetic diversity than the MSSA carriage isolates included in this study, which is in agreement with the assumption that MRSA strains consist primarily of a limited number of highly successful pandemic clones.
PFGE typing showed that the American MSSA and MRSA
isolates in AFLP subcluster Ia are PFGE type USA100 and USA800 strains. It is known that these clonal PFGE types share the same MLST sequence type (ST 5) and spa motif (MDMGMK). Apparently, these PFGE types share the same genetic background, which is corroborated by MLST and AFLP analysis. However, McDougal et al. earlier concluded that the two clonal PFGE types carry different SCCmec
structures and had different susceptibility profiles (5). USA100 isolates cluster with representatives of the
multire-FIG. 3. Distribution of the American MSSA (n⫽307) and the American MRSA (n⫽84) isolates. PCA analysis of the AFLP data for all strains (n⫽1,222), showing only the 391 AmericanS. aureusisolates with the distribution of the MSSA versus the MRSA strains.
on May 16, 2020 by guest
http://jcm.asm.org/
[image:5.585.47.537.70.537.2]sistant New York/Japan clone containing SSCmec II, while isolates from USA800 cluster with representatives of the pediatric clone containing SSCmecIV (5). Thus, while these two lineages have diverged over time, they both appear to have retained the ability to colonize the nares of humans.
Finally, it should be emphasized that there are several dif-ferences in the demographics of the two populations surveyed, which could influence the results of this study. The DutchS.
aureusisolates were obtained from two separate cohorts, i.e.,
children under 19 years of age and elderly adults over 55 years of age, and all volunteers were living in the Rotterdam area (local region in The Netherlands). In contrast, the AmericanS.
aureusisolates were obtained from individuals covering all age
groups and living all over the country.
In conclusion, the population structures of nasal S. aureus
isolates from humans are congruent on both sides of the At-lantic. The same successful clones are present, although their relative frequencies may vary with geographic origin. Appar-ently, both MRSA and MSSA show similar epidemic behavior, with some clones being notably more successful colonizers of the human vestibulum nasi.
ACKNOWLEDGMENT
We thank Sigrid McAlister for technical assistance and data analysis.
REFERENCES
1.Bogaert, D., A. van Belkum, M. Sluijter, A. Luijendijk, R. de Groot, H. C. Rumke, H. A. Verbrugh, and P. W. Hermans.2004. Colonisation by Strep-tococcus pneumoniaeandStaphylococcus aureusin healthy children. Lancet
363:1871–1872.
2.Hofman, A., D. E. Grobbee, P. T. de Jong, and F. A. van den Ouweland.1991. Determinants of disease and disability in the elderly: the Rotterdam Elderly
Study. Eur. J. Epidemiol.7:403–422.
2a.Keygene, N. V., M. F. O. Zabeau, and P. A. J. Vos.March 1993. Selective restriction fragment amplification: a general method for DNA fingerprinting. European patent 0 534 858 B2.
2b.Keygene, N. V., M. F. O. Zabeau, and P. A. J. Vos.April 2000. Selective restriction fragment amplification: a general method for DNA fingerprint-ing. U.S. patent 6,045,994.
3.Kuehnert, M. J., D. Kruszon-Moran, H. A. Hill, G. McQuillan, S. K. McAllister, G. Fosheim, L. K. McDougal, J. Chaitram, B. Jensen, S. K. Fridkin, G. Killgore, and F. C. Tenover.2006. Prevalence ofStaphylococcus aureusnasal colonization in the
United States, 2001–2002. J. Infect. Dis.193:172–179.
[image:6.585.40.531.71.437.2]4.Kuroda, M., T. Ohta, I. Uchiyama, T. Baba, H. Yuzawa, I. Kobayashi, L. Cui, A. Oguchi, K. Aoki, Y. Nagai, J. Lian, T. Ito, M. Kanamori, H. Matsumaru, A. Maruyama, H. Murakami, A. Hosoyama, Y. Mizutani-Ui, N. K. Taka-hashi, T. Sawano, R. Inoue, C. Kaito, K. Sekimizu, H. Hirakawa, S. Kuhara, S. Goto, J. Yabuzaki, M. Kanehisa, A. Yamashita, K. Oshima, K. Furuya, C. Yoshino, T. Shiba, M. Hattori, N. Ogasawara, H. Hayashi, and K.
FIG. 4. Distribution of PFGE types of the 391 AmericanS. aureusisolates over the four AFLP clusters. PCA of the AFLP data of all strains (n⫽1,222), showing only the 391 AmericanS. aureusisolates (which includes the American isolates that did not fit within the established USA PFGE lineages [“unique”]). The cubes are colored according to the PFGE type.
240 MELLES ET AL. J. CLIN. MICROBIOL.
on May 16, 2020 by guest
http://jcm.asm.org/
Hiramatsu.2001. Whole genome sequencing of methicillin-resistant Staph-ylococcus aureus. Lancet357:1225–1240.
5.McDougal, L. K., C. D. Steward, G. E. Killgore, J. M. Chaitram, S. K. McAllister, and F. C. Tenover.2003. Pulsed-field gel electrophoresis typing
of oxacillin-resistantStaphylococcus aureusisolates from the United States:
establishing a national database. J. Clin. Microbiol.41:5113–5120.
6.Melles, D. C., R. F. Gorkink, H. A. Boelens, S. V. Snijders, J. K. Peeters, M. J. Moorhouse, P. J. van der Spek, W. B. van Leeuwen, G. Simons, H. A. Verbrugh, and A. van Belkum.2004. Natural population dynamics and
ex-pansion of pathogenic clones ofStaphylococcus aureus. J. Clin. Investig.
114:1732–1740.
7.Murakami, K., W. Minamide, K. Wada, E. Nakamura, H. Teraoka, and S. Watanabe.1991. Identification of methicillin-resistant strains of
staphylo-cocci by polymerase chain reaction. J. Clin. Microbiol.29:2240–2244.
8.National Committee for Clinical Laboratory Standards.2003. Performance standards for antimicrobial disk susceptibility tests, 8th ed. Approved stan-dard M2–A8. NCCLS, Wayne, PA.
9.Nouwen, J., A. Ott, H. Boelens, M. Claassen, A. van Belkum, A. Hofman, and H. A. Verbrugh.2004. Smoking pattern and fasting glucose levels determine
Staphylococcus aureusnasal carriage. Ph.D. thesis. Erasmus University Med-ical Center, Rotterdam, The Netherlands.
10.Reijans, M., R. Lascaris, A. O. Groeneger, A. Wittenberg, E. Wesselink, J.
van Oeveren, E. de Wit, A. Boorsma, B. Voetdijk, H. van der Spek, L. A. Grivell, and G. Simons.2003. Quantitative comparison of cDNA-AFLP, microarrays, and GeneChip expression data in Saccharomyces cerevisiae.
Genomics82:606–618.
11.Wertheim, H. F., W. B. Leeuwen, S. Snijders, M. C. Vos, A. Voss, C. M. Vandenbroucke-Grauls, J. A. Kluytmans, H. A. Verbrugh, and A. Belkum.
2005. Associations betweenStaphylococcus aureusgenotype, infection, and
in-hospital mortality: a nested case-control study. J. Infect. Dis.192:1196–
1200.
12.Wertheim, H. F., D. C. Melles, M. C. Vos, W. van Leeuwen, A. van Belkum, H. A. Verbrugh, and J. L. Nouwen.2005. The role of nasal carriage in
Staphylococcus aureusinfections. Lancet Infect. Dis.5:751–762.
13.Wertheim, H. F., M. C. Vos, A. Ott, A. van Belkum, A. Voss, J. A. Kluytmans, P. H. van Keulen, C. M. Vandenbroucke-Grauls, M. H. Meester, and H. A. Verbrugh.2004. Risk and outcome of nosocomial
Staphylococcus aureusbacteraemia in nasal carriers versus non-carriers.
Lancet364:703–705.
14.Wertheim, H. F., M. C. Vos, A. Ott, A. Voss, J. A. Kluytmans, C. M. Vandenbroucke-Grauls, M. H. Meester, P. H. van Keulen, and H. A. Verbrugh.2004. Mupirocin prophylaxis against nosocomialStaphylococcus aureusinfections in nonsurgical patients: a randomized study. Ann. Intern.
Med.140:419–425.