www.impactjournals.com/oncotarget/ Oncotarget, Vol. 6, No.7
Prognostic and predictive value of PDL1 expression in breast
cancer
Renaud Sabatier1,2,3, Pascal Finetti1, Emilie Mamessier1, José Adelaide1, Max Chaffanet1, Hamid Raza Ali4,5, Patrice Viens1,2,3, Carlos Caldas5, Daniel Birnbaum1 and François Bertucci1,2,3
1 Département d’Oncologie Moléculaire, “Equipe labellisée Ligue Contre le Cancer”, Centre de Recherche en Cancérologie de
Marseille (CRCM), Institut Paoli-Calmettes, INSERM UMR1068, CNRS UMR725, Marseille, France
2 Département d’Oncologie Médicale, CRCM, Institut Paoli-Calmettes, Marseille, France 3 Faculté de Médecine, Aix-Marseille Université, Marseille, France
4 Department of Pathology, University of Cambridge, Cambridge, United Kingdom
5 Cancer Research UK Cambridge Institute, University of Cambridge, Cambridge, United Kingdom
Correspondence to: François Bertucci, email: [email protected] Keywords: breast cancer, chemotherapy, immune response, PDL1, survival
Received: November 17, 2014 Accepted: December 26, 2014 Published: December 31, 2014
This is an open-access article distributed under the terms of the Creative Commons Attribution License, which permits unrestricted use, distribution, and reproduction in any medium, provided the original author and source are credited.
ABSTRACT
Expression of programmed cell death receptor ligand 1 (PDL1) has been scarcely studied in breast cancer. Recently PD1/PDL1-inhibitors have shown promising results in different carcinomas with correlation between PDL1 tumor expression and responses. We retrospectively analyzed PDL1 mRNA expression in 45 breast cancer
cell lines and 5,454 breast cancers profiled using DNA microarrays. Compared to
normal breast samples, PDL1 expression was upregulated in 20% of clinical samples and 38% of basal tumors. High expression was associated with poor-prognosis features (large tumor size, high grade, ER-negative, PR-negative, ERBB2-positive status, high proliferation, basal and ERBB2-enriched subtypes). PDL1 upregulation was associated with biological signs of strong cytotoxic local immune response. PDL1 upregulation was not associated with survival in the whole population, but
was associated with better metastasis-free and overall specific survivals in basal
tumors, independently of clinicopathological features. Pathological complete response after neoadjuvant chemotherapy was higher in case of PDL1 upregulation (50% versus 21%). In conclusion, PDL1 upregulation, more frequent in basal breast cancers, was associated with increased T-cell cytotoxic immune response. In this aggressive subtype, upregulation was associated with better survival and response
to chemotherapy. Reactivation of dormant tumor-infiltrating lymphocytes by
PDL1-inhibitors could represent promising strategy in PDL1-upregulated basal breast cancer.
INTRODUCTION
Despite recent progresses, nearly 20% of patients with breast cancer still develop metastases and die from disease progression. During the last decades, molecular alterations involved in mammary oncogenesis and
metastatic progression have been identified, leading to
major therapeutic progresses such as hormone therapy targeting the estrogen receptor (ER) and targeted therapies
adoptive immunotherapy (interleukin 2, interferons, and vaccines) have been relatively disappointing. However, the role of immunity has emerged during the last decade with the demonstration of a favorable prognostic impact of
the presence of tumor-infiltrating lymphocytes (TILs)
[1-3] and of gene expression signatures of immune response,
notably for ER-negative, highly proliferative tumors [4-8].
Immune response represents a complex phenomenon based on a balance between activator and inhibitor
pathways that regulate TILs activity. This balance may
be disturbed in certain pathological conditions such as cancer where the inhibition of the immune system will
favor tumor progression. One key inhibitor is the PD1-PDL1 pathway. PD1 (Programmed cell Death 1) is a cell
surface membrane protein expressed by various immune
cells including T-cells; it is activated by its ligands PDL1 and PDL2, which are expressed by antigen-presenting
cells such as macrophages or B-cells. After engagement
by its ligands, PD1 attenuates lymphocyte activation [9-13] and promotes T-regulatory cell development and
function, allowing to terminate the immune response. Recent works have suggested that it could be a main actor in cancer progression through anti-cancer immune
response inhibition [10, 14, 15]. Indeed, tumor cells from different locations express PDL1 and thus can inhibit the immune response. Clinical trials testing anti-PD1 or anti-PDL1 drugs to restore anti-cancer immunity have
shown very promising results with durable responses, notably in melanoma and renal, lung, prostate and bladder
carcinomas [16-18], and phase III studies are ongoing. Furthermore, relationship between PDL1 expression on
tumor and/or immune cells and objective response has
been reported [16, 17, 19-21].
PDL1 expression has been studied in different
cancers such as kidney, lung, pancreas, esophagus, ovary, colorectal, head and neck and squamous cell carcinomas,
melanomas and gliomas [22-32], with evidence of
correlations with clinicopathological tumor features
in several studies. In breast cancer, the PD1-PDL1 pathway has been very scarcely studied [33-39]; only two prognostic studies, including 650 cases analyzed at the protein level (immunohistochemistry, IHC) [39] and 398 cases at the mRNA level [36], recently addressed the
prognostic issue, but provided divergent results.
Here, we have analyzed PDL1 mRNA expression
in 45 breast cancer cell lines and 5,454 breast cancers profiled using DNA microarrays. We searched for
correlations between PDL1 expression and genomic and clinicopathological data, including survival and response to chemotherapy.
RESULTS
PDL1 expression and copy number alterations in breast cancer
PDL1 expression was measured by using probe sets
whose identity and specificity showed 100% accuracy (Supplementary Table 1). We evaluated PDL1 expression
in 45 breast cancer cell lines. Luminal cell lines (N=16)
showed lower PDL1 expression level than basal cell lines
(N=11; p=1.46E-03, Tukey test) and mesenchymal cell lines (N=8; p=2.0E-04, Tukey test). PDL1 expression was similar between basal and mesenchymal cell lines (p=0.34, Turkey test; Figure 1 and Supplementary Figure 1). PDL1
expression was analyzed in 5,454 clinical breast cancer samples pooled from 18 data sets (Supplementary Tables 2-3): 1076 tumors (20%) showed PDL1 upregulation
when compared to normal breast (ratio T/NB ≥2; “PDL1-up” group), and 4378 (80%) did not show upregulation (ratio <2; “PDL1-no up” group).
Array-CGH data were available for 3,140 tumors.
PDL1 copy number alterations were rare: 134 tumors (4%) presented losses, including 13 with homozygous deletion (0.4%), whereas 163 (5%) showed gains, including 39 (1%) with amplification. Of note, 74% of amplified
tumors were basal subtype. Basal tumors presented more gains when compared to the other molecular
subtypes (17% vs from 1 to 4% for the other subtypes;
p<1E-04, Fisher’s exact test), but similar levels of losses
(p=0.53). Correlation existed between DNA copy number
and mRNA expression since tumors with PDL1 gains displayed a higher PDL1 expression level (p=2.18E-07,
Student t-test; Supplementary Figure 2).
PDL1 expression and clinicopathological features
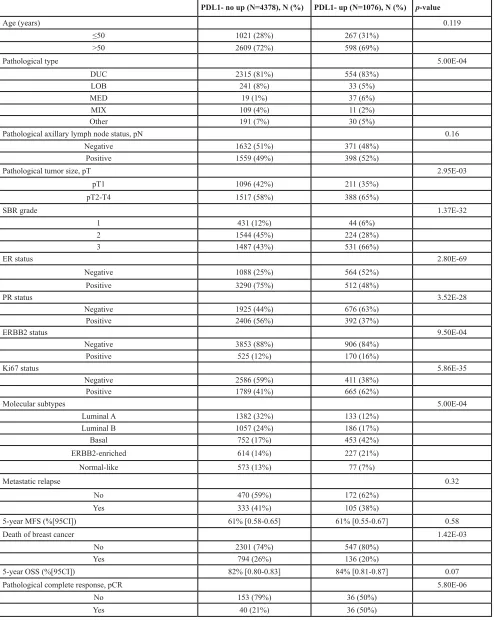
We searched for correlations between PDL1 mRNA expression and clinicopathological features. As shown
in Table 1, PDL1 expression was generally associated with poor-prognosis features: pathological type (with
more ductal and medullary carcinoma in the “PDL1-up” group), large pathological tumor size, high tumor grade,
negative ER status, negative PR status, positive ERBB2
status, and positive Ki67 status. No correlation was found with patients’ age and pathological axillary lymph node
status. Regarding the molecular subtypes, we observed more basal and ERBB2-enriched cases and less luminal
Table 1: PDL1 expression and clinicopathological features
PDL1- no up (N=4378), N (%) PDL1- up (N=1076), N (%) p-value
Age (years) 0.119
≤50 1021 (28%) 267 (31%)
>50 2609 (72%) 598 (69%)
Pathological type 5.00E-04
DUC 2315 (81%) 554 (83%)
LOB 241 (8%) 33 (5%)
MED 19 (1%) 37 (6%)
MIX 109 (4%) 11 (2%)
Other 191 (7%) 30 (5%)
Pathological axillary lymph node status, pN 0.16
Negative 1632 (51%) 371 (48%)
Positive 1559 (49%) 398 (52%)
Pathological tumor size, pT 2.95E-03
pT1 1096 (42%) 211 (35%)
pT2-T4 1517 (58%) 388 (65%)
SBR grade 1.37E-32
1 431 (12%) 44 (6%)
2 1544 (45%) 224 (28%)
3 1487 (43%) 531 (66%)
ER status 2.80E-69
Negative 1088 (25%) 564 (52%)
Positive 3290 (75%) 512 (48%)
PR status 3.52E-28
Negative 1925 (44%) 676 (63%)
Positive 2406 (56%) 392 (37%)
ERBB2 status 9.50E-04
Negative 3853 (88%) 906 (84%)
Positive 525 (12%) 170 (16%)
Ki67 status 5.86E-35
Negative 2586 (59%) 411 (38%)
Positive 1789 (41%) 665 (62%)
Molecular subtypes 5.00E-04
Luminal A 1382 (32%) 133 (12%)
Luminal B 1057 (24%) 186 (17%)
Basal 752 (17%) 453 (42%)
ERBB2-enriched 614 (14%) 227 (21%)
Normal-like 573 (13%) 77 (7%)
Metastatic relapse 0.32
No 470 (59%) 172 (62%)
Yes 333 (41%) 105 (38%)
5-year MFS (%[95CI]) 61% [0.58-0.65] 61% [0.55-0.67] 0.58
Death of breast cancer 1.42E-03
No 2301 (74%) 547 (80%)
Yes 794 (26%) 136 (20%)
5-year OSS (%[95CI]) 82% [0.80-0.83] 84% [0.81-0.87] 0.07
Pathological complete response, pCR 5.80E-06
No 153 (79%) 36 (50%)
Yes 40 (21%) 36 (50%)
N, number of cases available; DUC, ductal carcinoma, LOB, lobular carcinoma, MIX, mixed; MED, medullary carcinoma; pN, pathological lymph node involvement; pT, pathological tumor size; MFS, metastasis-free survival; OSS, overall specific
PDL1 expression and immune features
Next, we investigated whether PDL1 expression was associated with immunity-related parameters in clinical
samples of the whole data set (Supplementary Table 4).
First, we found a correlation between PDL1 expression and several immune prognostic gene expression
signatures of basal breast cancer [4-7]. Breast cancer
samples predicted by these classifiers as having a higher
expression of immune response genes (good-prognosis) indeed overexpressed PDL1. Second, we found that the
probability of activation [40] of immune-related pathways such as IFNα, IFNγ, STAT3 and TNFα was associated
with PDL1 overexpression, both in the whole cohort of samples and in each molecular subtype (data not shown).
PDL1 expression and metastasis-free survival
We assessed the prognostic value of PDL1
expression in terms of MFS and OSS. MFS data
were available for 1,080 patients, including 642 who
remained metastasis-free during a median follow-up
of 85 months (median MFS not reached) and 438 who displayed metastatic relapse. The 5-year MFS rate was 61% [95CI, 0.58-0.64]. In univariate analysis applied
to the whole population (Table 2), axillary lymph node
involvement, large tumor size, high grade, negative
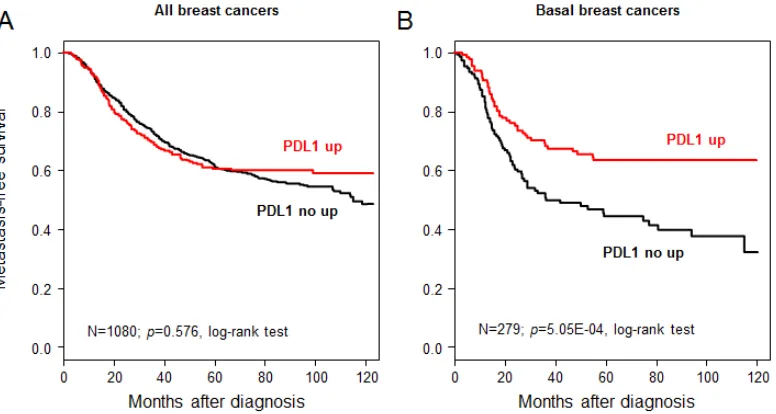
ER status, and negative PR status were associated with poor MFS, whereas PDL1 expression was not (p=0.57, Wald test; HR=0.94 [0.75-1.17], and p=0.576, log-rank
test, Figure 2A). The same analysis was done in each molecular subtype separately. As shown in Figure 2B,
PDL1 expression influenced MFS in the basal subtype with 63% 5-year MFS (CI95 55-73) in the “PDL1-up” group and 44% (CI95 36-54) in the “PDL1-no up” group
(p=5.05E-04; log-rank test). By contrast, no significant influence was seen in the other subtypes (data not shown):
luminal A (p=0.76), luminal B (p=0.60), ERBB2-enriched
(p=0.09), and normal-like (p=0.07). The interaction test between PDL1 expression (“PDL1-up” vs “PDL1-no
[image:4.612.63.279.160.401.2]up”) and molecular subtypes (basal vs non-basal) was
[image:4.612.97.485.474.681.2]Figure 2: Metastasis-free survival according to PDL1 mRNA expression in the whole population and in basal breast cancers. A/ Kaplan-Meier MFS curves in patients with high and low expression in the whole population. The 5-year MFS was 61% in both groups. B/ Similar to (A), but limited to patients with basal breast cancer. The respective 5-year MFS were 63 and 44%.
Figure 1: PD-L1 mRNA expression across molecular subtypes of breast cancer cell lines. PDL1 expression level reported as a box plot according to the molecular subtype of cell lines. The p-values are indicated (Tukey test) are indicated as
significant (p=4.8E-04). In multivariate analysis applied to
the basal subtype (Table 3A), PDL1 expression remained the sole prognostic feature for MFS (p=1.4E-03, Wald test; HR=0.55 [0.38-0.79]).
PDL1 expression and overall specific survival
The results were similar with respect to OSS for the
3,778 patients with available follow-up, including 2,848 who remained alive during a median follow-up of 86 months (median OSS not reached) and 930 who died from
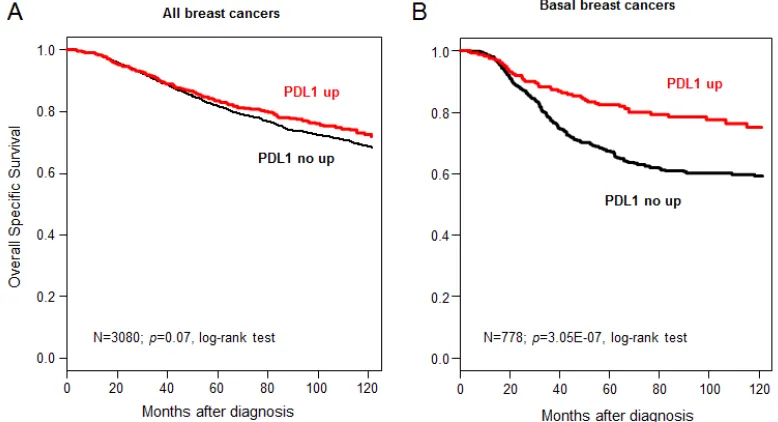
disease progression. The 5-year OSS was 82% [95CI = 0.81-0.84]. PDL1 expression was not associated with OSS in the whole population (p=0.07, log-rank test, Figure 3A),
but was associated with better OSS for basal tumors, in
which the 5-year OSS was 82% (CI95 78-87) in case of
PDL1 upregulation and 68% (CI95 63-72) in the absence of upregulation (p=3.05E-07; log-rank test; Figure 3B).
A trend was noted for ERBB2-enriched tumors (p=0.07, HR=0.73 [0.52-1.02]), but not for patients from other
subtypes (data not shown), and the interaction test between
[image:5.612.88.528.62.271.2]PDL1 expression (“PDL1-up” vs “PDL1-no up”) and Table 2: MFS univariate Cox regression analysis in the whole cohort
N HR [95CI] p-value
Age (years) >50 vs ≤50 725 0.85 [0.65-1.12] 0.25
Pathological type LOB vs DUC 440 1.32 [0.75-2.32] 0.46
MED vs DUC 0.39 [0.10-1.59]
MIX vs DUC 0.65 [0.24-1.79]
Other vs DUC 1.14 [0.50-2.61]
pN Positive vs Negative 612 1.37 [1.01-1.86] 4.00E-02
pT pT2-4 vs pT1 445 1.77 [1.23-2.56] 2.23E-03
SBR grade 2-3 vs 1 857 3.46 [2.08-5.76] 1.70E-06
ER status Positive vs Negative 1080 0.57 [0.47-0.68] 4.70E-09 PR status Positive vs Negative 1080 0.61 [0.5-0.73] 3.30E-07 ERBB2 status Positive vs Negative 1080 1.21 [0.93-1.57] 0.17
PDL1 expression "up" vs "no up" 1080 0.94 [0.75-1.17] 0.57
N, number of samples with data available; LOB, invasive lobular carcinoma; DUC, invasive ductal carcinoma; MED, medullary carcinoma; MIX, mixt carcinoma (lobular and ductal); pT, pathological tumor size; pN, pathological lymph node involvement; HR, hazard ratio;95CI,95% confidence interval.
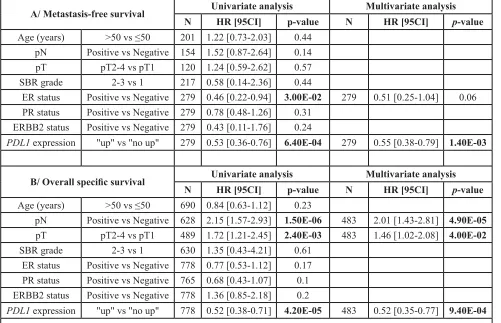
[image:5.612.104.493.476.687.2]Table 3: Univariate and multivariate Cox regression analyses for basal tumors
A/ Metastasis-free survival Univariate analysis Multivariate analysis N HR [95CI] p-value N HR [95CI] p-value Age (years) >50 vs ≤50 201 1.22 [0.73-2.03] 0.44
pN Positive vs Negative 154 1.52 [0.87-2.64] 0.14
pT pT2-4 vs pT1 120 1.24 [0.59-2.62] 0.57
SBR grade 2-3 vs 1 217 0.58 [0.14-2.36] 0.44
ER status Positive vs Negative 279 0.46 [0.22-0.94] 3.00E-02 279 0.51 [0.25-1.04] 0.06
PR status Positive vs Negative 279 0.78 [0.48-1.26] 0.31
ERBB2 status Positive vs Negative 279 0.43 [0.11-1.76] 0.24
PDL1 expression "up" vs "no up" 279 0.53 [0.36-0.76] 6.40E-04 279 0.55 [0.38-0.79] 1.40E-03
B/ Overall specific survival Univariate analysis Multivariate analysis N HR [95CI] p-value N HR [95CI] p-value Age (years) >50 vs ≤50 690 0.84 [0.63-1.12] 0.23
pN Positive vs Negative 628 2.15 [1.57-2.93] 1.50E-06 483 2.01 [1.43-2.81] 4.90E-05 pT pT2-4 vs pT1 489 1.72 [1.21-2.45] 2.40E-03 483 1.46 [1.02-2.08] 4.00E-02 SBR grade 2-3 vs 1 630 1.35 [0.43-4.21] 0.61
ER status Positive vs Negative 778 0.77 [0.53-1.12] 0.17
PR status Positive vs Negative 765 0.68 [0.43-1.07] 0.1
ERBB2 status Positive vs Negative 778 1.36 [0.85-2.18] 0.2
PDL1 expression "up" vs "no up" 778 0.52 [0.38-0.71] 4.20E-05 483 0.52 [0.35-0.77] 9.40E-04
N, number of samples with data available; pT, pathological tumor size; pN, pathological lymph node involvement; HR, hazard ratio; 95CI,95% confidence interval.
Table 4: OSS Cox regression analyses for basal tumors including four immune response-related gene expression signatures
Univariate analysis Multivariate analysis N HR [95CI] p-value N HR [95CI] p-value
PDL1 expression "up" vs "no up" 778 0.52 [0.38-0.71] 4.23E-05 778 0.61 [0.43-0.85] 3.89E-03 Immune response
module (Teschendorff et
al.) Low-risk vs. high-risk 766 0.86 [0.66-1.13] 0.285
LCK metagene (Rody et
al.) Low-risk vs. high-risk 778 0.61 [0.46-0.79] 2.91E-04 778 0.83 [0.56-1.24] 0.367 Stroma metagene
(Bianchini et al.) Intermediate-risk vs high-risk 778 0.72 [0.53-0.99] 4.84E-03 778 0.85 [0.61-1.18] 0.327
Low-risk vs. high-risk 0.59 [0.42-0.82] 778 0.79 [0.54-1.16] 0.237
Immune kinases
metagene (Sabatier et al.) Low-risk vs. high-risk 778 0.61 [0.45-0.84] 2.05E-03 778 0.92 [0.6-1.42] 0.702
[image:6.612.57.559.501.673.2]molecular subtypes (basal vs non-basal) was significant
(p=7.8E-03). Multivariate analysis in basal breast cancers
showed that PDL1 expression remained an independent prognostic feature (p=9.4E-04, Wald test; HR=0.52 [0.35-0.77]), as well as pathological tumor size and lymph node
status (Table 3B). Given the correlation between PDL1
expression and the four prognostic immune signatures, we repeated the prognostic analysis for OSS in basal tumors
by confronting these five variables. As shown in Table 4, all but one (the immune response module [6]) were
associated with OSS in this series. Multivariate analysis
including the significant variables showed that PDL1
expression could independently predict OSS, whereas all gene signatures lost their prognostic value, suggesting dependence on PDL1 expression.
PDL1 expression and pathological response to chemotherapy
Pathological response after neoadjuvant anthracycline-based chemotherapy was available for
265 out of 5,454 patients. Seventy-six (29%) of these
patients displayed pathological complete response (pCR),
and 189 did not. In this pooled series, PDL1 expression
was associated with pCR in the whole population (50%
pCR in case of upregulation versus 21% in the other
cases; p=6.6E-06, OR=3.8 [2.05-7.09]), whereas none of the tested clinicopathological features did (Table 5, data
related to grade could not be interpreted because only
4 (2%) grade 1 tumors were included, all presenting a residual disease after chemotherapy). We confirmed the
predictive value of PDL1 expression in basal (p=3.8E-04, OR=4.3 [1.80-10.43]) and ERBB2-enriched cases (p=0.04, OR=6.5 [1.06-50.85]), but not in the other subtypes
(luminal A, p=0.15; luminal B, p=1; normal-like, p=0.30).
PDL1 expression and associated biological processes
Supervised analysis identified 359 genes differentially expressed in the Guedj’s dataset between the
tumors with versus without PDL1 upregulation, including
287 genes upregulated and 72 genes downregulated in the “PDL1-up” samples (Supplementary Table 5,
Supplementary Figure 3). The robustness of this gene
list was confirmed in two large independent sets of respectively 448 and 533 tumors by using a metagene approach and ROC curves with “PDL1-up” genes
(Supplementary Figure 3) with respective accuracy
rates of 90% (p=2.6E-49, Fisher’s exact test) and 80% (p=1.4E-50, Fisher’s exact test). Ontology analysis of these 359 genes (Supplementary Table 6) revealed that “PDL1-up” tumors overexpressed genes involved
in the regulation of the local immune response. More
specifically, we found that numerous upregulated genes
were related to the T-cell receptor (TCR alpha, beta, delta, CD247, CD2, KLRK1, CD8A, PTPRC, CD3D,
CD3E,…), attesting of a high infiltration with T-cells in the “PDL1-up” group. In addition, two of the most overexpressed genes in the “PDL1-up” group were IDO1
and CTLA4, known as major actors induced to attenuate an active T-cell immune response. However, most of the
other genes associated with PDL1 upregulation were
genes directly involved in T-cells activation (ZAP70, ITK,
LCK, JAK3,…), differentiation factors (EOMES, STAT1,
STAT4, CD27…), cytotoxic effector molecules (GZMA,
GZMB, GZMK, PRF1, GNLY, C1QA…), inflammation/
anti-tumor cytokines (IL2RG, IL2RB, IL21R, IL27R,
IL15, IL18BP, LTB, some interferon-induced proteins…), and chemokines related to T-cells activation and homing (CCL2, CCL4, CCL5, CCL8, CCL18, CXCL1, CXCL9-11, CCR5,…). This signature was highly suggestive of a major anti-tumor immune response occurring at the tumor
site in the “PDL1-up” group. Many genes overexpressed in the “PDL1-no up” group were involved in response to
hormone stimulus and mammary gland development and luminal differentiation such as ESR1, TTF1, GATA3 and
ERBB4.
DISCUSSION
Blockade of the PD1-PDL1 pathway is a new
promising therapeutic approach in oncology. Our objective was to document the expression of PDL1 in a large series of breast cancer cell lines and clinical samples and to
search for correlations with tumor features. We showed
that PDL1 expression was associated with more aggressive subtypes (basal and ERBB2-enriched). In basal tumors, higher PDL1 expression was associated with better MFS and OSS and better response to chemotherapy. To our knowledge, this is the largest series reported with more
than 5,400 cases analyzed.
During the last decade, PDL1 expression in
cancer has been mainly studied at the protein level using IHC, but divergent results have been reported, notably
regarding its prognostic value [41]. These divergences have often been related to the absence of standardization of PDL1 IHC, notably in terms of specificity and reproducibility of available antibodies [42, 43], definition
of optimal positivity cut-off and interpretative subjectivity. Alternative analytic methods have been developed, such as mRNA analysis using in situ hybridization (ISH) [36].
In breast cancer, PDL1 mRNA expression measured using an antibody-independent ISH assay was associated with
a long recurrence-free survival [36], whereas protein
expression measured using IHC with a commercial rabbit polyclonal antibody was associated with a poor
Table 5: Univariate analysis for pathological response to neoadjuvant chemotherapy in the whole cohort and per molecular subtype
N RD pCR p-value* OR [95CI]
All variables and
PDL1 expression
in the whole cohort
PDL1 expression 6.60E-06 3.8 [2.05-7.09]
'no up' 193 153 (81%) 40 (53%)
'up' 72 36 (19%) 36 (47%)
Age (years) 0.5 0.82 [0.46-1.45]
≤50 151 105 (56%) 46 (61%)
>50 114 84 (44%) 30 (39%)
Pathological type 0.27
DUC 115 67 (94%) 48 (86%)
LOB 6 2 (3%) 4 (7%)
Other 6 2 (3%) 4 (7%)
ER status 0.056 3.1 [0.85-11.51]
Negative 252 183 (97%) 69 (91%)
Positive 13 6 (3%) 7 (9%)
PR status 0.87 1.1 [0.53-2.12]
Negative 208 149 (79%) 59 (78%)
Positive 57 40 (21%) 17 (22%)
ERBB2 status 0.32 1.4 [0.68-2.68]
Negative 209 152 (80%) 57 (75%)
Positive 56 37 (20%) 19 (25%)
PDL1 expression
in each molecular subtype
Basal 3,76E-04 4.3 [1.8-10.43]
'no up' 92 76 (77%) 16 (43%)
'up' 44 23 (23%) 21 (57%)
ERBB2-enriched 3,78E-02 6.5 [1.06-50.85]
'no up' 31 24 (89%) 7 (54%)
'up' 9 3 (11%) 6 (46%)
Luminal A 0.15 2.8 [0.54-14.26]
'no up' 40 31 (84%) 9 (64%)
'up' 11 6 (16%) 5 (36%)
Luminal B 1.00 [0.02-156.46]
'no up' 11 7 (88%) 4 (80%)
'up' 2 1 (12%) 1 (20%)
Normal-like 0.30 3.5 [0.34-38.7]
'no up' 19 15 (83%) 4 (57%)
'up' 6 3 (17%) 3 (43%)
N, number of samples with data available; RD, residual disease; pCR, pathological complete response; DUC, invasive
ductal carcinoma; LOB, invasive lobular carcinoma; OR, odd ratio; 95CI, 95% confidence interval. * Fisher's exact
prognostic value in lung [41, 44] and colorectal [31, 45]
carcinomas, opposite to what had been previously reported with non-validated antibodies. Our analysis at the mRNA level and based on DNA microarrays allowed us to avoid the limitations of IHC and to work on a very large series
of samples, providing for the first time the opportunities
to address different clinical issues (survival, response to chemotherapy) and to work on each molecular subtype separately. One limitation of DNA microarray-based
measurement is that it quantifies expression level of
both tumor cells and non-tumor cells, including immune
infiltrating cells. However, our results are consistent with those reported by others using ISH [36], who showed that the hybridization signal in breast cancer samples was
predominantly located within the tumor cells.
We found PDL1 upregulation in 20% of 5,454 breast cancers and 38% of 1,205 basal tumors. To date, five teams have described PDL1 expression in breast cancer [33-39]. The first study reported expression in 50% of 44 samples analyzed using IHC and a little stringent positivity cut-off (expression by at least one cell) [34].
Using different antibodies and scoring systems, Muenst
et al reported PDL1 expression in ~23% of 650 samples [39], and Mittendorf et al in 19% of 105 triple-negative (TN) samples [38]. Using ISH, Schalper et al reported
PDL1 mRNA expression - defined as signal detection
as compared to a negative control bacterial gene - in
~55% of 636 samples [36]. The relative lower frequency
of upregulation that we found (20%) may account for the different scoring system that we used (upregulation
defined by an arbitrary cut-off: T/NB ratio ≥2) and the
different analytic levels, protein versus mRNA, that show
a positive but non-linear relationship [36]. In addition to
mRNA upregulation, we searched for other molecular
alterations of PDL1 in breast cancer and showed for the first time that copy number alterations are rare (<5%),
even if this rate was higher in basal tumors and correlated with a higher rate of mRNA overexpression. Similarly,
analysis of the TCGA data set [46] shows that mutations are very rare with only one tumor mutated out of 464
tested (0.2%).
Analysis of correlations between PDL1 mRNA expression and tumor features, showed that, in agreement
with previous publications on smaller series [34, 35, 39],
PDL1 upregulation was associated with poor-prognosis
features: large tumor size, high grade, negative ER status,
negative PR status, positive ERBB2 status, and high
proliferation rate. For the first time, we showed that PDL1
was differentially expressed across the major breast cancer molecular subtypes, with more frequent upregulation in basal and ERBB2-enriched subtypes than in luminal A, luminal B and normal-like subtypes. Recently, greater expression was reported in TN versus non-TN breast
cancers [37, 38]. The results on cell lines were similar with
PDL1 overexpression in basal and mesenchymal lines as
compared to luminal lines, as previously reported [37].
The correlation between PDL1 upregulation and elevated
tumor cell proliferation (Ki67) and more proliferative
molecular subtypes might be explained by the higher mutation rate of hyperproliferative tumor cells, potentially responsible for higher immunogenicity due to the rapid appearance of neoantigens. Of note, all these correlations persisted when PDL1 expression was analyzed as
continuous value (data not shown).
A total of 1,080 cases were informative for MFS and 3,778 for OSS. PDL1 upregulation was not associated with survival in the whole series, nor in the other subtypes than basal, but was associated with better MFS and OSS in basal breast cancers. In both cases, multivariate analyses showed that PDL1 had independent prognostic value. Of note, we found similar prognostic results (data not shown) when PDL1 expression was analyzed as continuous value and when the molecular subtypes were defined
using mRNA expression of ER, PR and ERBB2. PDL1
upregulation was a favorable independent prognostic variable for MFS (p=5.1E-05, Wald test) and OSS (p=0.03, Wald test) in the TN subtype, whereas no prognostic value
was found in univariate analysis in the ER+ and/or PR+/ ERBB2- and ERBB2+ subtypes. To date, only two breast
cancer studies have reported significant and independent prognostic value of PDL1 expression in smaller series than ours [36, 39]. Analyses were done in the whole
series of samples, and not per molecular subtype, but with contradictory results: mRNA expression (ISH assay;
N=398) was associated with longer recurrence-free survival [36] in agreement with our observation, whereas
protein expression (IHC with a commercial antibody;
N=650) was associated with worse overall survival [39]. Possible explanations for these discordances may
be related to the IHC limitations described above and the non-perfect correlation between mRNA and protein
expression [36]. In fact, recent studies using validated IHC assays in different cancers showed that PDL1 expression had a favorable prognostic impact [31, 41, 47], by contrast
to what had been previously suggested with non-validated
antibodies. We previously found counterintuitive similar
favorable prognostic value with IDO expression in breast
cancer using both mRNA and IHC analyses [48].
Such favorable prognostic value seems paradoxical
given the known immunosuppressive role of PDL1
whose up-regulation in clinical samples is usually associated with immune features suggestive of anti-tumor escape mechanism. The biological explanation for our observation might be that PDL1 expression is
rather a marker of engaged CD8+ TILs, known to provide favorable prognostic features [2, 3], and represents a
negative feedback mechanism (like IDO overexpression)
that followed the CD8+ infiltration [32, 49]. Indeed, we observed a robust immune signature in the “PDL1-up”
group. The genes associated with this immune signature were characteristic of a strong cytotoxic response,
anti-tumor immunity (γδ-T-cells, NKG2D+ cells, dendritic-cells, B-cells …). This activation profile was consistent
with the correlation between PDL1 mRNA expression and
the presence of elevated TILs reported by other groups on smaller series [33, 36]. While associated with other immunosuppressive molecules of the “PDL1-up” group, such as IDO and CTLA4, this infiltrate was however highly suggestive of an activated profile of differentiated T-cells (EOMES, CD27…). Those cells were clearly
TH1-biased (IL12 and IFN-induced pathways), endowed with cytotoxic effector functions (granzymes, perforine, granulysine). In addition, this pro-cytotoxic profile was
coherent with our description of the positive correlation between PDL1 transcript and known immune expression
signatures [4-7], as well as the probability of activation of IFNα, IFNγ, STAT3 and TNFα pathways [40]. In
addition, none of the characteristic markers related
to T-cell exhaustion (TIM3, LAG3, BTLA) were up-regulated in the “PDL1-up” group. Altogether, these
observations suggested that the biological link between
PDL1 upregulation and activated T-lymphocyte infiltrate might be related to IFNγ or other inflammatory cytokines,
secreted by anti-tumor TH1-cells or macrophages, which can positively regulate PDL1 expression, notably in basal tumor cells [37] in response to immune-mediated attack [19], in order to decrease the cytotoxic local immune
response. From a therapeutic point of view, the blockade
of PDL1 would allow to reactivate inhibited T-cells to
increase the anti-tumor immune response, explaining
the benefit observed in responder patients. Interestingly
our results of multivariate analysis might suggest that
PDL1 expression reflects more precisely the degree of TILs functionally engaged than immune gene expression
signatures.
Finally, PDL1 upregulation was also associated with better response to pre-operative chemotherapy in
the 265 informative samples, with a 50% pCR rate versus
21% in case of no upregulation. Per molecular subtype
analysis showed that this predictive value was in fact limited to basal and ERBB2-enriched tumors. Analysis of PDL1 expression as continuous value gave the same
results (data not shown). Like the prognostic correlation,
this rather counterintuitive correlation has likely the same biological explanation and is likely related to the known
favorable predictive value of TILs in breast cancer [50-53]. To our knowledge, this is the first demonstration of
such a correlation in breast cancer.
In conclusion, we showed that PDL1 mRNA expression is associated with basal subtype where it represents an independent favorable prognostic feature and a predictive feature for better response to chemotherapy. The main strength of our study lies in the
number of samples analyzed (more than 5,400), allowing
both overall and per subtype prognostic and predictive
analyses. Limitations include its retrospective nature,
the absence of information with respect to survival and
response to chemotherapy for more samples, and the use of DNA microarrays that quantify expression level of both epithelial and stromal cells. However, our study, together
with the known link between PDL1 expression and tumor response to PDL1-inhibitors, suggests that the therapeutic targeting of PDL1 in basal breast cancers could enhance
the local immune response, thus providing an antitumor effect and decreasing the metastatic risk and improving the therapeutic response when associated with immunogenic
anticancer chemotherapy such as doxorubicin [54, 55].
Functional and clinical validation of this hypothesis is urgently warranted.
MATERIALS AND METHODS
Breast cancer samples
Breast cancer cell lines and clinical samples were
profiled using DNA microarrays. Our own data set of breast cancer cell lines included 45 cell lines: BT-20, BT-474, BT-483, CAMA-1, HBL100, HCC38, HCC202, HCC1395, HCC1500, HCC1569, HCC1806, HCC1937, HCC1954, HME-1, carcinosarcoma-derived Hs578T, MCF-7, MCF-10A, MDA-MB-134, MDA-MB-157, MB-175, MB-231, MB-361, MDA-MB-415, MDA-MB-436, MDA-MB-453, BR-3, SK-BR-7, T47D, UACC-812, ZR-75–1, ZR-75–30 (http:// www.atcc.org/), HMEC-derived 184A1 and 184B5 (ATCC, http://www.atcc.org/), BrCa-MZ-01, SUM44, SUM-52, SUM102, SUM-149, SUM159, SUM-185, SUM-190, SUM206, SUM-225, SUM229 http://www. cancer.med.umich. edu/breast_cell/production), and S68
(a kind gift from V. Catros, Cell Biology Department, CHU Rennes, France). All cell lines are derived from
carcinomas except MCF-10A, which is derived from a fibrocystic disease, and HME-1 and 184B5, which
represent normal mammary tissue.
Our own data set of clinical samples included 286
cases representing pre-treatment invasive carcinomas from
patients with non-metastatic and non-inflammatory disease
at diagnosis. The study was approved by our institutional
review board (the Institut Paoli Calmettes (IPC) “Comité d’Orientation Stratégique”) and each patient had given a written informed consent for research use. We pooled it with 17 available data sets comprising at least one probe
set representing PDL1. These sets were collected from the National Center for Biotechnology Information (NCBI)/ Genbank GEO and ArrayExpress databases, and authors’ website (Supplementary Table 2). The final pooled data set included 5,454 redundant metastatic, non-inflammatory, primary, invasive breast cancers with PDL1
mRNA expression and clinicopathological data available.
(Supplementary Table 2), corresponding to 3,140 breast
cancer samples with available whole-genome DNA copy number alterations.
Gene expression data analysis
Our own gene expression data set (cell lines, clinical normal and cancer samples) had been generated
using Affymetrix U133 Plus 2.0 human microarrays
(Affymetrix®, Santa Clara, CA, USA) as previously
described [56]. All data were MIAME compliant and
deposited in the Array-Express and GEO databases
(E-MTAB-1693 and GSE31448).
The breast cancer cell lines and clinical samples
were analyzed separately. Cell lines were analyzed as previously described [57]. PDL1 expression was
measured by analyzing different probe sets whose identity and specificity were verified using the NCBI program BLASTN 2.2.29+ (Supplementary Table 1). The molecular subtypes (luminal, basal, and mesenchymal) were defined as previously reported [58]. Seventeen cell lines were classified as luminal, 11 as basal, and 8 as mesenchymal, whereas 9 could not be classified in any subtype.
Data analysis of clinical samples required pre-analytic processing. The first step was to normalize each data set separately: we used quantile normalization for the
available processed data from non-Affymetrix-based sets (Agilent, SweGene and Illumina), and Robust Multichip
Average (RMA) [59] with the non-parametric quantile
algorithm for the raw data from the Affymetrix-based data
sets. Normalization was done in R using Bioconductor and associated packages. Then, hybridization probes
were mapped across the different technological platforms
represented. We used SOURCE (http://smd.stanford.edu/ cgi-bin/source/sourceSearch) and EntrezGene (Homo sapiens gene information db, release from 09/12/2008,
ftp://ftp.ncbi.nlm.nih.gov/gene/) to retrieve and update the non-Affymetrix gene chips annotations, and NetAffx
Annotation files (www.affymetrix.com; release from 01/12/2008) to update the Affymetrix gene chips
annotations. The probes were then mapped based on their
EntrezGeneID. When multiple probes mapped to the same
GeneID, we retained the one with the highest variance in a particular dataset.
To avoid biases related to IHC analyses across different institutions and thanks to the bimodal distribution of respective mRNA expression levels, ER, progesterone
receptor (PR), ERBB2 and Ki67 expression (negative/ positive) was defined at the transcriptional level using
gene expression data of ESR1, PGR,ERBB2 and MKI67
respectively, as previously described [60]. We applied different multigene classifiers in each data set separately. The intrinsic molecular subtypes of tumors were defined using the PAM50 classifier [61] as previously described [62]. Out of the 5,454 analyzed breast cancers, 1,515 were identified as luminal A (28%), 1,243 as luminal B
(23%), 1,205 as basal (22%), 841 as ERBB2-enriched (15%), and 650 as normal-like (12%). Clinicopathological characteristics of subtypes are summarized in
Supplementary Table 3. Because of the involvement of
PDL1 in immunity, we also analyzed prognostic gene
expression signatures (GES) linked to immune response
[4-7]. Since these GES were validated for ER negative,
triple negative or basal-like tumors, we compared their
prognostic value to that of PDL1 only for basal-like cases. We also assessed the correlation between PDL1 expression and previously published GES of biological pathway
activity [40].
Before analysis of PDL1 mRNA expression, gene
expression data were standardized within each data set
using the luminal A population as reference. This allowed to exclude biases due to laboratory-specific variations and
to population heterogeneity and to make data comparable across all sets. A principal component analysis (PCA)
applied to the 5,454 tumors and the genes of PAM50 signature prior and after the standardization allowed to verify the accuracy of the normalization in removing the set-specific variation in gene expression (Supplementary Figure 4): the samples, initially grouped according to their data set of origin (before standardization), were grouped according to their molecular subtype after standardization, suggesting that the normalization maintained the
biological information included in the expression data.
PDL1expression in tumors (T) was measured as discrete value after comparison with mean expression in normal breast samples (NB): upregulation, thereafter designated
“up” was defined by a T/NB ratio ≥2 and no upregulation (“no up”) by a T/NB ratio <2.
To explore the biological pathways linked to PDL1
expression in breast cancer, we applied a supervised analysis to three large data sets including more than
400 samples: the Guedj’ s data set [63] as learning set, including 100 tumors with and 352 without PDL1
upregulation, and the Ivshina’ s data set [64] and the TCGA data set [46] as two independent validation sets, including respectively 112 tumors with and 336 without
PDL1 upregulation, and 123 tumors with and 410 without
PDL1 upregulation. In the learning set, we compared the
expression profiles of 16,578 genes between tumors with
versus without PDL1 upregulation using a moderated t-test
with the following significance thresholds: p<5%, q<5%
and fold change (FC) superior to |2x|. Ontology analysis of the resulting gene list was based on GO biological
processes of the Database for Annotation, Visualization
and Integrated Discovery (DAVID; david.abcc.ncifcrf.
gov/). We tested the robustness of the resulting gene list on
each validation set separately by computing for each tumor
characteristic (ROC) curve applied to the learning set.
The metagene was applied to the validation sets to define the predicted PDL1 expression status of each sample.
Correlation of the predicted status with the observed status
was assessed using ROC curve of the “metagene PDL1 up” using Fisher’s exact test.
Array-CGH (aCGH) data analysis
Genomic imbalances, associated with available
mRNA expression data, were available for 3,140 breast cancer samples extracted from 5 sets including ours [46, 65-68] (Supplementary Table 2). Data from our set were generated using 244K CGH Microarrays (Hu-244A, Agilent Technologies Inc. Santa Clara, CA, USA) as previously described [65, 69]. The PDL1 locus at
9p24 was analyzed, and copy number changes were characterized as reported previously [65]. Five probes (A_16_P02052215, A_16_P02052226, A_16_P18538134, A_14_P120124 and A_16_P02052257) matched the
PDL1 gene on our Agilent chips. All our aCGH data can
be found in the Array Express database (E-MTAB-1861) and the GEO database (GSE23720). DNA copy number alterations in tumors were defined as a 1.5 FC for gains and losses, and a 2 FC for amplifications and deletions
as compared to normal DNA. Non-segmented aCGH data
[66, 70]were processed as previously described [70] using circular binary segmentation (CBS).
Statistical analysis
Correlations between tumor groups and
clinicopathological features were analyzed using the t-test or the Fisher’s exact test (variables with 2 groups) when
appropriate or one-way analysis of variance (ANOVA; variables with more than 2 groups). Metastasis-free survival (MFS) was calculated from the date of diagnosis
until the date of distant relapse. Overall specific survival
(OSS) was calculated from the date of diagnosis to the date of death from breast cancer. Follow-up was measured from the date of diagnosis to the date of last news for event-free patients. Survivals were calculated using the Kaplan-Meier method and curves were compared with the log-rank test. Univariate and multivariate survival analyses
were done using Cox regression analysis (Wald test). Variables tested in univariate analyses included patients’ age at time of diagnosis (≤50 years vs >50), pathological tumor size (pT: pT1 vs pT2-4), pathological axillary
lymph node status (pN: negative vs positive), pathological
grade (1 vs 2-3), histological type, and PDL1 expression
(“up” vs “no up”). Variables with a p-value <0.05 in
univariate analysis were tested in multivariate analysis. Differences in the prognostic effect of PDL1 expression by molecular subtype were assessed using a Cox model with an interaction term between expression and
subtype. We also analyzed the pathological response after neoadjuvant chemotherapy which was available for 265
clinical samples: pathological complete response (pCR)
was defined as absence of invasive cancer in both breast
and axillary lymph nodes. All statistical tests were
two-sided at the 5% level of significance. Statistical analysis
was done using the survival package (version 2.30) in the
R software (version 2.9.1; http://www.cran.r-project.org/). We followed the reporting REcommendations for tumor MARKer prognostic studies (REMARK criteria) [71].
ACKNOWLEDGEMENTS
Our work is supported by the Institut National du
Cancer (INCa) Translational Research Grant 2007 (FB), Translational Research Grant 2009 (DB) and Biologic Research Grant 2010 « IVOIRES » (FB), the Ligue
Nationale Contre le Cancer (label DB) and SIRIC
(INCa-DGOS-Inserm 6038 grant).
Competing interest
The authors have no conflict of interest to declare.
REFERENCES
1. Denkert C, Loibl S, Noske A, Roller M, Muller BM, Komor M, Budczies J, Darb-Esfahani S, Kronenwett R, Hanusch C, von Torne C, Weichert W, Engels K, et al.
Tumor-associated lymphocytes as an independent predictor of
response to neoadjuvant chemotherapy in breast cancer. J Clin Oncol. 2010; 28(1): 105-113.
2. Ali HR, Provenzano E, Dawson SJ, Blows FM, Liu B, Shah M, Earl HM, Poole CJ, Hiller L, Dunn JA, Bowden SJ, Twelves C, Bartlett JM, et al. Association between CD8+ T-cell infiltration and breast cancer survival in 12,439 patients. Ann Oncol. 2014; 25(8): 1536-1543.
3. Loi S, Michiels S, Salgado R, Sirtaine N, Jose V, Fumagalli D, Kellokumpu-Lehtinen PL, Bono P, Kataja V, Desmedt C, Piccart MJ, Loibl S, Denkert C, et al. Tumor infiltrating
lymphocytes are prognostic in triple negative breast cancer
and predictive for trastuzumab benefit in early breast cancer: results from the FinHER trial. Ann Oncol. 2014; 25(8): 1544-1550.
4. Rody A, Holtrich U, Pusztai L, Liedtke C, Gaetje R, Ruckhaeberle E, Solbach C, Hanker L, Ahr A, Metzler
D, Engels K, Karn T and Kaufmann M. T-cell metagene predicts a favorable prognosis in estrogen receptor-negative and HER2-positive breast cancers. Breast Cancer Res.
2009; 11(2): R15.
6. Teschendorff AE, Miremadi A, Pinder SE, Ellis IO and
Caldas C. An immune response gene expression module
identifies a good prognosis subtype in estrogen receptor negative breast cancer. Genome Biol. 2007; 8(8): R157. 7. Bianchini G, Qi Y, Alvarez RH, Iwamoto T, Coutant
C, Ibrahim NK, Valero V, Cristofanilli M, Green MC,
Radvanyi L, Hatzis C, Hortobagyi GN, Andre F, et
al. Molecular anatomy of breast cancer stroma and its prognostic value in estrogen receptor-positive and -negative
cancers. J Clin Oncol. 2010; 28(28): 4316-4323.
8. Sabatier R, Finetti P, Cervera N, Lambaudie E, Esterni B, Mamessier E, Tallet A, Chabannon C, Extra JM, Jacquemier J, Viens P, Birnbaum D and Bertucci F. A gene expression signature identifies two prognostic subgroups of basal breast cancer. Breast Cancer Res Treat. 2011; 126(2): 407-420.
9. Ahmadzadeh M, Johnson LA, Heemskerk B, Wunderlich JR, Dudley ME, White DE and Rosenberg SA. Tumor antigen-specific CD8 T cells infiltrating the tumor express high levels of PD-1 and are functionally impaired. Blood. 2009; 114(8): 1537-1544.
10. Dong H, Strome SE, Salomao DR, Tamura H, Hirano F, Flies DB, Roche PC, Lu J, Zhu G, Tamada K, Lennon VA, Celis E and Chen L. Tumor-associated B7-H1 promotes
T-cell apoptosis: a potential mechanism of immune evasion.
Nat Med. 2002; 8(8): 793-800.
11. Francisco LM, Salinas VH, Brown KE, Vanguri VK, Freeman GJ, Kuchroo VK and Sharpe AH. PD-L1 regulates
the development, maintenance, and function of induced
regulatory T cells. J Exp Med. 2009; 206(13): 3015-3029. 12. Hamel KM, Cao Y, Wang Y, Rodeghero R, Kobezda T,
Chen L and Finnegan A. B7-H1 expression on non-B and
non-T cells promotes distinct effects on T- and B-cell
responses in autoimmune arthritis. Eur J Immunol. 2010; 40(11): 3117-3127.
13. Zou W and Chen L. Inhibitory B7-family molecules in the tumour microenvironment. Nat Rev Immunol. 2008; 8(6): 467-477.
14. Iwai Y, Ishida M, Tanaka Y, Okazaki T, Honjo T and Minato N. Involvement of PD-L1 on tumor cells in the
escape from host immune system and tumor immunotherapy
by PD-L1 blockade. Proc Natl Acad Sci U S A. 2002; 99(19): 12293-12297.
15. Reiss KA, Forde PM and Brahmer JR. Harnessing the power of the immune system via blockade of 1 and PD-L1: a promising new anticancer strategy. Immunotherapy. 2014; 6(4): 459-475.
16. Brahmer JR, Tykodi SS, Chow LQ, Hwu WJ, Topalian SL, Hwu P, Drake CG, Camacho LH, Kauh J, Odunsi K, Pitot
HC, Hamid O, Bhatia S, et al. Safety and activity of
anti-PD-L1 antibody in patients with advanced cancer. N Engl J Med. 2012; 366(26): 2455-2465.
17. Topalian SL, Hodi FS, Brahmer JR, Gettinger SN, Smith DC, McDermott DF, Powderly JD, Carvajal RD, Sosman
JA, Atkins MB, Leming PD, Spigel DR, Antonia SJ, et al. Safety, activity, and immune correlates of anti-PD-1 antibody in cancer. N Engl J Med. 2012; 366(26): 2443-2454.
18. Powles T, Eder JP, Fine GD, Braiteh FS, Loriot Y, Cruz C, Bellmunt J, Burris HA, Petrylak DP, Teng SL, Shen X, Boyd Z, Hegde PS, et al. MPDL3280A (anti-PD-L1)
treatment leads to clinical activity in metastatic bladder
cancer. Nature. 2014; 515(7528): 558-562.
19. Taube JM, Klein A, Brahmer JR, Xu H, Pan X, Kim JH, Chen L, Pardoll DM, Topalian SL and Anders RA. Association of PD-1, PD-1 Ligands, and Other Features of
the Tumor Immune Microenvironment with Response to
Anti-PD-1 Therapy. Clin Cancer Res. 2014; 20(19): 5064-5074.
20. Herbst RS, Soria JC, Kowanetz M, Fine GD, Hamid O, Gordon MS, Sosman JA, McDermott DF, Powderly JD, Gettinger SN, Kohrt HE, Horn L, Lawrence DP, et al. Predictive correlates of response to the anti-PD-L1 antibody MPDL3280A in cancer patients. Nature. 2014; 515(7528): 563-567.
21. Tumeh PC, Harview CL, Yearley JH, Shintaku IP, Taylor EJ, Robert L, Chmielowski B, Spasic M, Henry G, Ciobanu V, West AN, Carmona M, Kivork C, et al. PD-1 blockade
induces responses by inhibiting adaptive immune resistance.
Nature. 2014; 515(7528): 568-571.
22. Konishi J, Yamazaki K, Azuma M, Kinoshita I, Dosaka-Akita H and Nishimura M. B7-H1 expression on non-small
cell lung cancer cells and its relationship with
tumor-infiltrating lymphocytes and their PD-1 expression. Clin Cancer Res. 2004; 10(15): 5094-5100.
23. Nomi T, Sho M, Akahori T, Hamada K, Kubo A, Kanehiro
H, Nakamura S, Enomoto K, Yagita H, Azuma M and Nakajima Y. Clinical significance and therapeutic potential of the programmed death-1 ligand/programmed death-1
pathway in human pancreatic cancer. Clin Cancer Res.
2007; 13(7): 2151-2157.
24. Ohigashi Y, Sho M, Yamada Y, Tsurui Y, Hamada K, Ikeda N, Mizuno T, Yoriki R, Kashizuka H, Yane K, Tsushima F, Otsuki N, Yagita H, et al. Clinical significance of programmed death-1 ligand-1 and programmed death-1
ligand-2 expression in human esophageal cancer. Clin
Cancer Res. 2005; 11(8): 2947-2953.
25. Strome SE, Dong H, Tamura H, Voss SG, Flies DB, Tamada K, Salomao D, Cheville J, Hirano F, Lin W, Kasperbauer JL, Ballman KV and Chen L. B7-H1 blockade
augments adoptive T-cell immunotherapy for squamous cell
carcinoma. Cancer Res. 2003; 63(19): 6501-6505.
26. Thompson RH, Dong H, Lohse CM, Leibovich BC, Blute ML, Cheville JC and Kwon ED. PD-1 is expressed by tumor-infiltrating immune cells and is associated with poor
outcome for patients with renal cell carcinoma. Clin Cancer
Res. 2007; 13(6): 1757-1761.
L, Zincke H, Blute ML, Strome SE, et al. Costimulatory B7-H1 in renal cell carcinoma patients: Indicator of tumor
aggressiveness and potential therapeutic target. Proc Natl
Acad Sci U S A. 2004; 101(49): 17174-17179.
28. Hamanishi J, Mandai M, Iwasaki M, Okazaki T, Tanaka
Y, Yamaguchi K, Higuchi T, Yagi H, Takakura K, Minato
N, Honjo T and Fujii S. Programmed cell death 1 ligand 1 and tumor-infiltrating CD8+ T lymphocytes are prognostic
factors of human ovarian cancer. Proc Natl Acad Sci U S A.
2007; 104(9): 3360-3365.
29. Wintterle S, Schreiner B, Mitsdoerffer M, Schneider D, Chen L, Meyermann R, Weller M and Wiendl H. Expression of the B7-related molecule B7-H1 by glioma
cells: a potential mechanism of immune paralysis. Cancer
Res. 2003; 63(21): 7462-7467.
30. Badoual C, Hans S, Merillon N, Van Ryswick C, Ravel
P, Benhamouda N, Levionnois E, Nizard M, Si-Mohamed
A, Besnier N, Gey A, Rotem-Yehudar R, Pere H, et al.
PD-1-expressing tumor-infiltrating T cells are a favorable
prognostic biomarker in HPV-associated head and neck
cancer. Cancer Res. 2013; 73(1): 128-138.
31. Droeser RA, Hirt C, Viehl CT, Frey DM, Nebiker C, Huber X, Zlobec I, Eppenberger-Castori S, Tzankov A, Rosso R, Zuber M, Muraro MG, Amicarella F, et al. Clinical impact of programmed cell death ligand 1 expression in colorectal cancer. Eur J Cancer. 2013; 49(9): 2233-2242.
32. Spranger S, Spaapen RM, Zha Y, Williams J, Meng Y, Ha TT and Gajewski TF. Up-regulation of PD-L1, IDO, and
T(regs) in the melanoma tumor microenvironment is driven
by CD8(+) T cells. Science translational medicine. 2013; 5(200): 200ra116.
33. Ghebeh H, Barhoush E, Tulbah A, Elkum N, Al-Tweigeri
T and Dermime S. FOXP3+ Tregs and B7-H1+/PD-1+ T lymphocytes co-infiltrate the tumor tissues of high-risk
breast cancer patients: Implication for immunotherapy.
BMC Cancer. 2008; 8: 57.
34. Ghebeh H, Mohammed S, Al-Omair A, Qattan A, Lehe C, Al-Qudaihi G, Elkum N, Alshabanah M, Bin Amer
S, Tulbah A, Ajarim D, Al-Tweigeri T and Dermime S.
The B7-H1 (PD-L1) T lymphocyte-inhibitory molecule is expressed in breast cancer patients with infiltrating ductal
carcinoma: correlation with important high-risk prognostic
factors. Neoplasia. 2006; 8(3): 190-198.
35. Ghebeh H, Tulbah A, Mohammed S, Elkum N, Bin Amer SM, Al-Tweigeri T and Dermime S. Expression of B7-H1
in breast cancer patients is strongly associated with high
proliferative Ki-67-expressing tumor cells. Int J Cancer. 2007; 121(4): 751-758.
36. Schalper KA, Velcheti V, Carvajal D, Wimberly H, Brown J, Pusztai L and Rimm DL. In situ tumor PD-L1 mRNA expression is associated with increased TILs and better outcome in breast carcinomas. Clin Cancer Res. 2014; 20(10): 2773-2782.
37. Soliman H, Khalil F and Antonia S. PD-L1 expression is increased in a subset of basal type breast cancer cells. PLoS
One. 2014; 9(2): e88557.
38. Mittendorf EA, Philips AV, Meric-Bernstam F, Qiao N, Wu Y, Harrington S, Su X, Wang Y, Gonzalez-Angulo
AM, Akcakanat A, Chawla A, Curran M, Hwu P, et al.
PD-L1 expression in triple-negative breast cancer. Cancer immunology research. 2014; 2(4): 361-370.
39. Muenst S, Schaerli AR, Gao F, Daster S, Trella E, Droeser RA, Muraro MG, Zajac P, Zanetti R, Gillanders WE, Weber WP and Soysal SD. Expression of programmed death ligand 1 (PD-L1) is associated with poor prognosis in human breast cancer. Breast Cancer Res Treat. 2014; 146(1): 15-24.
40. Gatza ML, Lucas JE, Barry WT, Kim JW, Wang Q,
Crawford MD, Datto MB, Kelley M, Mathey-Prevot B,
Potti A and Nevins JR. A pathway-based classification of human breast cancer. Proc Natl Acad Sci U S A. 2010; 107(15): 6994-6999.
41. Velcheti V, Schalper KA, Carvajal DE, Anagnostou VK, Syrigos KN, Sznol M, Herbst RS, Gettinger SN, Chen L and Rimm DL. Programmed death ligand-1 expression in non-small cell lung cancer. Lab Invest. 2014; 94(1): 107-116.
42. Gadiot J, Hooijkaas AI, Kaiser AD, van Tinteren H, van Boven H and Blank C. Overall survival and PD-L1 expression in metastasized malignant melanoma. Cancer. 2011; 117(10): 2192-2201.
43. Rimm D, Schalper K and Pusztai L. Unvalidated antibodies and misleading results. Breast Cancer Res Treat. 2014; 147(2): 457-458.
44. Mu CY, Huang JA, Chen Y, Chen C and Zhang XG. High expression of PD-L1 in lung cancer may contribute to
poor prognosis and tumor cells immune escape through
suppressing tumor infiltrating dendritic cells maturation. Medical oncology. 2011; 28(3): 682-688.
45. Song M, Chen D, Lu B, Wang C, Zhang J, Huang L, Wang X, Timmons CL, Hu J, Liu B, Wu X, Wang L, Wang J, et al. PTEN loss increases PD-L1 protein expression and affects the correlation between PD-L1 expression and clinical parameters in colorectal cancer. PLoS One. 2013; 8(6): e65821.
46. Cancer Genome Atlas N. Comprehensive molecular portraits of human breast tumours. Nature. 2012; 490(7418): 61-70.
47. Lipson EJ, Vincent JG, Loyo M, Kagohara LT, Luber BS, Wang H, Xu H, Nayar SK, Wang TS, Sidransky D, Anders RA, Topalian SL and Taube JM. PD-L1 expression in the
Merkel cell carcinoma microenvironment: association
with inflammation, Merkel cell polyomavirus and overall survival. Cancer immunology research. 2013; 1(1): 54-63. 48. Jacquemier J, Bertucci F, Finetti P, Esterni B,
Charafe-Jauffret E, Thibult ML, Houvenaeghel G, Van den Eynde B, Birnbaum D, Olive D and Xerri L. High expression of
basal-like breast carcinoma. Int J Cancer. 2012; 130(1): 96-104. 49. Karasar P and Esendagli G. T helper responses are
maintained by basal-like breast cancer cells and confer
to immune modulation via upregulation of PD-1 ligands. Breast Cancer Res Treat. 2014; 145(3): 605-614.
50. Bertucci F, Ueno NT, Finetti P, Vermeulen P, Lucci A,
Robertson FM, Marsan M, Iwamoto T, Krishnamurthy S,
Masuda H, Van Dam P, Woodward WA, Cristofanilli M, et al. Gene expression profiles of inflammatory breast cancer:
correlation with response to neoadjuvant chemotherapy and
metastasis-free survival. Ann Oncol. 2014; 25(2): 358-365. 51. Loi S, Sirtaine N, Piette F, Salgado R, Viale G, Van Eenoo
F, Rouas G, Francis P, Crown JP, Hitre E, de Azambuja E, Quinaux E, Di Leo A, et al. Prognostic and predictive value of tumor-infiltrating lymphocytes in a phase III randomized
adjuvant breast cancer trial in node-positive breast cancer comparing the addition of docetaxel to doxorubicin with
doxorubicin-based chemotherapy: BIG 02-98. J Clin Oncol. 2013; 31(7): 860-867.
52. Ono M, Tsuda H, Shimizu C, Yamamoto S, Shibata T,
Yamamoto H, Hirata T, Yonemori K, Ando M, Tamura K, Katsumata N, Kinoshita T, Takiguchi Y, et al.
Tumor-infiltrating lymphocytes are correlated with response to
neoadjuvant chemotherapy in triple-negative breast cancer.
Breast Cancer Res Treat. 2012; 132(3): 793-805.
53. West NR, Milne K, Truong PT, Macpherson N, Nelson BH and Watson PH. Tumor-infiltrating lymphocytes predict
response to anthracycline-based chemotherapy in estrogen
receptor-negative breast cancer. Breast Cancer Res. 2011; 13(6): R126.
54. Ramakrishnan R and Gabrilovich DI. Mechanism of
synergistic effect of chemotherapy and immunotherapy of
cancer. Cancer immunology, immunotherapy : CII. 2011; 60(3): 419-423.
55. Vacchelli E, Senovilla L, Eggermont A, Fridman WH, Galon J, Zitvogel L, Kroemer G and Galluzzi L. Trial
watch: Chemotherapy with immunogenic cell death
inducers. Oncoimmunology. 2013; 2(3): e23510.
56. Bertucci F, Finetti P, Cervera N, Charafe-Jauffret E, Mamessier E, Adelaide J, Debono S, Houvenaeghel G, Maraninchi D, Viens P, Charpin C, Jacquemier J and Birnbaum D. Gene expression profiling shows medullary
breast cancer is a subgroup of basal breast cancers. Cancer
Res. 2006; 66(9): 4636-4644.
57. Charafe-Jauffret E, Ginestier C, Monville F, Finetti P, Adelaide J, Cervera N, Fekairi S, Xerri L, Jacquemier J, Birnbaum D and Bertucci F. Gene expression profiling of breast cell lines identifies potential new basal markers. Oncogene. 2006; in press.
58. Ross DT and Perou CM. A comparison of gene expression
signatures from breast tumors and breast tissue derived cell
lines. Dis Markers. 2001; 17(2): 99-109.
59. Irizarry RA, Hobbs B, Collin F, Beazer-Barclay YD, Antonellis KJ, Scherf U and Speed TP. Exploration,
normalization, and summaries of high density
oligonucleotide array probe level data. Biostatistics. 2003;
4(2): 249-264.
60. Lehmann BD, Bauer JA, Chen X, Sanders ME, Chakravarthy AB, Shyr Y and Pietenpol JA. Identification
of human triple-negative breast cancer subtypes and
preclinical models for selection of targeted therapies. J Clin Invest. 2011; 121(7): 2750-2767.
61. Parker JS, Mullins M, Cheang MC, Leung S, Voduc D, Vickery T, Davies S, Fauron C, He X, Hu Z, Quackenbush JF, Stijleman IJ, Palazzo J, et al. Supervised risk predictor of breast cancer based on intrinsic subtypes. J Clin Oncol. 2009; 27(8): 1160-1167.
62. Finetti P, Cervera N, Charafe-Jauffret E, Chabannon C, Charpin C, Chaffanet M, Jacquemier J, Viens P, Birnbaum D and Bertucci F. Sixteen-kinase gene expression identifies
luminal breast cancers with poor prognosis. Cancer Res.
2008; 68(3): 767-776.
63. Guedj M, Marisa L, de Reynies A, Orsetti B, Schiappa R, Bibeau F, Macgrogan G, Lerebours F, Finetti P, Longy M, Bertheau P, Bertrand F, Bonnet F, et al. A refined molecular taxonomy of breast cancer. Oncogene. 2011.
64. Ivshina AV, George J, Senko O, Mow B, Putti TC, Smeds J, Lindahl T, Pawitan Y, Hall P, Nordgren H, Wong JE, Liu ET, Bergh J, et al. Genetic reclassification of histologic
grade delineates new clinical subtypes of breast cancer.
Cancer Res. 2006; 66(21): 10292-10301.
65. Adelaide J, Finetti P, Bekhouche I, Repellini L, Geneix J, Sircoulomb F, Charafe-Jauffret E, Cervera N, Desplans J, Parzy D, Schoenmakers E, Viens P, Jacquemier J, et al. Integrated profiling of basal and luminal breast cancers. Cancer Res. 2007; 67(24): 11565-11575.
66. Ellis MJ, Ding L, Shen D, Luo J, Suman VJ, Wallis JW, Van Tine BA, Hoog J, Goiffon RJ, Goldstein TC, Ng S, Lin L, Crowder R, et al. Whole-genome analysis informs
breast cancer response to aromatase inhibition. Nature.
2012; 486(7403): 353-360.
67. Curtis C, Shah SP, Chin SF, Turashvili G, Rueda OM, Dunning MJ, Speed D, Lynch AG, Samarajiwa S, Yuan
Y, Graf S, Ha G, Haffari G, et al. The genomic and transcriptomic architecture of 2,000 breast tumours reveals
novel subgroups. Nature. 2012; 486(7403): 346-352. 68. Jonsson G, Staaf J, Vallon-Christersson J, Ringner M,
Holm K, Hegardt C, Gunnarsson H, Fagerholm R, Strand
C, Agnarsson BA, Kilpivaara O, Luts L, Heikkila P, et al. Genomic subtypes of breast cancer identified by array-comparative genomic hybridization display distinct
molecular and clinical characteristics. Breast Cancer Res.
2010; 12(3): R42.
P, Saade MR, Manai M, Carbuccia N, Bekhouche I,
Letessier A, Raynaud S, Charafe-Jauffret E, Jacquemier J, et al. Candidate target genes of luminal B breast cancers identified by genome, gene expression and DNA methylation profiling. PLoS ONE. 2014; in press.
71. McShane LM, Altman DG, Sauerbrei W, Taube SE,
Gion M, Clark GM and Statistics Subcommittee of the