M E T H O D
Open Access
Simultaneous profiling of transcriptome
and DNA methylome from a single cell
Youjin Hu
1,2†, Kevin Huang
1,3†, Qin An
1, Guizhen Du
1, Ganlu Hu
2, Jinfeng Xue
2, Xianmin Zhu
2, Cun-Yu Wang
3,
Zhigang Xue
2,4*and Guoping Fan
1*Abstract
Background:Single-cell transcriptome and single-cell methylome technologies have become powerful tools to study RNA and DNA methylation profiles of single cells at a genome-wide scale. A major challenge has been to understand the direct correlation of DNA methylation and gene expression within single-cells. Due to large cell-to-cell variability and the lack of direct measurements of transcriptome and methylome of the same cell, the association is still unclear. Results:Here, we describe a novel method (scMT-seq) that simultaneously profiles both DNA methylome and transcriptome from the same cell. In sensory neurons, we consistently identify transcriptome and methylome heterogeneity among single cells but the majority of the expression variance is not explained by proximal promoter methylation, with the exception of genes that do not contain CpG islands. By contrast, gene body methylation is positively associated with gene expression for only those genes that contain a CpG island promoter. Furthermore, using single nucleotide polymorphism patterns from our hybrid mouse model, we also find positive correlation of allelic gene body methylation with allelic expression.
Conclusions:Our method can be used to detect transcriptome, methylome, and single nucleotide polymorphism information within single cells to dissect the mechanisms of epigenetic gene regulation.
Keywords:Single-cell methylome, Single-cell transcriptome, Sensory neurons, Dorsal root ganglion, Gene regulation
Background
DNA methylation involves the covalent attachment of a methyl group to the fifth carbon of cytosine. It is thought that such a modification plays a critical role in regulating gene expression for tissue- and cell-specific transcriptional programs [1–3]. The current model suggests that promoter methylation stably silences gene expression, particularly in the regulation of developmental and tissue-specific gene ex-pression [4]. However, most of the previous studies analyze the correlation of DNA methylation with gene transcription in bulk cell populations. It is still unclear whether variations of gene expression at the single-cell level can be explained by differential methylation at individual gene promoters. In fact, it would be necessary to integrate methylome and
transcriptome analysis in a single cell to provide a direct connection between DNA methylation and gene transcrip-tion at a given gene locus [5–8].
In recent years, we have seen the rapid development of single-cell genomics methods such as single-cell RNA sequencing (RNA-seq) [9–11], single-cell bisulfite se-quencing (BS-seq) [12], and single-cell reduced repre-sentation bisulfite sequencing (RRBS) [13] to profile transcriptome and DNA methylome at the genome scale. These studies have revealed important biology with regards to cellular heterogeneity and developmental mechanisms [11, 14–17]. To further understand the cor-relation of DNA methylation and transcriptome within the same cell, we developed a simultaneous single-cell methylome and transcriptome sequencing (scMT-seq) method, in which cytosolic RNA is isolated for RNA-seq whereas genomic DNA from the same nucleus is subject to DNA methylome profiling. Our study uncovered complex relationships between gene expression and DNA methylation in proximal promoter and gene body regions within a single cell.
* Correspondence:[email protected];[email protected] †Equal contributors
2Translational Center for Stem Cell Research, Tongji Hospital, Department of
Regenerative Medicine, Tongji University School of Medicine, Shanghai 200065, China
1Department of Human Genetics, David Geffen School of Medicine, UCLA,
695 Charles Young Drive South, Los Angeles, CA 90095, USA Full list of author information is available at the end of the article
Results
Cytosol transcriptome resembles the whole-cell transcriptome
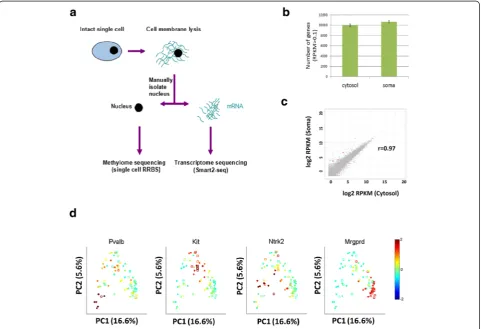
To study the transcriptome of cytosolic RNA from a single cell, we performed single-cell RNA-seq from individual sen-sory neurons isolated from adult mouse dorsal root gan-glion (DRG). These cells tend to be large (20–50 microns in diameter) and enable facile micro-manipulation. Briefly, adult mouse DRG was freshly dissected and dissociated into single cells, then individually transferred to a droplet of cell membrane lysis buffer. Since the lysis buffer does not lyse the nuclear membrane, the cytosolic fraction can be manually separated from nucleus by micropipette ma-nipulation. The cytosolic fraction was then subjected to transcriptome profiling via the Smart2-seq protocol [18], while the isolated nucleus was subjected to methylome analysis by using a modified single-cell RRBS protocol [19] (Fig. 1a).
To control for technical variations in the micro-pipetting technique, we performed a “merge-and-split” experiment for nine pairs of single-cell cytosolic RNA. Principal component analysis (PCA) indicated that each of the “merged-and-split” pair share greater similarity within the pair than with other pairs (Additional file 1: Figure S1A). Furthermore, technical variation was assessed by analyzing the consistency of amplified ERCC RNAs that were spiked into scRNA-seq libraries. The Pearson correl-ation of ERCC RNAs among different cells were highly similar (r >0.88) (Additional file 1: Figure S1B).
With the technical assurance aside, we generated RNA-seq libraries from 44 cytosol and 35 single soma samples that were sequenced with an average of 2 million reads per sample. We found that cytosol seq and soma RNA-seq detected 9947 ± 283 and 10,640 ± 237 (mean ± SEM) genes respectively (Fig. 1b). Moreover, by computing the coefficient of variance as a function of read depth for each
Fig. 1Single-cell cytosol transcriptome resembles single-soma transcriptome.aSchematicof the single-cell transcriptome and methylome sequencing (scMT-seq) method.bComparison of single-cell cytosol RNA-seq and soma RNA-seq in terms of the coverage of gene number. Only genes with reads per kilobase per million (RPKM) >0.1 were counted.cScatter plotof transcript expression levels in cytosol (x-axis) or soma (y-axis) samples.Red dots
[image:2.595.58.540.337.666.2]gene, we found that cytosol and soma exhibit nearly identi-cal levels of techniidenti-cal variation across all levels of gene ex-pression (Additional file 1: Figure S2).
Consistently, Pearson correlation analysis showed that the transcriptome of cytosolic RNA is highly correlated with RNA from the soma (r = 0.97, Fig. 1c). Differential expression analysis showed only 3 out of 10,640 genes (0.03 %) were significantly different between cytosol and soma (false discovery rate [FDR] <0.01), includingComp,
Serpina3i, and A330023F24Rik. PCA clustering revealed that all samples clustered into four major subgroups, consistent with previous subclassification of sensory neurons [11]. For example, DRG cells were positive for different marker genes of various neuronal subtypes such as: (1) peptidergic (Kitpositive); (2) non-peptidergic (Mrgprd positive); (3) low threshold mechanoreceptors (Ntrk2 positive); and (4) proprioceptive (Pvalb positive) neurons (Fig. 1d). Cytosol and soma samples were found evenly distributed across the four major clusters without any apparent biases, further indicating that the transcrip-tome of cytosol and soma are highly similar. Together, these results demonstrate that the cytosolic transcriptome can robustly represent the soma transcriptome.
Simultaneous DNA methylome analysis in conjunction with single-cell cytosol RNA-seq
In parallel to cytosol RNA-seq, we extracted DNA from the nucleus of the same cell and performed methylome profiling using a modified single-cell RRBS (scRRBS) method [13]. On average, we sequenced each sample to a depth of 6.7 million reads, which is sufficient to calcu-late the vast majority of CpGs as indicated by saturation
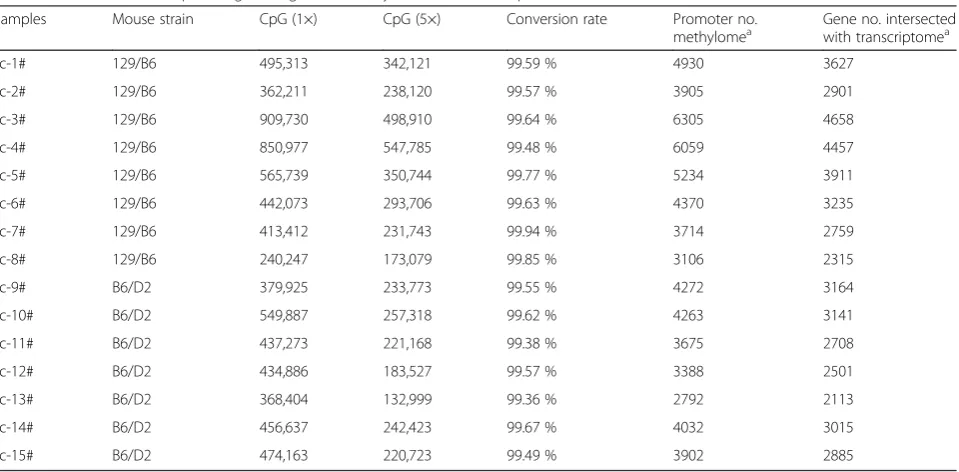
analysis (Additional file 1: Figure S3). Bisulfite conver-sion efficiency was consistently greater than 99.4 % as estimated by analyzing conversion of unmethylated spike-in lambda DNAs (Table 1). The average number of CpG sites assayed per single nucleus was 482,081, in the range of 240,247–850,977 (Table 1). In addition, we examined the CpG islands (CGI) coverage as RRBS is biased for covering regions rich in CpG sites. In silico
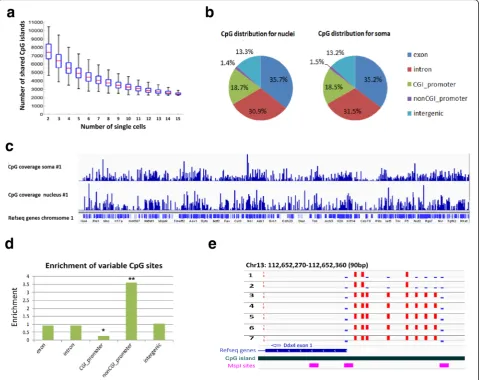
digestion revealed that 14,642 out of all possible 16,023 CGI (91 %) in the mouse genome can be covered by at least one RRBS fragment. In our experiments, we found that each cell can cover an average of 65 % CGIs, in the range of 50–80 %. Between any two single cells, the me-dian number of shared CGI covered is 7200. Moreover, about 3200 CGIs are commonly covered between 15 libraries (Fig. 2a). Together, these data indicate a high concordance of coverage for CGI.
Coverage comparisons between the single DRG nucleus methylome and the single DRG soma methy-lome did not reveal any substantial differences (Fig. 2b, c, and Additional file 1: Table S1). Both nucleus and soma methylomes could cover on average approximately 277,000 CpG sites (> = 5 reads), which is similar to data generated from a previous report describing scRRBS [13] (Additional file 1: Table S1). As expected, nuclear and soma methylomes are by and large equivalent.
[image:3.595.60.540.488.724.2]To study methylation heterogeneity among single cells, we first examined CpG sites that were differentially methylated among individual cells. As RRBS predomin-antly covers regions of high CG density which are frequently hypomethylated, it is expected that no differ-ence would be found in the majority of CGs in CGIs.
Table 1Simultaneous sequencing of single-cell methylome and transcriptome
Samples Mouse strain CpG (1×) CpG (5×) Conversion rate Promoter no.
methylomea Gene no. intersectedwith transcriptomea
sc-1# 129/B6 495,313 342,121 99.59 % 4930 3627
sc-2# 129/B6 362,211 238,120 99.57 % 3905 2901
sc-3# 129/B6 909,730 498,910 99.64 % 6305 4658
sc-4# 129/B6 850,977 547,785 99.48 % 6059 4457
sc-5# 129/B6 565,739 350,744 99.77 % 5234 3911
sc-6# 129/B6 442,073 293,706 99.63 % 4370 3235
sc-7# 129/B6 413,412 231,743 99.94 % 3714 2759
sc-8# 129/B6 240,247 173,079 99.85 % 3106 2315
sc-9# B6/D2 379,925 233,773 99.55 % 4272 3164
sc-10# B6/D2 549,887 257,318 99.62 % 4263 3141
sc-11# B6/D2 437,273 221,168 99.38 % 3675 2708
sc-12# B6/D2 434,886 183,527 99.57 % 3388 2501
sc-13# B6/D2 368,404 132,999 99.36 % 2792 2113
sc-14# B6/D2 456,637 242,423 99.67 % 4032 3015
sc-15# B6/D2 474,163 220,723 99.49 % 3902 2885
a
However, by examining the variance of individual CpG sites that were shared in at least 50 % of the samples (n >8), we identified ~6800 CpG sites that were sig-nificantly variable (FDR <1 %, F-test, Additional file 1: Figure S4). Genomic annotation of these differentially methylated CG sites revealed a 3.6-fold enrichment at non-CGI promoters and a 3.8-fold depletion at CGI pro-moters compared to the background of total CpG sites tested (p <10−8, binomial test, Fig. 2d, Additional file 1: Figure S5). While this result suggests that CpG methyla-tion in non-CGI regions significantly contributes to the methylome variation between cells, we also found differ-ential DNA methylation in individual CGIs in adult DRG neurons. Fig. 2e shows a representative locus with
differential methylated CpG sites at CGI promoter region of Ddx4. Among ten CpG sites with this region, three CpGs were found to be fully methylated while two were fully unmethylated among all seven neurons. The remaining five CpG sites were methylated in five neurons but unmethylated in two other neurons. Taken all together, our single-cell methylome analysis uncovered regions of methylation heterogeneity among individual DRG neurons.
Correlation of proximal promoter DNA methylation with gene expression in a single neuron
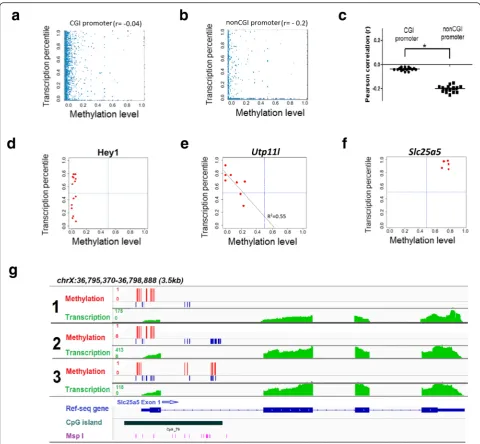
[image:4.595.59.541.89.469.2]opportunity to investigate the genome-wide correlation of methylation and transcription in the same cell. Among the 4263 ± 258 (mean ± SEM; n = 15) promoters analyzed for both DNA methylation and RNA transcrip-tion, we found messenger RNA (mRNA) transcripts in 3159 ± 189 (74.2 %) genes (reads per kilobase per million [RPKM] >0.1) (Table 1). The remaining fraction of genes (~26 %) are either silenced or expressed at very low levels (RPKM <0.1). Overall, consistent with previous findings, our data indicated that promoter methylation is negatively correlated with gene expression (Additional file 1: Figure S6). However, by subclassifying promoters into CGI versus non-CGI promoters, we found that most of the negative correlation is driven by non-CGI pro-moters. CGI promoters are predominantly hypomethy-lated and have no predictive power on gene activity (Pearson =−0.05) (Fig. 3a, Additional file 1: Figure S7). By contrast, methylation of non-CGI promoters showed a stronger anti-correlation with transcriptional activity (Pearson =−0.22) (Fig. 3b, c, Additional file 1: Figure S8).
We next examined the correlation of promoter methyla-tion with gene transcripmethyla-tion for individual genes across cells. For those hypomethylated gene promoters, we found that 49 % of genes are expressed at similar levels across all cells, consistently either low or highly expressed as repre-sented byZfp609andRps18(Additional file 1: Figure S9). On the other hand, the other 51 % of hypomethylated genes exhibit dynamic expression across cells (i.e. genes that exhibit differential gene expression irrespective of gene promoter methylation). For example, Hey1 gene promoter is constitutively hypomethylated but is highly expressed in 7/14 (50 %) cells and low expressed in the other seven cells (50 %) (Fig. 3d). Together, these data sug-gest that other factors are involved in regulating genes with hypomethylated promoters.
We next took a reverse approach and examined genes with promoters that were variably methylated between single cells. In total, we identified 23 gene promoters that were variably methylated, six (26.1 %) of which were significantly correlated with gene transcription (p<0.05, Fisher’s Transformation). These genes include Utp11l,
Ubl4, and Atg13 (Fig. 3e). Interestingly, we identified a rare subset of CpG rich gene promoters that are hyper-methylated but still highly expressed. For instance, the X chromosomal linked gene Slc25a5, a member of the mitochondrial carrier subfamily of solute carrier protein genes, shows high and robust expression despite a fully methylated promoter. There is no clear evidence for any alternative promoters or neighboring genes that could explain the high expression (Fig. 3f ). However, we still observed the CpG hypermethylation around the TSS and the high expression of this gene (Fig. 3g). Collect-ively, these data paint a complex picture for the role of promoter methylation in gene regulation.
Correlation of gene body methylation with gene expression
Unlike promoter methylation, gene bodies show a wide spectrum of methylation in individual cells (Fig. 4a, Additional file 1: Figure S10). However, the role of gene body methylation is not well studied. As a whole, gene body methylation tends to positively correlate with gene expression (Pearson = 0.06, Fig. 4a). By further subclassi-fying gene bodies by their promoter (either CGI or non-CGI promoters), we found that gene body methylation is positively correlated with CGI promoter genes (r= 0.13), but not with non-CGI promoter genes (Fig. 4b). Further-more, we examined the correlation of methylation with transcription for 606 genes with differential gene body methylation level between single cells. Transcription of 29 genes (4.8 %) were found to be positively correlated with changes in gene body methylation, 65.5 % of which were CGI promoter genes such as B4galnt4, C1qtnf4,
Ccdc9, Clasrp, Jag2, Mxra7,Tcf3, and Trib2 (Fig. 4c, d). Together, these results indicate that gene body methyla-tion would be a better indicator of gene transcripmethyla-tion levels compared to promoter methylation for CGI pro-moter genes. By contrast, proximal propro-moter would be a better indicator of gene transcription for non-CGI pro-moter genes.
one of two possible alleles (Fig. 5b). Interestingly, bi-allelic RRBS fragments tend to have greater non-bimodal states, indicating true differences in allelic methylation (Fig. 5c). Nonetheless, bi-allelic fragments still showed a majority in a hypomethylated state, consistent with the overall target regions captured by RRBS.
We next examined the correlation of allelic methylation with allelic expression patterns. Because our F2 hybrid mouse contains regions where C57BL/6 J can be bi-allelic, we only examined the influence of maternally derived DBA/2 J SNPs on DBA/2 J transcripts. Only highly expressed genes were considered for analysis to ensure Fig. 3Simultaneous profiling of promoter methylation and gene expression from a single neuron.aRepresentativescatter plotfor CGI promoter methylation level and transcription level of genes at whole genome wide within a representative single cell. Promoter methylation level was calculated by the ratio of methylated CpG sites over all CpG sites within the promoter region. Expression level was transformed to expression percentile.bRepresentativescatter plotfor non-CGI promoter methylation level and transcription level of individual genes within a representative single cell.cDot plot of Pearson correlation coefficients between transcription level (as expression percentile) and promoter methylation. dRepresentative example of genes with hypomethylation promoter and dynamic expression. Eachpointrepresents a single cell.eRepresentative example of genes that differential promoter methylation is negatively correlated with gene expression. Eachpointrepresents a single cell.fRepresentative example of genes with hypermethylation promoter and high expression. Eachpointrepresents a single cell.gGenomebrowser tracksforSlc25a5
showing promoter hypermethylation and high gene expression in three representative male single cells.Red barsindicate the methylation CpG sites andblue barsindicate the unmethylated CpG sites. RNA transcription level is shown ingreen. The CpG island reference and MspI cut sites are in
[image:6.595.57.538.86.530.2]sufficient SNP coverage. In this proof-of-principle analysis, we detected between 5 and 30 genes per cell that are cov-ered by DBA/2 J SNPs in both scRRBS and scRNA-seq fractions, depending on coverage of the respective librar-ies. Nonetheless, using this method we were able to find correlations between DBA/2 J specific gene body methyla-tion and its effect on gene expression (Fig. 5d). This method provides a potential way to discover the correl-ation of allelic-specific methylcorrel-ation and gene transcription by using the SNP information at single-cell level.
Discussion
In this study, we established a method to simultaneously profile both the transcriptome and DNA methylome from the same DRG neuron. We investigated the correl-ation of mRNA transcription with DNA methylcorrel-ation in either promoter or gene body at a single-allele level within single cells. We conclude that gene activity can be more reliably predicted using either gene promoter or gene body methylation based on the CpG content of the promoter. Specifically, promoter methylation is in-versely correlated with non-CGI promoter genes and gene body methylation is positively correlated with genes containing CGI promoters.
Previously, based on transcriptome and methylome analysis of bulk rat DRG cells, Hartung et al. [20] found that high CpG density promoter are consistently hypo-methylated while the corresponding gene body are dif-ferentially methylated between high and low expressed genes. In a separate study using the DRG injury model in rats, thousands of CpG sites were reported to be differentially methylated, but a minimal number were associated with changes in gene expression [21]. The discrepancy between these two published studies may be due to the differences in sample preparation of bulk tis-sues. The DRG represents heterogeneous population of neuronal and glial cells, in which sensory neurons are further divided in many subtypes based on marker gene expression (e.g. TrkA, TrkB, and TrkC expression). More recently, the DRG neuronal cells are further subdi-vided into 11 subtypes based on single-cell RNA tran-scriptome analysis [11]. Thus, the previous bulk studies are susceptible to variance due to differences in subtype representation during sample collection. In addition, any meaningful differences between subtypes may be masked in bulk preparations.
[image:7.595.61.540.87.370.2]promoters but not non-CGI promoter at the single-cell resolution. Recently, based on meta-analysis of genome-wide methylation, mRNA expression, and chromatin modifications, Jjingo et al. suggest that gene-body methylation levels are predominantly shaped via the accessibility of the DNA to methylating enzyme com-plexes [22]. Our current study shows that gene expres-sion level of CGI promoter genes is higher than non-CGI promoter genes in single DRG neurons (Additional file 1: Figure S11, t test,p<10−4), consistent with this hy-pothesis. In addition, Karlic reported that different histone modifications can be used to predict the gene expression driven by high CpG content promoters (HCP) or low CpG promoters (LCP). They found that H4K20me1 are enriched in HCP gene body but not in LCP gene body [23]. These findings implicate that histone modification may influence the accessibility of the DNA to DNA meth-yltransferase complexes, leading to different correlation of gene body methylation with gene expression for CGI versus non-CGI promoter genes.
The number of genes detected by scMT-seq (around 10,000) is comparable with the coverage achieved by traditional Smart2-seq using single-cell soma. Although we found that a small set of genes that are more enriched in soma, these genes only account for 0.03 % of all the genes detected. These results are consistent with another study comparing cytosolic, nuclear, and soma
RNA fractions [24]. Although they identified 192 genes that are unique to the neuronal nucleus, none of these genes overlapped with genes specifically expressed in soma compared to cytosol in our dataset. This could be explained by nuclear RNA representing only a tiny frac-tion of entire cell body RNA [25].
While this study is in revision, Angermueller published a method named “scM&T” to analyze transcriptome DNA methylome for single cells [26]. Compared to their method of methylome analysis via whole genome bisul-fite sequencing [26], our method via scRRBS is a well-established protocol for being cost-effective and reliable in covering CGIs and other CpG regions blanked by the MspI (CCGG) restriction site. Indeed, even with low sequencing depth, our results showed similar level of overlap of CGI with scM&T [12, 26]. More recently, Hou et al. reported a similar method named scTrio-seq based on scRRBS to detect transcriptome and methy-lome for single cells through physical separation of RNA and nucleus [27]. While the conclusions between their study and ours are largely similar, we find that scTrio-seq has a much lower transcriptome coverage (6200 vs. 9900), likely due to major different experimental approaches to isolate cytosol RNA. Nonetheless, both methods provide a simple and cost-effective way to isolate DNA and RNA for integrated methylome and tran-scription analysis.
[image:8.595.58.539.88.300.2]Our current scMT-seq method has several limitations that should be overcome with future technology. For ex-ample, scRRBS only covers approximately 1 % of CpG sites across the whole genome, while single-cell whole genome bisulfite sequencing could cover up to 48.4 % of CpG sites of the whole genome [12], enabling more comprehensive analysis of DNA methylation and RNA transcription. Another limitation of our method is a high rate of allele drop-out, making it less suitable for analysis of those genes that are differentially expressed between alleles due to differential methylation. Improvements in the following aspects could improve the coverage of methylation detect of both alleles: optimize the bisulfite treatment condition to reduce the degradation of DNA as well as the purification methods to reduce the sto-chastic loss of DNA, and improve the adapter ligation efficiency to capture more DNA fragments.
Conclusion
Integrating DNA methylome and transcriptome analysis would provide a direct correlation between DNA methy-lation and gene transcription. By developing the current scMT-seq method, we achieved simultaneous profiling of transcriptome and DNA methylome from a single neuron. Our integrated analysis shows that methylation of non-CGI promoters is better anti-correlated with gene transcription while gene body methylation of CGI promoter genes is better correlated with gene transcrip-tion. Our results lay a solid foundation to study epigen-etic mechanism underlying neuronal gene expression at a single-cell level.
Methods
Animals and isolation of DRG neurons
Animals were kept in cages under 12-h light–dark con-ditions. In this study, we used several strains of adult mice for technology development including 129/B6 out-breed or F1 hybrid (C57BL/6 J × DBA/2 J [B6/D2]) or F2 hybrid mice (F1 female B6/D2 mice backcrossed with C57BL/6 J [B6] males). Adult lumbar DRGs (L4, L5) were dissected and dissociated with trypsin according to a published protocol [28]. After being dissociated into single cells, samples were incubated in DMEM medium containing 10 % FBS.
Isolation of nucleus and cytoplasma from a single DRG neuron
Single cells were picked by using micro-capillary pipette under microscope. Single cells were incubated in a drop of cell membrane-selective lysis buffer (2 % Triton, 20 mM NaCl, and 20 mM Tris, 2 U/uL RNase inhibitor, 1:40,000 ERCC) [29], which was on the wall of a PCR tube. After incubation for 5 min, the cell membrane was lysed thoroughly and the cell nucleus was exposed. The
nucleus was picked by a micro capillary pipette in 0.2μL buffer and transferred into another PCR tube containing 4 uL RRBS lysis buffer. A total of 1 μl oligo-dT primer (10 μM) and 1 μ dNTP (10 mM) were added into the tube including cytosol RNA. After briefly centrifuging, the tubes containing nucleus and cytosol, respect-ively, were put on dry ice immediately, and trans-ferred to −80 °C until the next step.
We used 50 DRG single cells to isolate DNA and RNA. Forty-four of the 50 (88 %) RNA-seq libraries passed quality check after sequencing. However, for the DNA fraction, only 15 of 22 (or 68 %) libraries con-structed passed quality filter after sequencing. Major sources of failure among scRRBS appear to be no ampli-fication (did not show bands after PCR) or lower library complexity.
Merge-and-split experiments
To test the technical variance of micropipette, cytosols of two individual cells were merged together and split into two equal parts by micropippette. Briefly, two single cells were transferred to 4μL lysis buffer and incubated for 5 min. After picking out the two nuclei, the rest of the solution was mixed and split into two tubes by micropipette. Libraries were made by the following protocol and sequenced on the Illumina Mi-seq machine following manufacturer’s specifications.
Single-cell RNA-seq library construction
Single-cell complementary DNA was amplified from the tubes containing cytosol according to the Smart2-seq protocol. Instead of using Superscript II, we used Super-script III for reverse tranSuper-scription. After amplification and purification, 0.1 ng cDNA was used for Nextera Tagmentation and library construction. Library quality was assessed using Agilent Bioanalyzer 2100.
Single-nucleus (cell) RRBS library construction
RNA-seq analysis
Raw reads from library sequencing were mapped to the mouse (mm10) genome using default parameters in STAR aligner [30]. Reads that failed to map to the genome were re-mapped to their respective mRNA sequences to cap-ture reads that span exons. Only reads that were uniquely aligned were retained. Data normalization was performed by transforming uniquely mapped transcript reads to RPKM using a previous established pipeline [15]. Genes with low expression (average RPKM <0.1) were filtered out, followed by quantile normalization. Samples were ex-cluded based on a variety of quality assessments. Libraries with poor alignment (<20 %) and poor gene coverage (<3000 genes with RPKM >1) were excluded. Clustering analysis and PCA analysis were performed by using built-in functions built-in Matlab.
Differential expressed analysis between cytosol and soma was implemented in DESeq [31]. Genes that are not expressed in any samples were not taken into con-sideration. For each gene, DESeq reports its mean read count in cytosol, soma, and the adjusted pvalue testing for differential expression. These mean counts were plot-ted and those genes under threshold of p <0.01 were significantly differentially expressed between cytosol and soma and marked as three red dots in Fig. 1c.
Methylation analysis
Raw reads for the scRRBS libraries were mapped to the mouse (mm10) genome using the default parameters in BS-seeker2 for RRBS mapping. Methylation calling was performed as previously described [32]. CpG sites that were covered by more than 1 or 5 reads were counted, respectively. To evaluate whether the variance we ob-served at individual CpG sites is greater than what would be expected from the entire population of CpGs across all samples (null distribution), we used a test of variance, also known as the F-test, and performed multiple-testing using the Benjamini–Hochberg method. For promoter methylation calculation, CpG sites that are located 500 bp upstream of the transcription start site (TSS) were counted; methylation level for promoter (with more than 5 CpG sites detected) and gene body region (with CpG sites more than 0.5 kb detected) were calculated by using bedtools package.
Gene transcription and methylation level correlation analysis
Transcription level (RPKM) was transformed into per-centile rank. Correlation of transcription and methyla-tion was calculated by Pearson correlamethyla-tion in R. The average methylation level for promoter and gene body detected was calculated and its correlation with corre-sponding transcription was examined for those genes de-tected in more than five cells.
SNP analysis
RNA-seq data of single cells derived from F2 hybrid mice (offspring of F1 female [DBA/2 J × C57BL/6 J] backcrossed with male B6) was subjected to SNP ana-lysis. DBA/2 J annotated SNPs were downloaded from the Wellcome Trust Sanger Institute (dbSNP142). SNP calling followed the GATK Best Practices guideline (version 3.5). Briefly, raw reads were mapped to the mm10 genome using STAR aligner using default param-eters followed by base quality scores recalibration. SNP calling was performed jointly for all 15 cytosol samples using the HaplotypeCaller function with default parame-ters. Only annotated SNP hits with QD score greater than 20 and FS score less than 60 were accepted for downstream analysis. DBA/2 J allelic expression was estimated by taking the average allelic balance across all SNPs within a gene then multiplied by the genes overall RPKM.
SNP calling in RRBS libraries were done by traversing pileups of RRBS fragments with the DBA/2 J SNP refer-ence. C-T SNPs were ignored and only SNPs with cover-age of 5 reads were accepted.
Availability of data and material
All the related data can be downloaded from GEO with the accession number GSE76483.
Ethics
All the procedures are performed according to institu-tional guidelines and approved by animal research com-mittee of UCLA (protocol 2001-045-41).
Additional file
Additional file 1:Contains Supplementary Figures 1–11 and Supplementary Table 1. (PDF 1536 kb)
Abbreviations
CGI:CpG island; DRG: Dorsal root ganglion; scMT-seq: single cell methylome and transcriptome sequencing.
Competing interests
The authors declare that they have no competing interests.
Authors’contributions
HY, KH, ZX, and GF designed the study. YH, KH, and QA analyzed the data and performed statistical analyses. YH, GD, GH, JX, and XZ performed experiments or contributed critical reagents and protocols. YH, KH, and GF interpreted the data and wrote the manuscript in discussion with all authors. All authors read and approved the manuscript.
Acknowledgements
Program) (2015CB964702, 2015CB964601); Joint Research Fund for Overseas Chinese, Hong Kong and Macao Young Scholars (31428016); National Natural Science Foundation of China (Key Program 81430026); Experimental Animal Research Fund, Science and Technology Commission of Shanghai Municipality (15140903900); Shanghai Municipal Commission of Health and Family Planning (XBR2013094); and Jiangsu Science and Technology Planning Project (BM2014052). YH was supported by Chinese National Overseas Postdoc Scholarship (2013–057). KH is supported by a National Institute of Arthritis and Musculoskeletal and Skin Diseases training grant (T32AR059033).
Author details
1
Department of Human Genetics, David Geffen School of Medicine, UCLA, 695 Charles Young Drive South, Los Angeles, CA 90095, USA.2Translational Center for Stem Cell Research, Tongji Hospital, Department of Regenerative Medicine, Tongji University School of Medicine, Shanghai 200065, China. 3
Division of Oral Biology and Medicine, Laboratory of Molecular Signaling, University of California Los Angeles, Los Angeles, CA 90095, USA.4Suzhou Institute, Tongji University, Suzhou, Jiangsu Province 215101, China.
Received: 14 March 2016 Accepted: 13 April 2016
References
1. Yoder JA, Walsh CP, Bestor TH. Cytosine methylation and the ecology of intragenomic parasites. Trends Genet. 1997;13:335–40.
2. Zhang M, Xu C, von Wettstein D, Liu B. Tissue-specific differences in cytosine methylation and their association with differential gene expression in sorghum. Plant Physiol. 2011;156:1955–66.
3. Laurent L, Wong E, Li G, Huynh T, Tsirigos A, Ong CT, et al. Dynamic changes in the human methylome during differentiation. Genome Res. 2010;20:320–31.
4. Bird A. DNA methylation patterns and epigenetic memory. Genes Dev. 2002;16:6–21.
5. Wagner JR, Busche S, Ge B, Kwan T, Pastinen T, Blanchette M. The relationship between DNA methylation, genetic and expression inter-individual variation in untransformed human fibroblasts. Genome Biol. 2014;15:R37.
6. Sato Y, Yoshizato T, Shiraishi Y, Maekawa S, Okuno Y, Kamura T, et al. Integrated molecular analysis of clear-cell renal cell carcinoma. Nat Genet. 2013;45:860–7.
7. Liu Z, Jiang R, Yuan S, Wang N, Feng Y, Hu G, et al. Integrated analysis of DNA methylation and RNA transcriptome during in vitro differentiation of human pluripotent stem cells into retinal pigment epithelial cells. PLoS One. 2014;9:e91416.
8. Rhee JK, Kim K, Chae H, Evans J, Yan P, Zhang BT, et al. Integrated analysis of genome-wide DNA methylation and gene expression profiles in molecular subtypes of breast cancer. Nucleic Acids Res. 2013;41:8464–74. 9. Patel AP, Tirosh I, Trombetta JJ, Shalek AK, Gillespie SM, Wakimoto H, et al.
Single-cell RNA-seq highlights intratumoral heterogeneity in primary glioblastoma. Science. 2014;344:1396–401.
10. Picelli S, Bjorklund AK, Faridani OR, Sagasser S, Winberg G, Sandberg R. Smart-seq2 for sensitive full-length transcriptome profiling in single cells. Nat Methods. 2013;10:1096–8.
11. Usoskin D, Furlan A, Islam S, Abdo H, Lonnerberg P, Lou D, et al. Unbiased classification of sensory neuron types by large-scale single-cell RNA sequencing. Nat Neurosci. 2015;18:145–53.
12. Smallwood SA, Lee HJ, Angermueller C, Krueger F, Saadeh H, Peat J, et al. Single-cell genome-wide bisulfite sequencing for assessing epigenetic heterogeneity. Nat Methods. 2014;11:817–20.
13. Guo H, Zhu P, Wu X, Li X, Wen L, Tang F. Single-cell methylome landscapes of mouse embryonic stem cells and early embryos analyzed using reduced representation bisulfite sequencing. Genome Res. 2013;23:2126–35. 14. Zeisel A, Munoz-Manchado AB, Codeluppi S, Lonnerberg P, La Manno G,
Jureus A, et al. Brain structure. Cell types in the mouse cortex and hippocampus revealed by single-cell RNA-seq. Science. 2015;347:1138–42. 15. Xue Z, Huang K, Cai C, Cai L, Jiang CY, Feng Y, et al. Genetic programs in
human and mouse early embryos revealed by single-cell RNA sequencing. Nature. 2013;500:593–7.
16. Treutlein B, Brownfield DG, Wu AR, Neff NF, Mantalas GL, Espinoza FH, et al. Reconstructing lineage hierarchies of the distal lung epithelium using single-cell RNA-seq. Nature. 2014;509:371–5.
17. Shalek AK, Satija R, Shuga J, Trombetta JJ, Gennert D, Lu D, et al. Single-cell RNA-seq reveals dynamic paracrine control of cellular variation. Nature. 2014;510:363–9.
18. Picelli S, Faridani OR, Bjorklund AK, Winberg G, Sagasser S, Sandberg R. Full-length RNA-seq from single cells using Smart-seq2. Nat Protoc. 2014;9:171–81.
19. Guo H, Zhu P, Guo F, Li X, Wu X, Fan X, et al. Profiling DNA methylome landscapes of mammalian cells with single-cell reduced-representation bisulfite sequencing. Nat Protoc. 2015;10:645–59.
20. Hartung T, Zhang L, Kanwar R, Khrebtukova I, Reinhardt M, Wang C, et al. Diametrically opposite methylome-transcriptome relationships in high- and low-CpG promoter genes in postmitotic neural rat tissue. Epigenetics. 2012; 7:421–428.
21. Golzenleuchter M, Kanwar R, Zaibak M, Al Saiegh F, Hartung T, Klukas J, et al. Plasticity of DNA methylation in a nerve injury model of pain. Epigenetics. 2015;10:200–12.
22. Jjingo D, Conley AB, Yi SV, Lunyak VV, Jordan IK. On the presence and role of human gene-body DNA methylation. Oncotarget. 2012;3:462–74. 23. Karlic R, Chung HR, Lasserre J, Vlahovicek K, Vingron M. Histone modification
levels are predictive for gene expression. Proc Natl Acad Sci U S A. 2010;107:2926–31.
24. Barthelson RA, Lambert GM, Vanier C, Lynch RM, Galbraith DW. Comparison of the contributions of the nuclear and cytoplasmic compartments to global gene expression in human cells. BMC Genomics. 2007;8:340. 25. Grindberg RV, Yee-Greenbaum JL, McConnell MJ, Novotny M, O’Shaughnessy AL,
Lambert GM, et al. RNA-sequencing from single nuclei. Proc Natl Acad Sci U S A. 2013;110:19802–7.
26. Angermueller C, Clark SJ, Lee HJ, Macaulay IC, Teng MJ, Hu TX, et al. Parallel single-cell sequencing links transcriptional and epigenetic heterogeneity. Nat Methods. 2016;13:229–32.
27. Hou Y, Guo H, Cao C, Li X, Hu B, Zhu P, et al. Single-cell triple omics sequencing reveals genetic, epigenetic, and transcriptomic heterogeneity in hepatocellular carcinomas. Cell Res. 2016;26:304–19.
28. Lindsay RM. Nerve growth factors (NGF, BDNF) enhance axonal regeneration but are not required for survival of adult sensory neurons. J Neurosci. 1988;8:2394–405.
29. Han L, Zi X, Garmire LX, Wu Y, Weissman SM, Pan X, et al. Co-detection and sequencing of genes and transcripts from the same single cells facilitated by a microfluidics platform. Sci Rep. 2014;4:6485.
30. Dobin A, Davis CA, Schlesinger F, Drenkow J, Zaleski C, Jha S, et al. STAR: ultrafast universal RNA-seq aligner. Bioinformatics. 2013;29:15–21. 31. Anders S, Huber W. Differential expression analysis for sequence count data.
Genome Biol. 2010;11:R106.
32. Guo W, Fiziev P, Yan W, Cokus S, Sun X, Zhang MQ, et al. BS-Seeker2: a versatile aligning pipeline for bisulfite sequencing data. BMC Genomics. 2013;14:774.
• We accept pre-submission inquiries
• Our selector tool helps you to find the most relevant journal • We provide round the clock customer support
• Convenient online submission • Thorough peer review
• Inclusion in PubMed and all major indexing services • Maximum visibility for your research
Submit your manuscript at www.biomedcentral.com/submit