R E S E A R C H
Open Access
Comparative assessment of methods for
the computational inference of transcript
isoform abundance from RNA-seq data
Alexander Kanitz
†, Foivos Gypas
†, Andreas J. Gruber, Andreas R. Gruber, Georges Martin and Mihaela Zavolan
*Abstract
Background:Understanding the regulation of gene expression, including transcription start site usage, alternative splicing, and polyadenylation, requires accurate quantification of expression levels down to the level of individual transcript isoforms. To comparatively evaluate the accuracy of the many methods that have been proposed for estimating transcript isoform abundance from RNA sequencing data, we have used both synthetic data as well as an independent experimental method for quantifying the abundance of transcript ends at the genome-wide level. Results:We found that many tools have good accuracy and yield better estimates of gene-level expression compared to commonly used count-based approaches, but they vary widely in memory and runtime requirements. Nucleotide composition and intron/exon structure have comparatively little influence on the accuracy of expression estimates, which correlates most strongly with transcript/gene expression levels. To facilitate the reproduction and further extension of our study, we provide datasets, source code, and an online analysis tool on a companion website, where developers can upload expression estimates obtained with their own tool to compare them to those inferred by the methods assessed here.
Conclusions:As many methods for quantifying isoform abundance with comparable accuracy are available, a user’s choice will likely be determined by factors such as the memory and runtime requirements, as well as the availability of methods for downstream analyses. Sequencing-based methods to quantify the abundance of specific transcript regions could complement validation schemes based on synthetic data and quantitative PCR in future or ongoing assessments of RNA-seq analysis methods.
Background
The general availability of high-throughput sequencing technologies greatly facilitated the detection and quanti-fication of RNA species, including protein-coding RNAs, long non-coding RNAs, and microRNAs, in many differ-ent systems. In higher eukaryotes, the vast majority of protein-coding genes express multiple transcript iso-forms [1–3]. Although a substantial proportion of tran-script isoforms may result from stochasticity in the splicing process [4, 5], striking examples of isoform switching with large impact on cellular phenotypes are also known (for example, [6, 7]). Tissue-specific splicing patterns have been linked to the expression of specific
RNA-binding proteins [8], some of which appear to act as‘master’regulators of alternative splicing in individual tissues [9]. For example, muscleblind-like proteins 1 and 2 (MBNL1/MBNL2) are expressed in mesenchymal cells and their downregulation facilitates somatic cell repro-gramming [10], while the epithelial splicing regulatory proteins 1 and 2 (ESRP1/ESRP2) establish epithelia-specific patterns of isoform expression [11]. Neverthe-less, despite the long history of the field, the functional relevance of most isoforms that can be detected with se-quencing approaches remains unclear [12], particularly in light of the rapid change of isoform usage pattern in evolution that indicates relatively weak selection pres-sure [13].
Analysis of expression pattern is often one of the first steps towards understanding a gene’s function. However, transcript isoform abundance is almost always quantified
* Correspondence:[email protected] †Equal contributors
Biozentrum, University of Basel and Swiss Institute of Bioinformatics, Basel, Switzerland
indirectly; most of the sequencing technologies that are currently used yield reads that are short (≤200 nt) rela-tive to the length of eukaryotic transcripts (2.2 kb in mammals, on average) [14] and thus, a sequenced read can typically be assigned to more than one isoform. This is not the case with the technology developed by Pacific Biosciences that enables sequencing of full-length cDNAs [15]. A drawback of this technology is, however, that the throughput is relatively low, of the order of 104 transcripts, which does not allow accurate quantification of transcript abundance. Furthermore, the error rates are relatively high, making the transcript identification non-trivial. Thus, accurate and cost-effective quantification of the complete repertoire of full-length expressed tran-scripts, which are in the range of hundreds of thousands per cell [16], remains an open problem.
As RNA sequencing (RNA-seq) has become common-place in molecular biology laboratories, a variety of com-putational approaches has been proposed for isoform reconstruction from short read sequencing data (see, for example, [17]). Similarly, quite a number of methods has been developed for the inference of isoform abundance (reviewed in [18]). While short read alignment and tran-script reconstruction methods have been extensively benchmarked recently [17, 19, 20], only one study, ra-ther limited in scope, evaluated some isoform quantifica-tion methods [21]. Independently and comprehensively evaluating the accuracy of such computational methods is difficult, because experimental validation strategies by, for example, quantitative PCR are typically re-stricted to just a limited number of isoforms (see, for example, [22]). Developers therefore typically evaluate their tools on synthetically generated datasets which may not capture adequately the complexities of RNA-seq experiments.
In this study we carried out a systematic evaluation of a large number of methods for isoform quantification from RNA-seq data. We used not only synthetic, but also genome-wide experimental datasets. We took ad-vantage of newly developed protocols for quantifying the abundance of distinct RNA 3′ ends, which result from the use of alternative 3′end processing sites. These pro-tocols allow a comprehensive surveillance of 3′end pro-cessing site usage, with a method that is distinct from RNA-seq [23–25]. From two types of cells and from two species (human Jurkat T cells or mouse NIH/3T3 cells) we prepared two libraries, one with an RNA-seq proto-col and the other with a protoproto-col for capturing the 3′ ends of polyadenylated RNAs. We submitted the aligned RNA-seq reads to the entire panel of computational methods for estimation of transcript isoform abundance. We then compared these estimates with those that we obtained independently, through the analysis of the cor-responding 3′end sequencing data.
Our results indicate that many of the available methods have comparable accuracy, and that the abun-dance of highly expressed isoforms is more accurately inferred than the abundance of isoforms with low ex-pression levels. We further found that even the quantifi-cation of gene expression is more accurate when gene expression levels are computed by cumulating the levels of transcript isoforms than when ignoring the transcript structures. Given that many methods are available that differ little in accuracy, a user’s choice will likely be de-termined by factors such as the memory and runtime re-quirements, as well as the availability of methods for downstream analyses such as differential gene/transcript expression.
Results
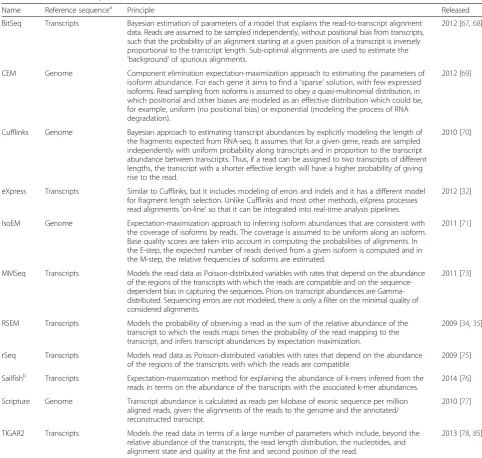
We initially performed an extensive literature survey to identify tools that were developed for inferring the abun-dance of transcript isoforms from RNA-seq data. Al-though we tried to include as many of these as possible, our study setup required that tools are able to quantify a set of transcripts that we provided as input, thereby sep-arating the problem of transcript reconstruction from that of abundance quantification. To be able to interpret the results, we further focused on methods that have been duly described in the literature. Lastly, we thought that ease of use would be critical for the adoption of the tool by the user community and we did not pursue methods which we were unable to implement within a reasonable amount of time. Table 1 lists the remaining 11 tools, together with their underlying principle, input requirements, and references. A description of how each of the tools was applied is provided in the Methods section.
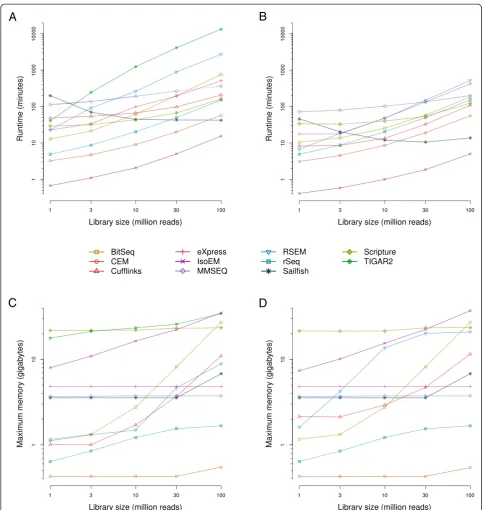
Runtime and memory requirements differ substantially between tools
is used (Fig. 1a), and two orders of magnitude when the multi-threading option (16 cores; Fig. 1b) is used. In par-ticular, the times required to process the alignments of 100 million in silico-generated reads range between ap-proximately 7 min (IsoEM) and more than 1 week (TIGAR2) when a single processor is used, and between about 5 min (IsoEM) and 8 h (RSEM) when 16 cores are available for the tools that support multi-threading (TIGAR2 does not). With the exception of Sailfish, run-times strictly increased with the number of processed read alignments. Assuming that a method-specific, but largely sample size-independent time span is required to index
[image:3.595.55.538.97.555.2]the supplied transcriptome, time complexities for most of the quantification algorithms appear to be approximately linear. Sailfish’s runtimes seem to be the highest for the smallest dataset, presumably because the convergence of estimation is slow for small datasets, when the vast major-ity of transcripts are sparsely covered. Notably, Sailfish computes abundances based on raw read sequences rather than alignments. Thus, whenever alignments are dispens-able, a considerable amount of time (typically 1 h or more) can be saved on sample pre-processing compared to all other methods (refer to [19, 27, 28] for an overview of ‘mapping’ times for some short-read aligners and
Table 1Overview of surveyed methods
Name Reference sequencea Principle Released
BitSeq Transcripts Bayesian estimation of parameters of a model that explains the read-to-transcript alignment data. Reads are assumed to be sampled independently, without positional bias from transcripts, such that the probability of an alignment starting at a given position of a transcript is inversely proportional to the transcript length. Sub-optimal alignments are used to estimate the
‘background’of spurious alignments.
2012 [67,68]
CEM Genome Component elimination expectation-maximization approach to estimating the parameters of isoform abundance. For each gene it aims to find a‘sparse’solution, with few expressed isoforms. Read sampling from isoforms is assumed to obey a quasi-multinomial distribution, in which positional and other biases are modeled as an effective distribution which could be, for example, uniform (no positional bias) or exponential (modeling the process of RNA degradation).
2012 [69]
Cufflinks Genome Bayesian approach to estimating transcript abundances by explicitly modeling the length of the fragments expected from RNA-seq. It assumes that for a given gene, reads are sampled independently with uniform probability along transcripts and in proportion to the transcript abundance between transcripts. Thus, if a read can be assigned to two transcripts of different lengths, the transcript with a shorter effective length will have a higher probability of giving rise to the read.
2010 [70]
eXpress Transcripts Similar to Cufflinks, but it includes modeling of errors and indels and it has a different model for fragment length selection. Unlike Cufflinks and most other methods, eXpress processes read alignments‘on-line’so that it can be integrated into real-time analysis pipelines.
2012 [32]
IsoEM Genome Expectation-maximization approach to inferring isoform abundances that are consistent with the coverage of isoforms by reads. The coverage is assumed to be uniform along an isoform. Base quality scores are taken into account in computing the probabilities of alignments. In the E-step, the expected number of reads derived from a given isoform is computed and in the M-step, the relative frequencies of isoforms are estimated.
2011 [71]
MMSeq Transcripts Models the read data as Poisson-distributed variables with rates that depend on the abundance of the regions of the transcripts with which the reads are compatible and on the sequence-dependent bias in capturing the sequences. Priors on transcript abundances are Gamma-distributed. Sequencing errors are not modeled, there is only a filter on the minimal quality of considered alignments.
2011 [73]
RSEM Transcripts Models the probability of observing a read as the sum of the relative abundance of the transcript to which the reads maps times the probability of the read mapping to the transcript, and infers transcript abundances by expectation maximization.
2009 [34,35]
rSeq Transcripts Models read data as Poisson-distributed variables with rates that depend on the abundance of the regions of the transcripts with which the reads are compatible.
2009 [75]
Sailfishb Transcripts Expectation-maximization method for explaining the abundance of k-mers inferred from the
reads in terms on the abundance of the transcripts with the associated k-mer abundances.
2014 [76]
Scripture Genome Transcript abundance is calculated as reads per kilobase of exonic sequence per million aligned reads, given the alignments of the reads to the genome and the annotated/ reconstructed transcript.
2010 [77]
TIGAR2 Transcripts Models the read data in terms of a large number of parameters which include, beyond the relative abundance of the transcripts, the read length distribution, the nucleotides, and alignment state and quality at the first and second position of the read.
2013 [78,85]
The columns are: method name, sequences to which reads are compared (transcripts or genome), principle of the method, year of release, and associated reference(s)
a
For methods operating on the genome sequence, genome annotation files (GTF/BED-formatted) were also provided
b
conditions). Enabling multithreading had only a limited impact on runtimes (Additional file 2: Figure S2A), with several of the tools hardly benefiting at all (maximum ratio between runtimes at 1 and 16 cores approximately two-fold or less for CEM, eXpress, MMSEQ, rSeq, and Scrip-ture). However, RSEM (approximately 5.9-fold speedup
for 30 million reads) and BitSeq (approximately 4.2-fold speedup for 100 million reads), two methods with the highest single-processor running times had the highest speedup when multiple processors were provided. Mem-ory footprints also spanned almost two orders of magni-tude between tools, both when using a single or multiple
A
B
C
D
[image:4.595.56.542.86.597.2]cores (Fig. 1c, d). For approximately half of the tools (CEM, eXpress, MMSEQ, Sailfish, Scripture, TIGAR2) the memory footprint seems to be largely independent of the sample size. For the remaining tools (BitSeq, Cufflinks, IsoEM, RSEM, rSeq) the memory footprint increases with the sample size. Although IsoEM seems to trade off a rela-tively large memory footprint (from <10 to >30 GB) for extremely short running times, we did not observe a gen-eral inverse correlation between the running time and memory usage of individual methods (rs= 0.13 and−0.13
at 100 million reads for 1 and 16 cores, respectively) (Additional file 2: Figure S2B, C).
Most methods infer transcript abundances with good accuracy even from sparse datasets
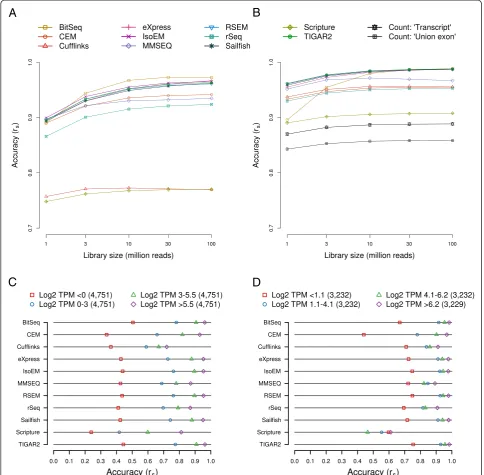
Our main objective was to evaluate the accuracy of iso-form expression estimates produced by various methods. Consistent with current expectations about the number of expressed transcripts in a given cell type, the read simulation software only assigned non-zero expression to approximately 10.2 % of all transcripts supplied to it as input (19,004 out of 187,176). To avoid the situation that our results are dominated by how different methods handle transcripts that are essentially not expressed, we initially restricted our initial analysis to the set of expressed transcripts. These were those for which the simulation software assumed non-zero expression values. When comparing the abundances of these transcripts as inferred by each method with the‘ground truth’(Fig. 2a and Additional file 3: Figure S3), we found that nine out of 11 programs exhibit very good performance (Spearman correlation coefficient rs>0.9 for≥107reads). As expected,
correlations generally improved with increasing library sizes, in a monotonic fashion and asymptotically towards saturation. For most methods, estimation accuracies reached a plateau at or around a read depth of 30 million reads, indicating that further increases in read depth are unlikely to significantly improve their results. In particular, Spearman correlation coefficients peaked at above 0.95 for six of the methods (BitSeq, eXpress, IsoEM, RSEM, Sail-fish, and TIGAR2) and above 0.9 for a further three methods (CEM, MMSEQ, rSeq). Both Cufflinks and Scrip-ture performed considerably worse than all other methods, with the corresponding correlation coefficients barely surpassing 0.75. The influence of the library size on accuracy varied somewhat between methods, with the total gain from the sparsest to the richest dataset ranging from approximately 0.01 (Cufflinks) to approximately 0.08 (BitSeq). Out of the nine most accurate methods, MMSEQ appears to be the least sensitive to the influ-ence of read depth (approximately 0.04 gain in accur-acy). In order to rule out that our chosen metric for measuring accuracy is prone to producing idiosyncratic results, we have compared it with both the Pearson
correlation coefficient and the root mean square error (Additional file 4: Figure S4A). The relative performance of the methods changed only little, indicating that the results were robust with respect to the metric that we chose. Thus, with few exceptions, all methods produce highly accurate transcripts isoform abundance estimates even at moderate read depths.
Explicit modeling of transcript isoforms leads to more accurate estimation of gene expression levels than count-based methods
qualitatively very similar to those that we obtained at the level of transcript expression (Fig. 2a and Additional file 3: Figure S3): estimates of gene expression levels that were produced by or derived from the output of most methods are quite accurate and the accuracy increases with sequen-cing depth towards saturation. Only BitSeq’s gene-level es-timates were strongly sensitive to the size of the input
library, in the range of approximately 0.90 for 1 million reads to approximately 0.99 for 30 million reads or more. The same six methods that yielded the most accurate transcript abundances (BitSeq, eXpress, IsoEM, RSEM, Sailfish, and TIGAR2) gave the most accurate gene level expression estimates: all achieved peak Spearman correl-ation coefficients of 0.98 or higher. CEM, Cufflinks,
A
B
C
D
Fig. 2Influence of sequencing depth and expression levels on the accuracy of expression estimates. Transcript isoform and gene expression levels were estimated with each of the indicated methods fromin silico-generated datasets of different‘sequencing’depths. The accuracy of a method was assessed in terms of the Spearman correlation coefficient (rs) between the estimates and the known input levels (‘ground truth’) of
[image:6.595.56.541.90.565.2]MMSEQ, and rSeq reached Spearman correlation coeffi-cients of at least 0.95. Scripture, when provided with more than 1 million reads, was also able to estimate gene ex-pression with good (rs >0.9) accuracy. In contrast, the
count-based methods only achieved moderate accuracy (maximum rs= 0.89 and rs= 0.86 for the‘union exon’and
‘transcript’methods). As suggested by the scatter plots in Additional file 5: Figure S5, the limited accuracy of either method is largely due to the underestimation of true expression and, as expected, this short-coming is more pronounced in the‘union exon’method. As with the tran-script estimates, choosing another metric has little impact on the overall ranking/presentation of results (Additional file 4: Figure S4B). Taken together, these results clearly demonstrate that although the accuracy of count-based methods may perhaps benefit from more elaborate proce-dures for addressing ambiguities in the assignment of reads to loci and transcripts, they still fall short of methods that probabilistically model the generation of RNA-seq data, taking into account transcript isoforms and the sampling of reads from transcripts.
High expression levels are more accurately estimated than low expression levels
Higher transcript coverage by reads is expected to in-crease the accuracy with which transcript abundance is estimated. The coverage depends on both the depth of sequencing as well as on the transcript abundance, and indeed we found that the size of the read library has a positive influence on the accuracy of expression estimates. To evaluate the extent to which ‘true’abundance influ-ences the accuracy of transcript abundance estimates, we grouped both expressed transcripts and genes by their ‘ground truth’expression into four equally sized bins: low (log2 TPM <0 or 1.1), medium-low (0 or 1.1 < log2 TPM <3 or 4.1), medium-high (3 or 4.1 < log2 TPM <5.5 or 6.2) and high abundance (log2 TPM >5.5 or 6.2), with the first and second numbers referring to the ranges for transcripts and genes, respectively. The overall ranking of tools in terms of their accuracy within expression level bins (Fig. 2c, d) largely reflects what we observed when evaluat-ing the performance on expressed transcripts or genes (Fig. 2a, b). However, the accuracy of transcript expression level estimates degrades progressively from high to low expressed transcripts, with the most drastic drop between the medium-low and low (less than one transcript in 1 million transcripts) abundance (correlation coefficients for the most accurate tools change from approximately 0.75 to approximately 0.4/0.5, at 30 million reads, Fig. 2c). Similarly, estimation accuracies on the gene level differ lit-tle across the three bins of most highly expressed genes (mean rs = approximately 0.92, 0.87, 0.85 for the ‘high’,
‘medium-high’, and ‘medium-low’ bins, respectively), but drop most strongly for the bin with the least expressed
genes (mean rs = approximately 0.68). Thus, our analysis
confirms the expectation that low abundance and, con-sequently, sparse transcript coverage leads to noisier estimates of expression. However, for genes whose ex-pression levels are in the top three quartiles, the esti-mates provided by the tools agree very well with the ‘true’expression levels.
transcripts and genes (Additional file 7: Figure S7A, B), are considerably lower than when only expressed fea-tures are considered (Fig. 2a, b). Given that most of the annotated transcripts were considered‘not expressed’in our synthetic dataset, the tools that trade off specificity for sensitivity (BitSeq, CEM, eXpress, MMSEQ) were most affected by the inclusion of not expressed tran-scripts. Taken together, these analyses indicate that the amount of starting material, the features of interest, and the obtained read depth are all among the factors that influence the accuracy of expression estimates and may play a role in the choice of the method that should ul-timately be used for data analysis. Nevertheless, moder-ate sequencing depth of a few tens of million reads seems to be sufficient for an accurate estimation of most except the very lowly expressed transcripts by many of the available methods.
The alignment program and bias correction options have little impact on the accuracy of abundance estimates Some of the surveyed methods strongly recommend the use of a specific short-read alignment program. By de-fault, RSEM even calls such an aligner (Bowtie) intern-ally. Thus, we asked whether the choice of alignment program impacts the accuracy of isoform abundance es-timates that are produced by these methods. Surpris-ingly, we found that the aligner has a relatively small impact on estimation accuracy, regardless of whether one considers transcripts or genes, and only expressed or all features (Additional file 8: Figure S8). If anything, with the exception of CEM, all methods performed bet-ter when supplied with read alignments prepared with our custom pipeline that employs the segemehl aligner than when alignments produced by either Bowtie1 (MMSEQ, RSEM) or TopHat2 (Cufflinks, Scripture) were provided. RSEM had the highest gain in accuracy, around rs = 0.05 or rs = 0.03 on the transcript- and
gene-level, respectively. On the other hand, CEM pro-duced slightly more accurate results when supplied with TopHat-aligned reads, particularly when considering all features (gain of rs = approximately 0.08).
Correspond-ence with CEM’s developers revealed that the program requires the TopHat-specific SAM/BAM tag ‘XA’, which encodes information about the strand of the transcript to which a read aligns, to correctly parse multi-fragment reads. Because this tag was not supplied in our input alignment files, CEM was unable to properly parse align-ments that covered splice junctions and therefore pro-duced less accurate estimates when supplied with our alignments.
A subset of the methods (CEM, eXpress, IsoEM, RSEM, and Sailfish) also attempt to correct various biases that occur during sample preparation, such as positional (non-uniform distribution of reads along
transcripts), sequencing (depending on the nucleotide composition of the reads), or mapping (sequencing er-rors and multi-mapping reads) biases (see Methods sec-tion for details). While in general we have restricted ourselves to executing each program with the default parameter settings, we wanted to explore whether bias correction had an impact on the abundance estimation (Additional file 9: Figure S9). Surprisingly, only the tran-script estimates produced by CEM and, to a lesser ex-tent, IsoEM were affected. For CEM, the largest difference was observed when considering expressed transcripts, for which bias correction (default: disabled) had a slight detrimental effect (rs loss = approximately
0.05). In contrast, the estimates produced by IsoEM seemed to slightly improve upon enabling the bias cor-rection, but only when all transcripts were considered (rsgain = approximately 0.02). In all other cases, no
ap-preciable differences were observed when executing programs with or without bias correction.
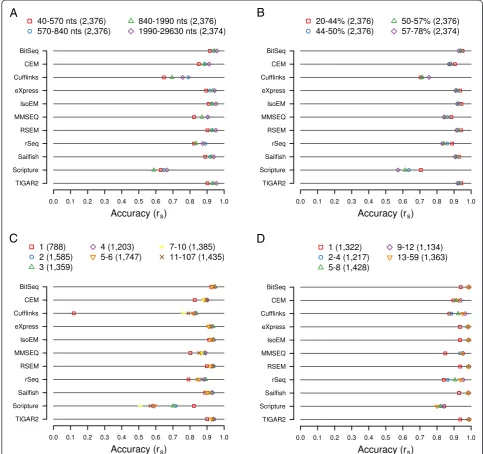
Gene/transcript structural features affect the estimates of individual methods
most accurate estimates for the longest transcripts. Nevertheless, differences in the correlation coefficients are moderate, in the range of approximately 0.04 (BitSeq) to approximately 0.14 (Cufflinks). Similarly, high GC content appears to have a slight, unfavorable influence on the accuracy of isoform abundance estimates, with all but CEM and Cufflinks producing the least and the most accurate estimates for transcripts with high, and
low GC content, respectively, and with the differences in the range of approximately 0.02 (BitSeq) and approxi-mately 0.13 (Scripture) (Fig. 3b). An intriguing phenomenon becomes apparent when analyzing tran-scripts according to the number of exons that they con-tain (Fig. 3c): single-exon transcripts are quantified with the least accuracy by all but two methods (Scripture and eXpress). The differences in accuracy relative to bin
A
B
C
D
Fig. 3Impact of gene structural features on expression estimates. All transcripts or genes expressed at medium levels (0 < log2 TPM <5.5) were distributed across bins according to transcript length (a), GC content (b), the number exons per transcript (c), and the number of transcripts per gene (d). Ranges of the corresponding values covered by each bin are indicated in the legends above each chart. In all cases, expression levels were estimated with each of the indicated methods based onin silico-generated sequencing data (read depth = 30 million). The accuracy of estimates was measured in terms of how well they correlate with true expression levels, expressed as the Spearman correlation coefficient rs, and
[image:9.595.55.539.90.544.2]with the second-lowest accurately are generally small (in the range of approximately−0.01 for BitSeq to ap-proximately−0.05 for CEM) and thus the effect may, at least in part, be explained by the previously described influence of transcript length. However, for Cufflinks this difference is very high (approximately −0.64). In-deed, Cufflinks fails to produce non-zero estimates for the vast majority of single-exon transcripts (Additional file 11: Figure S11A), but not for transcripts containing at least two exons (Additional file 11: Figure S11B, C). This is not due to an incompatibility between Cufflinks and our read processing/alignment procedure, because applying Cufflinks to TopHat2-generated alignments recapitulates the effect (Additional file 11: Figure S11D, E, F). Interestingly, Scripture exhibits the oppos-ite effect, producing the most accurate estimates for single-exon transcripts (difference to next-best bin ap-proximately 0.11). When excluding single-exon tran-scripts and apart from Scripture, the influence of exon number is marginal, with differences in accuracy across bins in the range of approximately 0.01 (BitSeq) to ap-proximately 0.05 (rSeq).
Similar to single-exon transcripts, genes with a single transcript isoform that generate just one transcript spe-cies are least accurately quantified by most methods ex-cept Scripture (Fig. 3d). This is to a large extent a consequence of the fact that single-isoform genes are in fact those giving rise to single-exon transcripts (621 of 1,322 genes, that is, approximately 47.0 %). Additionally, genes that have only a small number of associated tran-scripts also have low expression levels (Additional file 10: Figure S10D). Otherwise, the complexity of the locus appears to have little impact on the accuracy of isoform abundance estimation: maximum differences in accuracy between bins are in the range of approximately <0.01 (Sailfish) to approximately 0.09 (rSeq), with seven methods exhibiting differences below 0.01. Taken to-gether, our results indicate that, apart from a few method-specific exceptions, the influence of gene struc-tural features on the accuracy of estimates is small. Bit-Seq, CEM, eXpress, IsoEM, RSEM, Sailfish, and TIGAR2 produce the most robust estimates across the assessed features, with the standard deviations of accuracies across the bins analyzed for each feature being around or below 0.025 (Additional file 12: Figure S12). As an add-itional quantification of the impact of various structural features, Additional file 13 shows the P values of the Kolmogorov-Smirnov’s goodness of fit tests carried out for the log-ratio of estimated and expected levels for genes/transcripts in specific bins compared to the entire set of genes/transcripts with moderate expression level (0 < log2 TPM <5.5 and 1.1 < log2 TPM <6.2 for tran-scripts and genes, respectively; compare categories in Fig. 2c, d).
Isoform- and gene-level estimates are consistent across biological replicates
A basic test for any inference method is whether they produce similar results when supplied with similar data. For isoform quantification, reproducibility was generally tested on data that was generated synthetically. To in-vestigate this aspect, here we have also prepared RNA-seq libraries from two batches of cells of two cellular systems, the murine fibroblast cell line NIH/3T3 and the human T cell line Jurkat. We then supplied the tools for inferring transcript isoform abundances with the result-ing short reads (Sailfish) or alignments (all other tools). The replicate agreement, defined as the Spearman cor-relation coefficient rsbetween the estimated abundances
of (groups of ) transcripts in the two human or mouse replicates, was generally high. At the gene level, rs
ranged from approximately 0.82 for both human (Cuf-flinks) and mouse (MMSEQ) to approximately 0.91 (hu-man; BitSeq) and 0.90 (mouse; Sailfish). In contrast, at the transcript level, the agreement was much lower and varied considerably between tools, in the range of proximately 0.62 (TIGAR2) and 0.60 (MMSEQ) to ap-proximately 0.95 and 0.91 (both Scripture) for human and mouse (Fig. 4a and Additional file 14: Figure S13A, respectively). However, only the estimates produced by Scripture and BitSeq showed agreements substantially above rs= 0.7. Most methods produce estimates that are
indicative of stronger fluctuations on the transcript com-pared to the gene level (mean difference in replicate agreement approximately −0.14 and −0.15, for human and mouse), likely because a large proportion of iso-forms are expressed at low levels or not at all. In a few cases, differences between replicate agreement on the gene and transcript level exceed 0.2 in at least one spe-cies (MMSEQ, RSEM, rSeq, Sailfish, TIGAR2). On the other side of the spectrum, Scripture exhibits a slightly higher agreement between its transcript than its gene level estimates across both organisms (differences of ap-proximately 0.09 and 0.06 for human and mouse, re-spectively). These behaviors likely reflect differences in the models underlying different methods, particularly with regard to how they treat low abundance transcripts and how readily they assign reads to the minor and major isoforms of a given gene.
3′end sequencing provides independent estimates of isoform abundance
large-scale level, these methods are still cost- and resource-intensive. We therefore applied our A-seq-2 protocol [25] to prepare 3′ end sequencing libraries from the same RNA preparations that were used for RNA-seq and sought to use 3′ end sequencing-based abundance estimates as an independent experimental reference dataset for assessing the accuracy of expression esti-mates produced by the benchmarked methods.
To assess the quality of these data we first quantified and compared the usage of annotated 3′end processing sites that overlap the ends of GENCODE-annotated transcripts (see Methods) between biological replicates. We carried out this analysis both at the level of individ-ual 3′ end processing sites as well as at the gene level. For the latter, we aggregated the abundance estimates of all 3′ end processing sites associated with individual
A
B
C
D
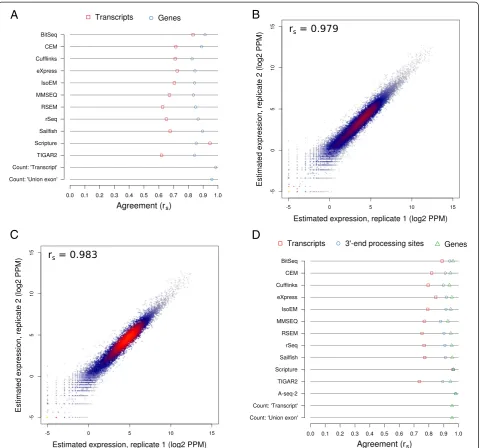
Fig. 4Agreement between expression estimates for replicates of Jurkat cells.aTranscript isoform and gene expression levels were estimated with each of the indicated methods from two biological replicates of human Jurkat cell RNA-seq data. The agreement between expression estimates of the two replicates are indicated as Spearman correlation coefficients rs, both at the level of transcripts and genes.bA-seq-2-based 3′
end processing site expression level estimates for the two replicates are plotted against each other. The Spearman correlation coefficient rsis
[image:11.595.59.540.88.536.2]genes. Figure 4b (human) and Additional file 14: Figure S13B (mouse) depict the Spearman correlation coeffi-cients between 3′end processing site abundances across biological replicates, whereas Fig. 4c (human) and S13C (mouse) show the same on the gene-level. In all cases, the agreement was very high (rs >0.97), suggesting that
gene expression and 3′ end processing site usage are highly similar in the replicates that we obtained from both human and mouse cells.
Because in constructing the catalog of 3′end process-ing sites from published data we applied strprocess-ingent valid-ation criteria, the set of ‘known’sites is probably biased towards those that are used in relatively abundant tran-scripts. We therefore wondered whether the agreement between biological replicates is higher when one focuses only on the GENCODE transcripts that end in a‘known’, annotated 3′end processing site and that are likely to be polyadenylated. This was the case for 46,801 human and 26,821 mouse transcripts (corresponding to 25,393 and 17,183 3′end processing sites, respectively; see Methods section). We selected these transcripts from the output of each method and computed again the correlation be-tween the estimated levels of transcripts, 3′end process-ing sites, and genes (the latter two by aggregation; see Methods section) in the two replicates. Figure 4d and Additional file 14: Figure S13D show the results for the human and the mouse datasets, respectively. As ex-pected, the correlation coefficients computed based on transcripts with annotated 3′end processing sites were, without exception, higher than those computed based on all GENCODE-annotated transcripts (Fig. 4a and Additional file 14: Figure S13A). On the transcript level, Spearman correlation coefficients ranged from mately 0.74 (TIGAR2) and 0.76 (MMSEQ) to approxi-mately 0.96 and 0.94 (Scripture) for human and mouse, respectively. For 3′ end processing sites and genes, Spearman correlation coefficients of at least 0.88 were reached by all methods for the human and mouse data-sets, respectively. The gene expression level estimates provided by the count-based methods also exhibited high agreement (>0.9 for both organisms).
Finally, we further filtered the set of considered tran-scripts by excluding those whose 3′ends were not cap-tured in our A-seq-2 dataset. However, in contrast to synthetic data, where the omission of absent transcripts led to a strong increase in estimation accuracy, this did not lead to a further improvement of the correlation be-tween replicate samples (Additional file 15: Figure S14A and B for human and mouse data, respectively). The reasons for this behavior are at the moment unclear. Nevertheless, this analysis indicates that estimates of isoform expression are more reproducible when anno-tated, and probably more highly expressed poly(A) sites are considered.
Having established that the RNA-seq data lead to highly reproducible estimates of isoform expression, we asked whether the computationally estimated expression levels within individual replicates agree with those that were measured experimentally with the A-seq-2 method. As before, we have aggregated the isoform abundance estimates for each 3′ end processing site and these, in turn, for each gene. Moreover, by selecting 3′end process-ing sites that overlapped the end of exactly one transcript, we were able to assess estimation accuracy on the level of individual transcripts. As shown in Fig. 5a (human) and 5B (mouse), the expression estimates produced by the sur-veyed methods are in strong agreement with those based on A-seq-2 across all samples from both human and mouse, with the Spearman correlations approaching those obtained on synthetic data. Agreement between transcript estimates ranges between approximately 0.67 (Cufflinks) and 0.81 (BitSeq) for the human, and approximately 0.71 (Cufflinks) and 0.84 (BitSeq) for the mouse data. When considering 3′end processing sites that overlapped with the ends of multiple transcripts, correlations further im-prove, with Spearman correlation coefficients for human and mouse data now in the range of approximately 0.77 (Cufflinks) to 0.86 (BitSeq), and approximately 0.85 (BitSeq) to 0.74 (Cufflinks) respectively. For reference, the corresponding scatter plots for the first replicates of each dataset are presented in Additional file 16: Figure S15 (human) and Additional file 17: Figure S16 (mouse). Fi-nally, aggregation of 3′ end processing site estimates per gene led to a further increase in agreement by approxi-mately 0.04 to approxiapproxi-mately 0.08 in both organisms. Assuming the A-seq-2-based estimates of expression as ‘ground truth’, Scripture (rs = approximately 0.92) and
RSEM (rs= approximately 0.88) delivered the most
ac-curate estimates at the gene level for human and mouse data, respectively. Importantly, we found that even when estimating gene-level abundance from bio-logical data, isoform-aware methods yield more accurate results than the broadly used count-based methods. Across all methods, level of coarse-graining, and organ-isms, the second replicate yields estimates that are slightly more accurate, likely reflecting a batch effect pertaining to the preparation of RNA-seq and A-seq-2 sequencing li-braries. On all levels, differences in accuracy between most methods are rather small, similar to what we ob-served on synthetic data. Also similarly, enabling or disab-ling bias correction in those methods that provide such an option also did not substantially alter the accuracy of esti-mates on experimental datasets (Additional file 18: Figure S17) and in the case of CEM, we have observed a consist-ent detrimconsist-ental effect of bias correction across transcripts, 3′end sides, and genes, and in both organisms.
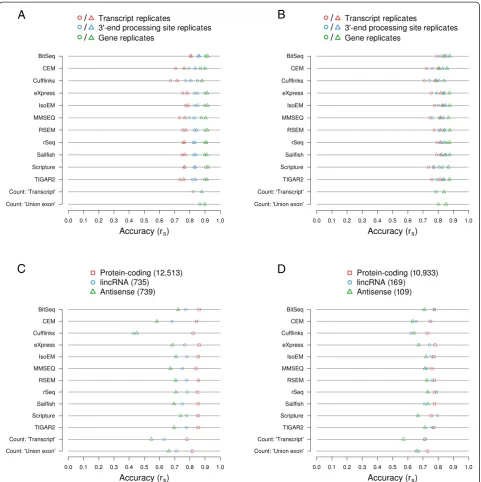
surveyed methods can quantify the expression of differ-ent classes of genes. Therefore, we computed the agree-ments of expression estimates with those inferred with A-seq-2 on genes annotated as‘protein coding’,‘lincRNA’
(long intergenic non-coding RNAs), and ‘antisense’ in both human and mouse. For human, the 12,513 protein coding genes amenable to quantification by A-seq-2 are considerably more accurately quantified than lincRNA
A
B
C
D
Fig. 5Agreement between the expression level estimated computationally from RNA-seq data and those measured with an independent experimental method.aandbAbundances of 3′end processing sites in two independent samples (circles: replicate 1, triangles: replicate 2) of human Jurkat (a) or murine NIH/3T3 cells (b) were quantified with A-seq-2. Based on RNA-seq data obtained the same cell cultures, the abundances of transcripts ending at these processing sites were estimated with each of the indicated methods and aggregated per processing site. 3′end processing site estimates were further aggregated per gene. The agreement between A-seq-2- and RNA-seq-based expression estimates was computed as Spearman correlation coefficients (rs) for 3′end processing sites, genes, and transcripts (when processing sites were associated with exactly one transcript). Refer to the main
[image:13.595.58.540.88.571.2](739) and antisense genes (739), with Spearman correl-ation coefficients reaching values of up to approximately >0.85, 0.8, and 0.7, respectively, for the different gene classes (Fig. 5c). The absolute difference in estimate ac-curacy across these classes is particularly striking for Cufflinks, where the Spearman correlation coefficients are reduced by almost 0.4 when trying to estimate lincRNA or antisense RNAs rather than protein coding genes. This may reflect the issue that Cufflinks seem to have with quantification of single-exon transcripts. Given the differences in median A-seq-2-based expres-sion levels across each gene class (log2 PPM = appro-ximately 3.73, −0.63, and −0.49 for protein coding, lincRNA, and antisense genes and considering both rep-licates), it is likely that the observed differences in esti-mation accuracy are, at least in part, a function of the true expression levels of these genes. Although the gen-eral trend is the same across the mouse samples, the dif-ferences in estimation accuracies between the different gene types are not as pronounced as in human, and for some methods the quantification of lincRNA genes is ac-tually more (rSeq, Scripture) or approximately equally accurate (BitSeq, TIGAR2) as that of protein coding genes (Fig. 5d). This may reflect the true abundance of these genes because A-seq-2 estimates of the median ex-pression of lincRNA and antisense gene classes were somewhat higher for mouse (log2 PPM = approximately 0.00 and 0.10, respectively) while those for protein cod-ing genes were about the same (median log2 PPM = approximately 3.67). Taken together, the estimates of isoform expression based on biological data and evalu-ated against expression measurements obtained with an independent experimental method validate and recapitu-late the most important conclusions derived from the synthetic data: many of the surveyed methods are able to estimate isoform abundances with good accuracy, par-ticularly when true expression levels are high. Further-more, employing any of these tools improves the accuracy of gene expression level estimates relative to widely used count-based methods.
Discussion
Accurate quantification of gene expression is essential for the understanding of gene regulatory processes in health and disease. Due to its large dynamic range, high reproducibility, and the ability to detect previously un-known transcripts, RNA sequencing has become the method of choice for global expression profiling. How-ever, despite the digital nature of the resulting data, technical limitations (limited read length and non-uniform transcript coverage) render their analysis chal-lenging, especially when large and complex genomes of higher eukaryotes, with frequent repeats and overlapping gene structures, are involved. Accurate computational
methods for RNA-seq data analysis therefore remain in high demand. This is reflected in the large number of computational methods for estimating transcript isoform abundance that were developed over the course of the last 6 years. Naturally, the question arises which method should best be used in a particular context. Here we have tried to address this question in depth, using not only synthetic data, as is typically done when the compu-tational methods are developed, but also using estimates that were obtained with an independent experimental method for a specific type of isoforms, namely those that arise from alternative polyadenylation. This is because methods for global quantification of 3′end site usage dis-tinct from RNA-seq are available [25, 29–31] and have been used quite extensively to analyze changes of 3′UTR isoforms across conditions. A drawback of these methods is that they cannot distinguish between transcripts that are processed at the same poly(A) site. However, although most mammalian genes have multiple poly(A) sites, cur-rently, over 60 % of the poly(A) sites whose expression we have been able to measure with A-seq-2 have only one associated transcript annotated in the human or mouse GENCODE datasets. Thus, we believe that A-seq (or another method for quantifying the usage of 3′end processing sites) can offer a good alternative to qPCR as a comprehensive approach to transcript isoform quanti-fication. Nevertheless, as the 3′end sequencing proto-cols are relatively new, it is likely that the computational analysis of these data can be further improved.
Expecting that most users would – at least initially – run the methods‘out-of-the-box’, we sought to apply the surveyed methods with default settings, and departed from this general rule only to test the influence of spe-cific options that the developers of the methods pro-posed. Although we found that neither the use of recommended short read aligners nor the activation of bias correction generally improved estimation accuracy, it is likely that the developers of the individual methods or experienced users would be able to improve the per-formance of individual tools in specific settings. During the course of this study we discovered a number of as-sumptions that the programs tacitly made and that af-fected the interpretation of the results. Therefore, a specific recommendation that we can make to devel-opers is to ensure that sufficiently detailed information on input requirements, potential pitfalls and the implica-tion of specific opimplica-tions (ideally including usage exam-ples) is provided.
isoforms but that have also been co-opted for estimating isoform abundance, perform poorer than methods specif-ically designed for the latter purpose. However, such methods could be part of the initial assembly of a com-prehensive set of transcripts whose expression can be subsequently quantified with a different approach [17]. Cufflinks is part of the popular ‘Tuxedo Suite’pipeline (Bowtie-TopHat-Cufflinks) and for the purpose of infer-ring isoform abundances from RNA-seq data is prob-ably superseded by the eXpress method developed by the same group [32]. Importantly, the gene level expres-sion estimates obtained by cumulating the abundances of transcript isoforms inferred with almost any of the surveyed methods are more accurate than those pro-duced by‘count-based’methods that are widely used in the analysis of gene expression. This is likely because count-based methods either disregard or mis-assign reads whose origin (genomic locus or isoform) cannot be unambiguously determined. We therefore strongly advise to use methods for transcript isoform quantifica-tion (such as those benchmarked here) even when only quantification at the gene level is desired.
Next to a general assessment of the accuracy of ex-pression estimates produced by the tools, we also stud-ied the impact of several transcript properties on the accuracy of expression estimation. We found that pa-rameters that directly influence the coverage of a tran-script or gene by reads, such as sequencing depth and true expression level, have a positive influence on esti-mation accuracy, as has been observed before [33]. On synthetic data, disregarding features that are not expressed led to a strong increase in the accuracy of ex-pression estimates, particularly on the level of isoforms. Thus, as may be expected, estimates of low-abundance isoform expression are not very reliable. How isoforms that are expressed at very low levels (or not at all) are treated in practice, varies between methods. Most methods report (or imply) cases of ‘zero’expression and some allow the user to specify a minimum level of ex-pression for reported transcripts. On the other hand, Bit-Seq and MMSEQ do not enforce such a threshold and instead attempt to assign non-zero priors even to tran-scripts that are not supported by any read, based on fac-tors such as the library size and transcript length. These solutions represent lower and upper bounds on the ex-pression of low-abundance transcripts (in contrast to higher-abundance transcripts, for which precise estimates of expression are sought). In typical RNA-seq experi-ments, where many transcripts are expected to be expressed, how precisely absent transcripts are treated may not be essential. However, in the case of, for example, single cell sequencing, the proportion of annotated tran-scripts that are not detected can be quite large and one should be aware that the meaning of the expression values
that the programs report are not entirely the same for expressed and not expressed transcripts. Next to coverage-related factors, we found that the length and GC content of transcripts as well as the complexity of the gene locus (exons per transcript and transcripts per gene) have a small impact on the accuracy of inferred expression levels, which is probably of more interest to the developers rather than to the average user.
To ensure the widest applicability of our findings, we have based our study on single-end, short read (50 nt) data. Illumina’s paired-end sequencing technology, which has been employed in previous comparisons of isoform abundance estimation methods [21, 33], provides add-itional information that may be used by many of the evaluated methods to improve the assignment of read fragments to the correct isoform and thereby the accur-acy of abundance estimates. As has been previously demonstrated [33–35], increasing the read length should also enhance the accuracy of abundance estimates, be-cause it leads to a reduction in the fraction of reads that cannot be unambiguously assigned to the correct iso-form. Indeed, increasing the read length is a current trend in the field of next generation sequencing. For ex-ample, Pacific Biosystems technology now allows full-length transcript sequencing [15], although at limited throughput.
While most methods produce comparable and fairly accurate estimates of transcript isoform abundance, they differ more strongly in their computing needs. In some cases, speed comes at the cost of increased memory re-quirements, which is evident for example with IsoEM, which is extremely fast, but uses tens of GB of memory. Nonetheless, with the increase in the number and size of the datasets that one typically analyzes, speed and scal-ability of processing become very important consi-derations for the utility of a program. The recently developed Sailfish is of particular interest in this regard because its running times scale well within the tested range of sequencing depths, while the memory footprint remains reasonable. Moreover, its alignment-free k-mer-based approach disposes of the time-consuming step of aligning reads to a reference genome or transcriptome. For typical datasets of approximately 100 million reads, most programs use 1–20 GB of memory and run for 1–2 h. An exception is TIGAR2, which produces highly accurate expression estimates that come at the cost of both high running times and high memory use.
used in subsequent statistical tests for differential ex-pression, but the issue of the underlying model has not been entirely addressed. If sufficient replicates are avail-able, two-sample parametric or non-parametric tests can be used. However, due to the high costs of RNA-seq experiments, the availability of more than a few cates is very rare. Instead, when the number of repli-cates is small, accurately accounting for the different sources of variability in the data is important. Differen-tial expression analysis based on RNA-seq data is fre-quently done with programs such as baySeq [36], DEGSeq [37], DESeq [38], or edgeR [39] (reviewed in [40]). These programs work on (integer) count data and use specific models for the number of reads that are ex-pected from individual‘features’such as exons or genes. Therefore, they are not appropriate for the estimate of transcript abundances that are obtained with the pro-grams that we analyzed here. Fortunately, some of the evaluated programs have additional modules for differ-ential expression analysis. BitSeq has a built-in function-ality for differential expression analysis based on the transcript expression levels estimated by the tool. The developers of Cufflinks and eXpress suggest Cuffdiff [41] for gene and transcript differential expression based on their respective outputs. The developers of IsoEM suggest the bootstrapping-based IsoDE [42] for differential expression analysis, but this tool is restricted to comparisons at the gene-level only. MMSEQ’s devel-opers suggest MMDIFF [43] which performs model comparisons and takes as input the posterior summaries from the MMSEQ tables. Alternatively, they provide in-structions to feed MMSEQ-estimated counts to count-based differential expression analysis tools like DESeq or edgeR [44]. eXpress and Sailfish developers also sug-gest to feed the supplied (rounded) ‘effective counts’, and‘expected number of reads’, respectively, into one of the count-based differential analysis tools mentioned above. Finally, RSEM developers suggest EBSeq [45], a Bayesian differential expression analysis method for genes and isoforms across two or more biological condi-tions. EBSeq is integrated into the RSEM suite [46].
Conclusions
In summary, several methods for the inference of tran-script isoform abundance can accurately quantify expressed transcripts even from relatively small short-read libraries and should thus be adequate for the ana-lysis of both past and present RNA-seq datasets. Their performance is largely not affected by structural features (number of exons, transcript length, GC content) of the genes/transcripts, although, as expected, abundant tran-scripts are quantified more accurately compared to rare transcripts. Importantly, our analysis indicates that the ex-plicit quantification of transcript isoforms leads to more
accurate estimates of gene expression levels compared to the‘count-based’methods that are broadly used currently. Given the wealth of tools available, the user can largely base his choice of method on criteria related to usability, available processing and memory capacities, compatibility with pre-existing data processing pipelines, and the de-sired downstream analyses (see Table 2). Especially prom-ising is the most recently proposed approach that relies on k-mer frequencies, bypassing entirely the read-to-genome/ transcriptome alignment and thereby enabling analysis of very large collections of samples, such as those that have started to emerge from patient studies. Developers may profit from our study setup, particularly our efforts to pro-vide compatible datasets to tools with quite different requirements as well as our approach at validating estima-tion accuracies of a particular type of isoform with an in-dependent large-scale experimental method. We propose that methods such as 3′end sequencing and cap analysis of gene expression (CAGE; [47]), which allow quantifi-cation of alternative polyadenylation and transcription start sites, respectively, could complement validation schemes based on synthetic data and quantitative PCR in future or ongoing assessments of RNA-seq analysis methods, such as, for example, by the MAQC-III/RNA-C consortium [48].
Methods
Genomes, gene annotations, and transcriptome sequences
The hg19 (human) and mm10 (mouse) genome assem-blies were obtained from UCSC Genome Bioinformatics, University of California, Santa Cruz [49]. Haplotype chromosome versions were discarded. Releases 19 and M2 of the GENCODE gene annotation sets GENCODE [50] were used for the analysis of human and mouse data, respectively. Version numbers were stripped from gene and transcript identifiers. In the human annotation set, all features on the Y chromosome that are present, in identical form, on the X chromosome have gene iden-tifiers of the form ‘ENSGRx’ (with x being a 10-digit number), and the corresponding features on the X chro-mosomes have identifiers of the form‘ENSG0x’. We dis-carded the former to avoid essentially duplicate features. Sequences of annotated transcripts (‘transcriptomes’) were obtained from ENSEMBL (release 74, compatible with GENCODE v19 and vM2) [51]. Genome and tran-scriptome sequences in FASTA format were indexed withsegemehl[52].
Generation of synthetic sequencing data
removed from the annotation set, all entries whose gene or transcript type attributes matched either‘miRNA’,‘ mis-c_RNA’,‘rRNA’,‘snoRNA’,‘snRNA’,‘Mt_rRNA’, or‘Mt_tRNA’. Taking into account the annotated transcripts introduced above as well as a target number of transcript molecules (we chose 5 million), Flux Simulator randomly assigns expression ranks to transcripts according to Zipf’s Law. The software then attempts to model the various steps in a typical RNA-seq library preparation proto-col, including fragmentation, reverse transcription, and PCR amplification, to generate reads. We ran Flux Simulator with the options --express, --library, and --sequence. Additional parameters were supplied in a parameter file (Additional file 19) as outlined in the Flux Simulator manual [53]. Flux Simulator does not na-tively support generation of directional single-end read li-braries. To obtain these, we instead generated a pool of 692,414,670 paired-end reads from which we then dis-carded all antisense mate sequences, as suggested by the Flux Simulator developers. To facilitate downstream pro-cessing, the identifiers of the remaining reads were simpli-fied and their sequences capitalized. Identical read sequences were collapsed with the fastx_collapser [54]. Finally, poly(A)tails introduced in the simulation -were removed with thecutadaptsoftware [55] by speci-fying a stretch of 50 adenines as the 3′ adapter and the non-default options --overlap=1 and --minimum-length=15. This resulted in a set of 298,435,172
poly(A)-free, directional, single-end reads. From this initial set, we randomly selected, progressively, approximately 100 (100,001,950), 30 (30,004,152), 10 (10,000,760), 3 (2,998,971), and 1 (999,436) million reads to analyze the scaling behavior of the programs.
Preparation of sequencing libraries
Human Jurkat T lymphocytes (ATCC TIB-152) [56] and NIH/3T3 mouse embryonic fibroblasts (ATCC CRL-1658) [57] were cultured in RPMI medium (Sigma) at 37°C and 5 % CO2. Cells were collected at approximately 70 % con-fluency after trypsinization. 3′ end libraries were gener-ated by the A-seq-2 protocol, which captures sequences immediately upstream of mRNA 3′end processing sites and poly(A)-tails [58], and directional RNA-seq libraries were prepared according to the Illumina-provided proto-col. For both protocols, poly(A)-positive RNA was isolated from the cells with the ‘Dynabeads mRNA DIRECT Kit’ (Ambion) and fragmented by alkaline hydrolysis to frag-ment sizes of 150–300 nt. Following reverse transcription and PCR amplification, the libraries were sequenced single-end with a read length of 51 nucleotides on an Illu-mina HiSeq-2000 platform.
[image:17.595.56.541.100.275.2]Pre-processing of human and mouse RNA-seq data Potential 3′ adapter and poly(A)-tail fragments were sequentially removed from FASTQ-formatted short reads sequences with two iterations ofcutadapt[55],
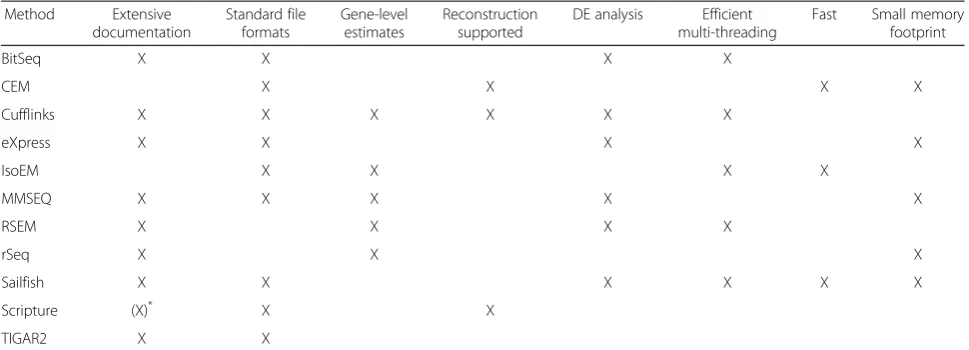
Table 2Features and performance summary of the surveyed methods
Method Extensive documentation
Standard file formats
Gene-level estimates
Reconstruction supported
DE analysis Efficient multi-threading
Fast Small memory footprint
BitSeq X X X X
CEM X X X X
Cufflinks X X X X X X
eXpress X X X X
IsoEM X X X X
MMSEQ X X X X X
RSEM X X X X
rSeq X X X
Sailfish X X X X X X
Scripture (X)* X X
TIGAR2 X X
To facilitate a user’s choice of method, we indicate which methods meet various criteria of usability, functionality, and performance, as follows:‘Extensive documentation’- documentation that goes beyond the description of parameters is provided (document, web page, FAQ which allowed us to run a given method confidently and without help from developers);‘Standard file formats’- the method exclusively operates on the indicated file formats for transcript sequences (FASTA), gene/transcript annotations (GFF/GTF or BED12), read sequences (FASTA or FASTQ), and read alignments (SAM/BAM as defined in [65] and produced by most modern aligners);‘Gene-level estimates’- estimates of expression on the gene level are provided in addition to those at transcript level;
specifying the 3′ adapter sequence and a stretch of 50 adenines, respectively, to the --adapteroption. Other non-default options were --overlap=1 and --mini-mum-length=15. Identical sequences were collapsed with thefastx_collapser[54].
Alignment of synthetic and experimentally obtained reads to genomes and transcriptomes
The experimentally obtained sequence sets, as well as the fivein silico-generated read subsets (FASTA-format-ted), were aligned to the genome and transcriptome of the respective species with segemehl 0.1.7 [52], with default parameters (minimum percentage of matches: 90 %) and without using the spliced alignment option. Anti-sense alignments to transcripts were discarded from further analysis. For the surveyed methods that re-quire input alignments in‘genome space’, transcriptome alignments were converted to genomic coordinates with custom scripts based on the gene models provided in the GENCODE v19 annotation file. Directly and indir-ectly obtained genome alignments in SAM format were merged, duplicate alignments resulting from the conver-sion between transcript and genome coordinates were discarded, and the remaining alignments were filtered such that for each read only the alignments with the smallest edit distance were kept. For methods requiring input alignments in ‘transcriptome space’, the transcrip-tome alignments of each reads that had an edit distance larger than the minimum distance obtained in aligning the read to the genome were discarded.
During the course of the study, we have noticed that the transcript isoform quantification methods that we evaluated make certain assumptions about the format of the input alignment files and that in some cases these assumptions only hold for certain short read aligners or for outdated file formats. We therefore implemented additional post-processing steps to ensure that the infor-mation required by individual programs is present in the alignment file is the appropriate form. (1) We ‘ uncol-lapsed’ the reads: across all alignment files, alignments corresponding to collapsed reads were ‘cloned’, but a randomized QNAME name was assigned to each indi-vidual read that was only re-used for additional align-ments of the same read. (2) To avoid misinterpretation of tag fields, all custom segemehl tags were removed. (3) Reads aligning to more than one reference locus are reported by segemehl as individual alignment records with identical read names (QNAME field). In accordance with the SAM specifications [59], we have further added a linked-list encoding for such reads. Specifically, we have designated the first out of such a group of align-ments as the primary (0x100 bit of the FLAG field un-set) and introduced CC and CP tags, pointing, respectively, to the reference sequence name and the
starting position of the following alignment. All remaining alignments were designated secondary (0x100 bit set), and CC and CP tags were added to all align-ments but the last in the list. Moreover, the HI (0-based ‘hit index’) tag was added to all alignments of ‘ multi-mapping’ reads. The NH (‘number of hits’) tag was re-computed for all reads in a given alignment file. (4) segemehl reports a default mapping quality (MAPQ) of 255 for each alignment record. Following the example of TopHat2 [60], we have reset the mapping quality values based on the number of alignments reported for a given read. Specifically, we have assigned mapping qual-ities of 50 (NH = 1), 3 (NH = 2), 1 (NH = 3 or 4), and 0 (NH = 5 or more). (5) We introduced sequencing quality strings (QUAL field). For in silico-generated reads, which did not have such scores associated, strings of ‘I’ characters that match the length of the read sequence (SEQ field) were used to denote maximum quality scores (according to the Sanger FASTQ format). In the case of the experimental RNA-seq libraries, we used the quality scores that were provided in the initial FASTQ files that were obtained from the sequencing facility. The data processing was automated with the help of the Anduril [61] data analysis framework. To test the influence of the alignment program, we have also generated align-ments of in silico generated reads with Bowtie (version 1.0.0) [62] and TopHat2 (version 2.0.10) [60]. The out-put of these programs were used without further processing.
Analysis of 3′end sequencing data
formation appears to occur with a certain degree of mi-croheterogeneity, that is, prominent 3′ end sites are usually being flanked by less frequently used 3′ end sites. Because these latter sites may not reflect func-tional biological variation, closely spaced 3′ end sites are typically clustered into 3′ end processing regions [25]. Many 3′ end sequencing protocols capture se-quences that result from priming at internal adenosine stretches rather than poly(A)-tails at the step of cDNA synthesis. To exclude a protocol-specific bias in 3′end quantification, we only analyzed 3′end processing sites that are supported by at least two independent 3′ end sequencing protocols. These are annotated in our in-house polyAsite database (manuscript in preparation) [64]. For each 3′end processing region, we determined the number of overlapping A-seq-2-inferred 3′ end reads, which we used as a measure of the expression of the corresponding 3′end processing region. In total, we quantified the expression of 90,128 and 61,457 3′ end processing regions in human and mouse, respectively.
Estimation of transcript isoform abundance
With the exception of Sailfish (see below), all of the programs compared in this study use alignments of reads to either the transcriptome or the genome. We used the samtools [65] suite to sort or interconvert the SAM/BAM alignment files obtained from mapping reads to genomes/transcriptomes. To detect and quan-tify‘multi-mapping’reads, several methods require that the alignment files are ordered such that the align-ments of a given read occur one after the other. Add-itionally, some methods further require that reads that are similar in sequence (and their associated align-ments) are randomly distributed in the input file. This is of clear relevance for eXpress, which processes align-ments‘on-line’and trains its parameters from the data. In such cases, ‘non-random’ occurrence of the read alignments may lead to biased parameters and output. Typically, both of these conditions (reads occur in ran-dom order while all alignments of a given read are grouped together) are met when alignments are sorted by the names of the reads, which is recommended in the documentation of these methods. But if the pre-processing pipeline includes sorting and renaming steps (for example, collapsing and uncollapsing of reads with identical sequences), sorting the alignment file by read names may lead to a situation in which neither condition is fulfilled. Unfortunately, the precise as-sumptions about the order in which read alignments should appear in the input file are not typically men-tioned in detail in the documentation of the programs. We thus recommend that users ensure that the order in which reads appear in the alignment file that is used as input to an isoform quantification method is
‘randomized’ whenever the quantification method rec-ommends sorting alignments by read name.
Scripture and CEM require annotation files in a BED-based format which supports multiple fragments (that is, exons) per entry and is known as BED12 or BED12+3. These were generated from the GENCODE-provided GTF annotation files with the help of the R/Bioconductor pack-agertracklayer[66]. Because some methods required the mean and standard deviation of the fragment/read length distribution, we calculated these from the align-ment files with a custom script. In the following, the steps taken to execute each surveyed program are outlined.
BitSeq [67, 68] uses as input transcript sequences in FASTA format and alignments of reads to the transcrip-tome in SAM or BAM format, sorted by read name (randomized). We have used the command-line version of BitSeq (version 0.7.5), but an R/Bioconductor version is also available.
The first step in BitSeq is to parse the alignment file to calculate probabilities of individual reads originating from individual transcripts:
parseAlignment \
<alignments_transcriptome> --trSeqFile \ <sequences.fa> --outFile \
<out_prefix.prob> --trInfoFile \ <out_prefix.trx> --uniform \
Then the mean transcript expression is estimated with a Variational Bayes inference algorithm:
estimateVBExpression <out_prefix.prob> \ --outPrefix <out_prefix> \
--outType RPKM–trInfoFile \
<out_prefix.trx> --samples 1000 --seed 1 \
By default, when no read alignments are assigned to a given transcript, BitSeq sets the expression estimate of the transcript to a ‘prior’ that depends on the effective transcript length and the sequencing depth. When indi-cated and in communication with the developers, we have identified these cases by finding transcripts for which the expected read count (alpha parameter of the Dirichlet distribution) equals exactly 1 and replaced their RPKM estimates with zeros.
CEM [69] takes as input a BED12 file of transcripts and a SAM or BAM file of genomic alignments, sorted by genomic coordinates. We ran CEM (processsam version 2.5.2) as follows:
python runcem.py --annotation \ <annotations.bed12> --forceref \ --prefix <out_prefix> \