Portfolio Optimization Problem by Means of Artificial
Bee Colony Algorithm, Considering various Criteria
Reza Raei
Associate professor of Tehran University
Finance department Tehran, Iran
Mohammad Bahrani
Jahromi
Master of finance Finance department
Tehran, Iran
Sahar Kamalzadeh
Master of finance Finance department
Tehran, Iran
ABSTRACT
Market complexity, especially wide range of investing tools and several factors that affect them, makes it hard to make decision on selecting asset kind of investment, and it causes investors face with the problem of optimizing assets in their decisions all time. Optimization problem and determining the efficiency bounder can be solved by mathematical solutions when the total numbers of assets and existent restraints in market are low. But when real world and its conditions are considered the problems cannot be easily solved by math. This paper introduces an innovative method for solving share optimization problem based on different factors of risk and by using artificial colony of honeybee algorithm, and then compares its results with them of genetic algorithm. For this purpose information of four risk factors are collected based on models of Mean-variance Markowitz, semi variance, Mean absolute deviation and mean-variance by considering skewness. In this paper, it is shown that artificial colony of honeybee algorithm can solve all the optimizing models of portfolio by considering factors of Mean-variance, semi variance, Mean absolute deviation and variance-skewness. For showing efficiency of this algorithm, its effectiveness is studied in financial market of Tehran, Tehran Stock Exchange (TSE).
General Terms
Artificial Bee Colony Algorithm
Keywords
Portfolio Optimization, Risk Factors, Artificial Bee Colony Algorithm.
1.
INTRODUCTION
In portfolio optimization, the main problem is optimal selection of assets and stocks that can be bought by a certain amount of capital [1]. Expected risk and returns are most parameters in portfolio optimization [2]. Investment searches for higher returns and lower risk. Most investors prefer certainty rather than uncertainty, so they need just a range of returns for minoring their investments risk. This certainty can be gained by diversifying and making portfolio. Portfolio is a set that contains several shares that surely has its own risk and returns. Although minimizing risk and maximizing returns seem to be simple, but actually several methods are used for making optimal portfolio. Investors want to increase their investments returns in a determined risk or for a determined return; they want to decrease their investments risk.
Many paradigms are introduced for solving setting optimal assets so far that every of them are by kinds of conditions and restraints, although these paradigms are solved by mathematical planning theoretically, but practically there are several problems in this regard. For instance, risk factors nature is obstacle of issuing a general solution of nonlinear problems and also, general solutions are not useful because of non-convex shape of objective function. Furthermore, selecting set of assets in real world contains hundreds of assets that their own risk and returns are calculated by means of time series. So, considering huge amount of data in these kinds of problems, common software products cannot solve mathematical¬ planning problems. Investment managers found restraints on setting optimal assets that this fact causes more complexity [3]. Due to existence of problems for solving nonlinear planning paradigm of setting asset problem, researchers use other quantitative planning methods for solving problem. In this scope, there is a complete surveyed by Board et.al [4]. Recently, pro-innovative methods are considered for solving optimizing and also there are several researchers in this scope. This paper shows portfolio optimization problem is solved by means of artificial colony of honeybee algorithm efficiently by considering integer restraint and also by considering that investors use several factors of risks like variance, semi variance, Mean absolute deviation and variance-skewness.
2.
OPTIMAL PORTFOLIO SELECTION
Portfolio optimization is selection of best pool of financial assets that leads to the highest returns and the lowest risk. Total idea is that if it is invested in assets that have no complete correlation, these assets’ risks can offset each other and cause investment to have constant returns with lower risk. One of the most important works in portfolio optimization is done by Markowitz (1952) that is called mean-variance model. But it should be considered that this standard model is based on two fundamental premises:1) Investors are risk averse and 2) Assets returns have normal distribution.
the main model. Several researchers tried to find absolute answer for this kind of problems bur it should be asserted that absolute solving techniques failed to solve any of them. So several researchers try to use innovative methods for solving portfolio optimization problems [5- 7]
3.
SEVERAL FACTORS FOR RISK
In different studies done in the scope of determining optimal portfolio, risk is considered as one of the main factors in determining optimal portfolio that it can be obviously observed in primary theories of Markowitz and also classic economists. For measuring risk of a portfolio, indicators like: Delta, Gamma, Vega, Theta and Rho and also methods like: variance-covariance, semi variance, mean absolute deviation, skewness coefficient, historical data simulation, Monte Carlo, can be used [2,8]. Each indicator and method estimates different dimensions of portfolio risk. However, Main goal in these indicators is measuring portfolio risk that is portfolio function one or more tradable tools in financial market. Markowitz estimated his quadratic model of optimization in this scope [2]. Mean-variance model of Markowitz is based on two fundamental premises. The premises of this model state that investors are risk averse and assets’ rate of return has normal distribution. But nowadays many studies show that returns distribution of several assets in real world often do not have normal distribution. So researchers assert that we cannot try to optimize portfolio just by means of mean-variance model of Markowitz .Based on this, huge amount of researchers suggest the enrichment of making fundamental model theoretically and also calculation. Besides, different factors of risk are suggested like semi variance, mean absolute deviation and skewness more than variance. Some of optimization models are argued below.3.1
Mean-variance Model
Up to 1952, making decisions for shares done independently and relationship between these shares were not noteworthy at all. For the first time in 1952 Markowitz, in his paper, introduces paradigm of solving problem of optimal set of assets selection. He introduced variance or standard deviation as a factor of risk and considered problem as quadratic planning and minimizing variance of a set assets by considering this restraint that expected returns are constant amount. Main premise of this paradigm is based on all investors’ risk aversion even if part of their return lost [9, 10]. This contains two restraints: 1. Based on the first restraint, sum of assets weights should be one and 2. Each asset’s weight should be non-negative and also real number. His model is as follows
:
In the preceding model n is the number of existent assets, is rate of total wealth that is invested in asset i, r is expected rate of returns of asset i and δ shows covariance of asset i and
asset j. This equation is a quadratic planning problem that can be solved by means of software. By solving this problem for different amount of parameter r, a set of efficient points is calculated. This set is called efficient frontier that shows points with least risk and most returns. For increasing effectiveness of model in designing efficient frontier, the following model can be used [11]:
In the preceding quantitative model, λ is a scaling parameter the amount of which change in interval [0, 1]. Λ shows a situation relationship of risk and returns, so by changing λ like change in expected returns, efficient frontier can be allocated by means of quadratic planning, as when λ=0, total amount of weighting coefficient is allocated to returns and portfolio with most returns will be selected and by considering λ=1 total amount of weighting coefficient is allocated to risk and portfolio with least risk will be selected. Finally, in distance between zero and one, portfolios with trading relationship with risk and returns are optimized. It means that with increasing λ coefficient, aim of decreasing risk gains more importance and because (1- λ) is decreased, weight of aim of maximizing returns will be less. K in above model shows number of assets that investor tends to keep in his portfolio and z is a variable with zero and one value that takes one when amount of asset in portfolio has more than zero and will take zero otherwise
3.2
Semi-Variance
Semi variance model is based on some premises that are investors are risk averse and the rate of returns distribution is normal. Semi variance is one of most famous adverse risk factors. Semi variance will be more useful when distribution is asymmetric and also when distribution is symmetric. Also semi-variance with the means of attained information by two statistics of variance and skewness in one criterion [12-14]. So far, reaching more realized situation adverse risk factors can be used in quadratic model of Markowitz instead of risk factor, variance.
Portfolio optimizing based on semi variance tries to decrease risk lower than the objective function and does not penalize portfolio because of more returns than goal. It should be noted that in conditions that all assets returns have normal distribution and or having the same degree of asymmetry, then both variance and semi variance make similar set of optimal portfolio [15]. To draw efficient frontier, it uses a model like presented model aforementioned by means of semi variance as risk factor but it should be noted that in this situation objective function of problem will be like equation 9.
3.3
Mean Absolute Deviation Model
Konno and Yamazaki (1991) introduced a model of optimizing portfolio based on mean absolute deviation model as an alternative for portfolio optimizing of Markowitz. Not standing these two problems of optimizing of Markowitz unlike theoretical fame and reputation, it is not suitable for solving optimizing problem in huge scale. Some of their reasons are stated bellow:
1. Complexity of calculation, 2. Investors’ feeling about risk and distribution problems of shares prices, 3. Cost of trading and cut off effect. Advantage of using mean absolute deviation model as risk factor is that portfolio optimization problem can be changed to a linear model by using it that solving it for optimizing problem with big scale is simple [10,16]. Mean absolute deviation model equals differences between portfolio returns in comparison with average returns and is calculated as below:
In cases that mean absolute deviation model is used as a factor of risk, portfolio optimization goal function will be like equation 14.
3.4
Variance-Skewness Model
One other way to show returns distribution and rendering more information to investors besides semi variance is skewness indicator simultaneously with variance. The third rank of moment importance in portfolio optimization problem introduced by Samuelson for the first time [17]. As said for semi variance, asset distribution can be not-normal. One useful way for showing returns distribution characteristics and supplying more information for investors can be considering skewness in portfolio optimization problem. But skewness in portfolio selection problem commenced 1991 by studies of Lai, Konno and Suzuki and Prakash et.al and after it dozens of studies by several titles and shapes had been done [18-20]. Many studies concluded that torque cannot be ignored just if assets have normal distribution and or utility function had been quadratic or higher degrees of moment are disjointed to
investment decision [17, 21, and 22]. It should be noted that risk-averse investors consider variance as a negative factor and skewness as a positive one in portfolio optimization. Optimization model in this case is as below:
λ
λ
Indicator that is added in above model to other models is the skewness coefficient for it, which is called discretionary coefficient that shows investors’ preferentiality between risk and skewness. Above equation considers the equilibrium of returns, variance and skewness simultaneously. For a specific , by using this model designing efficient bounder can be done that shows investor point of view about skewness. Positive value of skewness about returns shows decreasing in unpleasant risk that is pleasant for investors; skewness coefficient can be affected by both returns above and lower than average. So portfolios with equal skewness and different behavior about unpleasant risk can be reached
4.
ARTIFICAIL COLONY OF
HONEYBEE ALGORITHM
Algorithms which are not based on are inspired from honey bees. These kinds of algorithm for navigation in unknown zone are not used, but they use a direct strategy that is called unification of the road [23].
Artificial colony of honeybee algorithm is a searching algorithm actually that was made by stimulation of searching food behavior of honeybee groups for the first time in 2005 [24]. Artificial colony of honeybee is an effective technique for solving optimizing problem that is working based on exploring behavior of honeybee in nature [25-27]. In this algorithm, searching for food is done by three groups of honeybees, employed, onlooker and scout. These bees are structurally are similar but each of them does different works.
In this algorithm, problem variables are considered as food resource position. Amount of nectar of each food resource shows probability function and or fitness of solutions. Each food resource explored by one employed bee, so it can be said that food resources numbers equal to the number of bees.
information in memory, local information (visual information) and finding a food resource is done in neighborhood of that food resource. Then by considering aforementioned facts, new position of food resource is estimated. In honeybee algorithm, finding new resource in the neighborhood of last resource is done by means of one accidental factor (j) as below:
In this equation, is last food resource, is new food resource. j is a natural number that maximally equals to the number of problem variables (D) and K is selected accidentally among {1, 2, 3, …SN}. SN equals number of onlooker and employed bees in honeybee colony [24, 28]. In this step, employed bee does selection between and by considering amount of nectar in food resource. If fitness of is more than, employed honeybee memorizes new position and forgets last one. Then, employed honeybees come back to hive and help in decision making. It is assumed that each bee can understand and receive information from other bees and has an ability to find better solution by means of others information. In this base, employed bee can do one of below works:
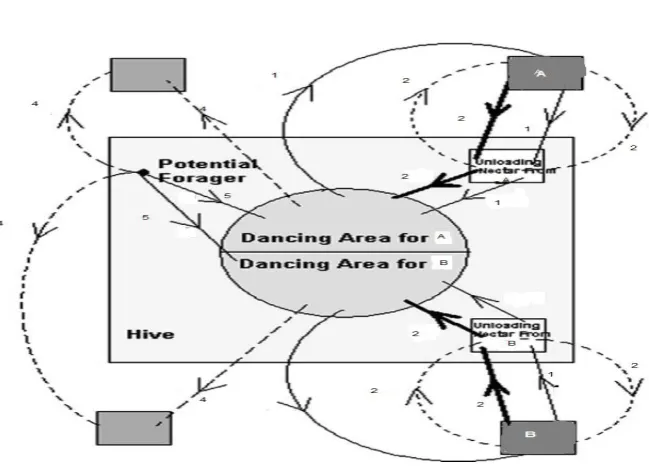
a. It leaves his own food resource and searches for bee that has resources with more quality in lounge (line with number 3 in fig. 1),
b. Without attracting anyone, go toward his own resource (solution) again (line with number 2 in fig. 1),
c. Try to gather other bees with harmonious movements in the lounge (line with number 1 in fig. 1)
[image:4.595.114.439.356.591.2]Find new information and decision making for food resource by onlooker bees. Onlooker bee’s estimates information about nectar food resource in lounge and by means of probability of them, best situation of food resource is selected. Then, fitness of selected food resources will be calculated by onlooker bees. After that they make a new food resource in neighborhood of last food resource and compare its amount of nectar with the last resources. After correcting selected food resource position by onlooker bees, employed bees will be sent to new food resources. This trend will be continued till the end and stopping of the plan. In artificial colony of honeybee algorithm, food resources that their nectar are consumed with employed bees and or with a new food resource which is devoid of nectar accidentally substituted (lines with numbers of 4 and 5 in fig. 1). This step is done by scout bees and assumes that if an unsuitable food resource is not corrected in specific interactions, it means that it is empty of nectar [24, 28]
Fig 1: Behavior of employed honey bee
4.1
Fitness Functions
4.2
Model Restraints
One thing that should be considered in algorithm planning for solving a problem is necessity of considering to the problem restraints and suitable space for it. Portfolio optimization problem has three restraints as bellow.
a) Weight of each asset in portfolio should be a positive value. By considering this fact that in coding presented algorithm, each node takes a number between zero and one, so weight of each asset will be a non-negative number.
b) Weight of each asset should be less or equal to one and sum of all assets’ weights in portfolio should be equals to one.
c) Restraints of integer number for numbers of shares in portfolio. In this paper’s model, one of restraints that is added to traditional models is giving restraints of integer number for shares numbers. By considering the fact that investors tend to keep specific amount of assets in their portfolio, so considering this restraint is a logic work. [7]
5.
RESULT OF RUNNING THE
ALGORITHM
In this part, calculation results of running algorithm is presented by considering restraint of integer number for shares numbers in portfolio. For this purpose this paper uses information of companies listed in Tehran Stock Exchange (TSE) for the period of 2005 to 2010. Survey population of this paper is determined by some provisions and conditions for increasing reliability of study as bellow:
1. Company should be listed in TSE before 2005 and exist in it till 2010.
2. Information of these companies should be available during this duration, therefore companies that did not have returns information for all 60 series of time studied in this paper have been omitted.
3. Their shares must have been traded actively during this period of time. For this purpose, companies selected that have at least 9 trading months and have at least 10 trading days in those months.
Therefore 122 companies of active companies listed in TSE have been studied. For implementing and running presented algorithm of this paper, its codes have been written and run by MATLAB Software. Model parameters of this paper determined based on literature of this topic and also previous researches. Number of repeating of algorithm by provision of ending algorithm equals to 400, population of bees is considered 2000. Variable K is considered as restraint of numbers of shares that investor tends to keep it in his portfolio.in this paper number of parameters are 3, 7, 10 and 15 respectively.
To show the efficiency of algorithm, simultaneously by calculation of results achieved by artificial colony of honeybee algorithm, and Genetic algorithm are calculated and compared by results of honeybee algorithm. Genetic algorithm presented in this paper is based on Genetic algorithm used in paper of Taghavifard (2006). This model is modified as bellow:
1. Maximum, minimum restraint for investment is not considered and
2. In integer number restraint for the number of shares, it is used restraint of less or equal. To run and evaluate the presented algorithm in this paper, its codes are written and run in MATLAB Software. This model parameter is determined as bellow: number of repeating algorithm by stop criterion is considered 1000, population of each generation 20, and mutation rate is 0.05.
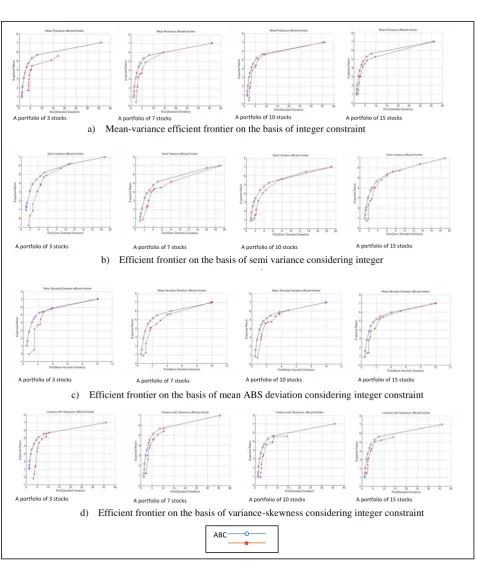
As it is obvious from the fig. 2, in the figures optimization of portfolio is done by use of honeybee colony algorithm. In each of them the restraint of integer number for existent number of shares in portfolio is presented. As it is presented in these figures, presented honeybee colony algorithm can solve portfolio optimization problem by considering restraint of integer number based on different risk factors very well.
Fig 2: Comparison between artificial colonies of honeybee algorithm in different situations
A portfolio of 3 stocks A portfolio of 7 stocks A portfolio of 10 stocks A portfolio of 15 stocks a) Mean-variance efficient frontier on the basis of integer constraint
A portfolio of 3 stocks A portfolio of 7 stocks A portfolio of 10 stocks A portfolio of 15 stocks b) Efficient frontier on the basis of semi variance considering integer
constraint
A portfolio of 3 stocks A portfolio of 7 stocks A portfolio of 10 stocks A portfolio of 15 stocks
c) Efficient frontier on the basis of mean ABS deviation considering integer constraint
d) Efficient frontier on the basis of variance-skewness considering integer constraint A portfolio of 3 stocks A portfolio of 7 stocks A portfolio of 10 stocks A portfolio of 15 stocks
ABC
6.
Conclusion
The main purpose of this paper is studying designing efficient frontier based on different factors of risk. In this study it is tried to optimize different models of optimization of portfolio by means of artificial colony of honeybee algorithm based on different factors of risks variance, semi variance, mean absolute deviation and variance-skewness that as it is obvious in fig. 2, in all studied conditions, presented algorithm has better result than Genetic algorithm. For further researches portfolio optimization by using methods such as Ant colony or Particle Swarm Optimization (PSO) is suggested, further more adding other criteria such as liquidity and considering other limitations in stock market such as trading costs, trading volumes and so on can also be appropriate.
7.
REFERENCES
[1] A. Fernandez, S. Gomez, “ Portfolio Selection Using Neural Networks, “Computers & Operations Research, 2007
[2] J. Hull, Options, Futures and Other Derivatives, Prentice Hall, New York, 2000
[3] A. Loraschi, A. Tattamanzi, M. Tomassini, P. Verda, “Distributed Genetic Algorithms with an Application to Portfolio Selection Problems,”In Proceedings of the Int. Conf. on Artificial Neural Nets and Genetic Algorithms. Springer-Verlag, 384, 1995
[4] J. Board, C. Sutcliffe, W. Ziemba, “The Application of Operations Research Techniques to Financial Markets, “Management Science, April.1999
[5] M. T. Taghavifard, T. Mansori, , M.khoshniyat, “The presentation of an innovative algorithm in portfolio selection considering integer constraints, “Economic researches journal(Persian), (2006)
[6] N. Mohammadi estakhri, “Portfolio selection in tehran stoch exchange by the means of genetic algorithm optimization. “M.S. thesis, Tehran university, Tehran, Iran, 2005.
[7] H. Najafpour, “portfolio optimization by the means of memetic algorithms, “M.S. thesis, Tehran university, Tehran, Iran, 2009
[8] H. Markowitz, Portfolio Selection: Efficient
Diversification of Investments, Wiley, New York, 1959
[9] A. P. Engelbrecht, Fundamentals of computational swarm intelligence, John Wiely & Sons Ltd 2005
[10]H. Konno, H. Yamazaki, “Mean-absolute deviation portfolio optimization model and its application to the Tokyo Stock Market, “Management Science, 37, 519– 531, 1991
[11]W. Fenjie, “A Framework for memetic algorithms, M.S. thesis, Univercity of Auckland, 2001.
[12]J. Estrada, “Mean–Semi variance behavior: an alternative behavioral model, “Journal of Emerging Market Finance, 3, pp. 231-248 2004.
[13]J. Estrada, “Mean-Semi variance behavior: downside risk and capital asset pricing, “International Review Economic Finance, 16, pp. 169-185, 2007.
[14] J. Estrada, “The cost of equity in emerging markets: a downside risk approach, “Emerge Mark Quart, PP.19-30, 2000.
[15] H. Markowitz, “Portfolio selection, “Journal of Finance, 1952
[16] T. J. Chang, S. C. Yang, K. J. Chang, “Portfolio optimization problems in different risk measures using genetic algorithm, “Expert Systems with Applications, 2009
[17] P. Samuelson, “The fundamental approximation theorem of portfolio analysis in terms of means variances and higher moments, “Review of Economic Studies,25:65– 86, 1958
[18] T. Lai, “Portfolio selection with skewness: a multiple– objective approach, “Review of the Quantitative Finance and Accounting 1 (1991) 293–305. and Finance 21 (1997) 143–167.
[19] H. Konno, K. Suzuki, “A mean-variance-skewness optimization model. “Journal of the Operations Research of Japan, 38, 137–87, 1995
[20] A. J. Prakash, C. Chang, T. E. Pactwa, “Selecting a portfolio with skewness: recent evidence from US, European and Latin American equity markets, “Journal of Banking and Finance, Volume 27, pp. 1375-1390, July 2003
[21] F. D. Arditti, “Risk and required return on equity,” Journal of Finance, 22:19–36, 1967
[22] F. D. Arditti, “Another look at mutual fund performance, “Journal of Financial and Quantitative Analysis,;6, PP.909–912. 1971
[23] N. Lemmens, S. D. Jomg, K. Tuyls, A. Nowe, “A Bee Algorithm for Multi-Agent Systems: Recruitment and navigation combined. ” In Proceedings of ALAG, an AAMAS workshop. may. 2007.
[24] D. Karaboga, “An idea based on honey bee swarm for numer-ical optimization, “Technical Report- TR06, oct.2005.
[25] D. Karaboga, B. Basturk, "A powerful and Efficient Algorithm for Numerical Function Optimization: Artificial Bee Colony (ABC) Algorithm, "Journal of Global Optomization, vol. 39, pp. 459-471, November 2007.
[26] D, Karaboga, B. Basturk, B., "On the Performance of Artificial Bee Colony (ABC) Algorithm, "Journal of Soft computing, vol. 8, pp. 687-697, January 2008.
[27] D. Karaboga, B. Basturk, “Artificial Bee Colony (ABC) Optimization Algorithm for Solving constrained Optimization Problems, “springer, pp. 789-798, 2007.
[28] D. Karaboga, B. Akay, “A comparative study of Artificial Bee Colony algorithm,” Applied Mathematics and Computation, vol. 214, pp. 108-132, 2009